
ChatOpsLLM
To simplify and streamline LLM operations, empowering developers and organizations to harness the full potential of large language models with ease.
Stars: 87
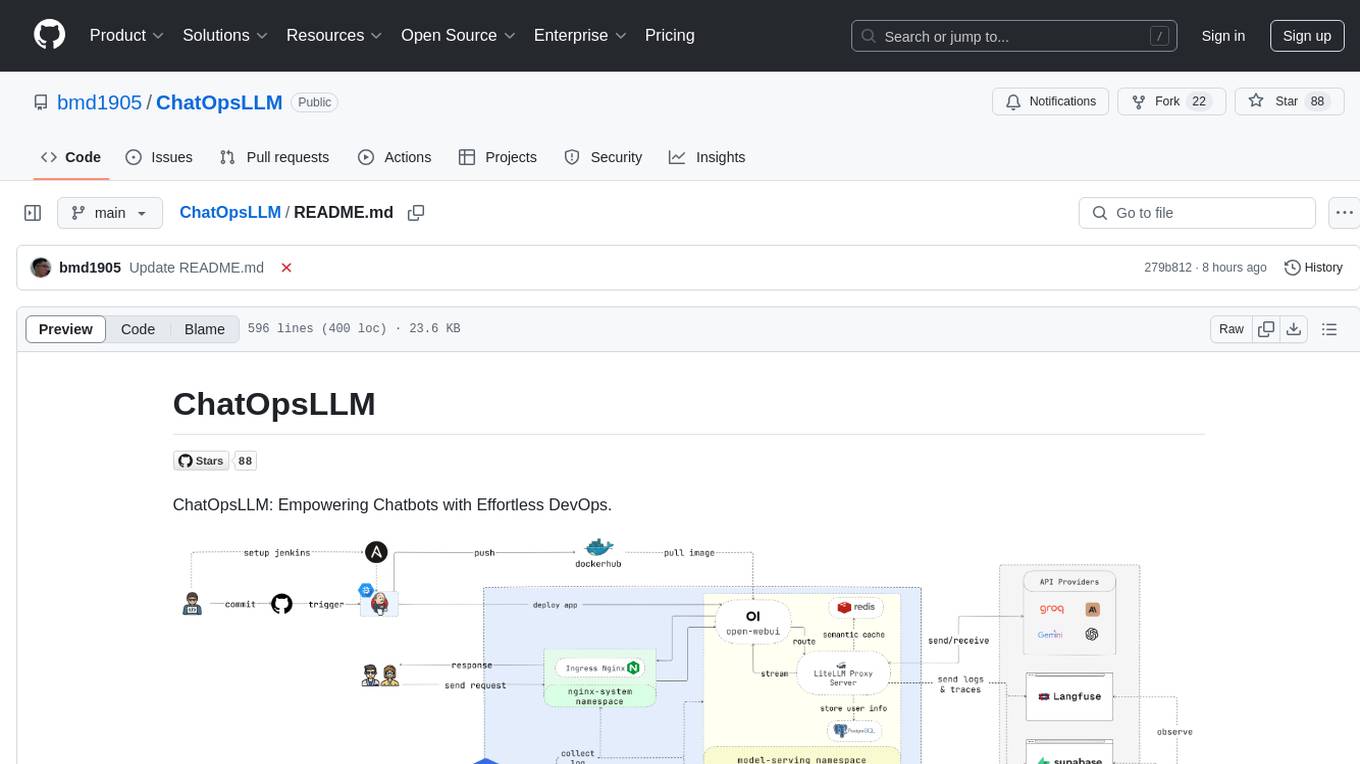
ChatOpsLLM is a project designed to empower chatbots with effortless DevOps capabilities. It provides an intuitive interface and streamlined workflows for managing and scaling language models. The project incorporates robust MLOps practices, including CI/CD pipelines with Jenkins and Ansible, monitoring with Prometheus and Grafana, and centralized logging with the ELK stack. Developers can find detailed documentation and instructions on the project's website.
README:
ChatOpsLLM: Empowering Chatbots with Effortless DevOps.
ChatOpsLLM is a project built with Open WebUI that can be deployed on Google Kubernetes Engine (GKE) for managing and scaling language models. It offers both Terraform and manual deployment methods, and incorporates robust MLOps practices. This includes CI/CD pipelines with Jenkins and Ansible for automation, monitoring with Prometheus and Grafana for performance insights, and centralized logging with the ELK stack for troubleshooting and analysis. Developers can find detailed documentation and instructions on the project's website.
https://github.com/user-attachments/assets/cf84a434-0dae-47b9-a93d-49a37965d968
- Ease of Use: ChatOpsLLM provides an intuitive interface and streamlined workflows that make managing LLMs simple and efficient, regardless of your experience level.
- Scalability & Flexibility: Scale your LLM deployments effortlessly, adapt to evolving needs, and integrate seamlessly with your existing infrastructure.
- Reduced Complexity: Eliminate the hassle of complex configurations and infrastructure management, allowing you to focus on building and deploying powerful LLM applications.
- Enhanced Productivity: Accelerate your LLM development lifecycle, optimize performance, and maximize the impact of your language models.
Developers building and deploying LLM-powered applications. Data scientists and machine learning engineers working with LLMs. DevOps teams responsible for managing LLM infrastructure. Organizations looking to integrate LLMs into their operations.
- Introduction
- Features
- Target Audience
-
Getting Started
- Quick Start
- Using Terraform for Google Kubernetes Engine (GKE)
- Manual Deployment to GKE
- Continuous Integration/Continuous Deployment (CI/CD) with Jenkins and Ansible
- Monitoring with Prometheus and Grafana
- Logging with Filebeat + Logstash + Elasticsearch + Kibana
- Optimize Cluster with Cast AI
- Log and Trace with Langfuse and Supabase
- Contributing
- License
- Citation
- Contact
In case you don't want to spend much time, please run this script and enjoy your coffee:
chmod +x ./cluster.sh
./cluster.sh
Remember to authenticate with GCP before using Terraform:
gcloud auth application-default loginThis section provides a very quick start guide to get the application up and running as soon as possible. Please refer to the following sections for more detailed instructions.
If you're deploying the application to GKE, you can use Terraform to automate the setup of your Kubernetes cluster. Navigate to the iac/terraform directory and initialize Terraform:
cd iac/terraform
terraform init
Plan and Apply Configuration:
Generate an execution plan to verify the resources that Terraform will create or modify, and then apply the configuration to set up the cluster:
terraform plan
terraform apply
2. Retrieve Cluster Information:
To interact with your GKE cluster, you'll need to retrieve its configuration. You can view the current cluster configuration with the following command:
cat ~/.kube/confighttps://github.com/user-attachments/assets/3133c2a8-8475-45c6-8900-96c2af8c5ad5
Ensure your kubectl context is set correctly to manage the cluster.
For a more hands-on deployment process, follow these steps:
1. Deploy Nginx Ingress Controller:
The Nginx Ingress Controller manages external access to services in your Kubernetes cluster. Create a namespace and install the Ingress Controller using Helm:
kubectl create ns nginx-system
kubens nginx-system
helm upgrade --install nginx-ingress ./deployments/nginx-ingress
Please story the Nginx Ingress Controller's IP address, as you'll need it later.
https://github.com/user-attachments/assets/f329a8ee-cd4d-44e8-bb12-d1ff39dce4b8
Store your environment variables, such as API keys, securely in Kubernetes secrets. Create a namespace for model serving and create a secret from your .env file:
kubectl create ns model-serving
kubens model-serving
kubectl delete secret ChatOpsLLM-env
kubectl create secret generic ChatOpsLLM-env --from-env-file=.env -n model-serving
kubectl describe secret ChatOpsLLM-env -n model-serving
https://github.com/user-attachments/assets/fab6aa93-2f68-4f36-a4d8-4a1d955596f2
Kubernetes resources often require specific permissions. Apply the necessary roles and bindings:
cd deployments/infrastructure
kubectl apply -f role.yaml
kubectl apply -f rolebinding.yaml
https://github.com/user-attachments/assets/9c1aa6e1-6b8c-4332-ab11-513428ef763b
4. Deploy caching service using Redis:
Now, deploy the semantic caching service using Redis:
cd ./deployments/redis
helm dependency build
helm upgrade --install redis .
https://github.com/user-attachments/assets/ef37626a-9a98-473e-a7e0-effcaa262ad5
Deploy the LiteLLM service:
kubens model-serving
helm upgrade --install litellm ./deployments/litellm
https://github.com/user-attachments/assets/0c98fe90-f958-42fc-9fa6-224dcf417e29
Next, Deploy the web UI to your GKE cluster:
cd open-webui
kubectl apply -f ./kubernetes/manifest/base -n model-serving
https://github.com/user-attachments/assets/60ad30e3-e8f8-49a6-ab96-d895fe7986cb
7. Play around with the Application:
Open browser and navigate to the URL of your GKE cluster (e.g. http://172.0.0.0 in step 1) and add .nip.io to the end of the URL (e.g. http://172.0.0.0.nip.io). You should see the Open WebUI:
https://github.com/user-attachments/assets/4115a1f0-e513-4c58-a359-1d49683905a8
For automated CI/CD pipelines, use Jenkins and Ansible as follows:
First, create a Service Account and assign it the Compute Admin role. Then create a Json key file for the Service Account and store it in the iac/ansible/secrets directory.
Next create a Google Compute Engine instance named "jenkins-server" running Ubuntu 22.04 with a firewall rule allowing traffic on ports 8081 and 50000.
ansible-playbook iac/ansible/deploy_jenkins/create_compute_instance.yamlDeploy Jenkins on a server by installing prerequisites, pulling a Docker image, and creating a privileged container with access to the Docker socket and exposed ports 8081 and 50000.
ansible-playbook -i iac/ansible/inventory iac/ansible/deploy_jenkins/deploy_jenkins.yamlhttps://github.com/user-attachments/assets/35dae326-aa8f-4779-bf67-2b8d9f71487b
To access the Jenkins server through SSH, we need to create a public/private key pair. Run the following command to create a key pair:
ssh-keygenOpen Metadata and copy the ssh-keys value.
https://github.com/user-attachments/assets/8fd956be-d2db-4d85-aa7c-f78df160c00c
We need to find the Jenkins server password to be able to access the server. First, access the Jenkins server:
ssh <USERNAME>:<EXTERNAL_IP>Then run the following command to get the password:
sudo docker exec -it jenkins-server bash
cat /var/jenkins_home/secrets/initialAdminPassword
https://github.com/user-attachments/assets/08cb4183-a383-4dd2-89e3-da6e74b92d04
Once Jenkins is deployed, access it via your browser:
http://<EXTERNAL_IP>:8081
https://github.com/user-attachments/assets/4f0d3287-39ec-40e7-b333-9287ee37f9fc
Install the following plugins to integrate Jenkins with Docker, Kubernetes, and GKE:
- Docker
- Docker Pipeline
- Kubernetes
- Google Kubernetes Engine
After installing the plugins, restart Jenkins.
sudo docker restart jenkins-serverhttps://github.com/user-attachments/assets/923f7aff-3983-4b3d-8ef5-17d2285aed63
4.1. Add webhooks to your GitHub repository to trigger Jenkins builds.
Go to the GitHub repository and click on Settings. Click on Webhooks and then click on Add Webhook. Enter the URL of your Jenkins server (e.g. http://<EXTERNAL_IP>:8081/github-webhook/). Then click on Let me select individual events and select Let me select individual events. Select Push and Pull Request and click on Add Webhook.
https://github.com/user-attachments/assets/d6ec020a-3e93-4ce8-bf80-b9f63b227635
4.2. Add Github repository as a Jenkins source code repository.
Go to Jenkins dashboard and click on New Item. Enter a name for your project (e.g. easy-llmops) and select Multibranch Pipeline. Click on OK. Click on Configure and then click on Add Source. Select GitHub and click on Add. Enter the URL of your GitHub repository (e.g. https://github.com/bmd1905/ChatOpsLLM). In the Credentials field, select Add and select Username with password. Enter your GitHub username and password (or use a personal access token). Click on Test Connection and then click on Save.
https://github.com/user-attachments/assets/57c97866-caf3-4864-92c9-b91863822591
4.3. Setup docker hub credentials.
First, create a Docker Hub account. Go to the Docker Hub website and click on Sign Up. Enter your username and password. Click on Sign Up. Click on Create Repository. Enter a name for your repository (e.g. easy-llmops) and click on Create.
From Jenkins dashboard, go to Manage Jenkins > Credentials. Click on Add Credentials. Select Username with password and click on Add. Enter your Docker Hub username, access token, and set ID to dockerhub.
https://github.com/user-attachments/assets/3df2f7e2-d284-4da9-82fb-cc65ebb6240b
4.4. Setup Kubernetes credentials.
First, create a Service Account for the Jenkins server to access the GKE cluster. Go to the GCP console and navigate to IAM & Admin > Service Accounts. Create a new service account with the Kubernetes Engine Admin role. Give the service account a name and description. Click on the service account and then click on the Keys tab. Click on Add Key and select JSON as the key type. Click on Create and download the JSON file.
https://github.com/user-attachments/assets/d294a5a3-8a3d-4271-b20c-3ebf237f4005
Then, from Jenkins dashboard, go to Manage Jenkins > Cloud. Click on New cloud. Select Kubernetes. Enter the name of your cluster (e.g. gke-easy-llmops-cluster-1), enter the URL and Certificate from your GKE cluster. In the Kubernetes Namespace, enter the namespace of your cluster (e.g. model-serving). In the Credentialsfield, selectAddand selectGoogle Service Account from private`. Enter your project-id and the path to the JSON file.
https://github.com/user-attachments/assets/489ce405-a31f-4f56-94bb-faebe1edd849
Push a new commit to your GitHub repository. You should see a new build in Jenkins.
https://github.com/user-attachments/assets/7f4d9286-b41f-4218-a970-fd45c8ecd01c
First, create a Discord webhook. Go to the Discord website and click on Server Settings. Click on Integrations. Click on Create Webhook. Enter a name for your webhook (e.g. easy-llmops-discord-webhook) and click on Create. Copy the webhook URL.
https://github.com/user-attachments/assets/2f1258f0-b3c7-4b3b-8cc4-802034600a82
2. Configure Helm Repositories
First, we need to add the necessary Helm repositories for Prometheus and Grafana:
helm repo add prometheus-community https://prometheus-community.github.io/helm-charts
helm repo add grafana https://grafana.github.io/helm-charts
helm repo update
These commands add the official Prometheus and Grafana Helm repositories and update your local Helm chart information.
Prometheus requires certain dependencies that can be managed with Helm. Navigate to the monitoring directory and build these dependencies:
helm dependency build ./deployments/monitoring/kube-prometheus-stackNow, we'll deploy Prometheus and its associated services using Helm:
kubectl create namespace monitoring
helm upgrade --install -f deployments/monitoring/kube-prometheus-stack.expanded.yaml kube-prometheus-stack deployments/monitoring/kube-prometheus-stack -n monitoring
This command does the following:
-
helm upgrade --install: This will install Prometheus if it doesn't exist, or upgrade it if it does. -
-f deployments/monitoring/kube-prometheus-stack.expanded.yaml: This specifies a custom values file for configuration. -
kube-prometheus-stack: This is the release name for the Helm installation. -
deployments/monitoring/kube-prometheus-stack: This is the chart to use for installation. -
-n monitoring: This specifies the namespace to install into.
https://github.com/user-attachments/assets/6828527c-9561-42bc-a221-fbbaf9097233
By default, the services are not exposed externally. To access them, you can use port-forwarding:
For Prometheus:
kubectl port-forward -n monitoring svc/kube-prometheus-stack-prometheus 9090:9090Then access Prometheus at http://localhost:9090
For Grafana:
kubectl port-forward -n monitoring svc/kube-prometheus-stack-grafana 3000:80Then access Grafana at http://localhost:3000
The default credentials for Grafana are usually:
- Username: admin
- Password: prom-operator (you should change this immediately)
https://github.com/user-attachments/assets/a9a2e7f7-0a88-4e21-ba63-7a3f993d1c78
First we need to create a sample alert. Navigate to the monitoring directory and run the following command:
kubectl port-forward -n monitoring svc/alertmanager-operated 9093:9093Then, in a new terminal, run the following command:
curl -XPOST -H "Content-Type: application/json" -d '[
  {
    "labels": {
      "alertname": "DiskSpaceLow",
      "severity": "critical",
      "instance": "server02",
      "job": "node_exporter",
      "mountpoint": "/data"
    },
    "annotations": {
      "summary": "Disk space critically low",
      "description": "Server02 has only 5% free disk space on /data volume"
    },
    "startsAt": "2023-09-01T12:00:00Z",
    "generatorURL": "http://prometheus.example.com/graph?g0.expr=node_filesystem_free_bytes+%2F+node_filesystem_size_bytes+%2A+100+%3C+5"
  },
  {
    "labels": {
      "alertname": "HighMemoryUsage",
      "severity": "warning",
      "instance": "server03",
      "job": "node_exporter"
    },
    "annotations": {
      "summary": "High memory usage detected",
      "description": "Server03 is using over 90% of its available memory"
    },
    "startsAt": "2023-09-01T12:05:00Z",
    "generatorURL": "http://prometheus.example.com/graph?g0.expr=node_memory_MemAvailable_bytes+%2F+node_memory_MemTotal_bytes+%2A+100+%3C+10"
  }
]' http://localhost:9093/api/v2/alerts
This command creates a sample alert. You can verify that the alert was created by running the following command:
curl http://localhost:9093/api/v2/statusOr, you can manually check the Discord channel.
https://github.com/user-attachments/assets/a5716e8c-ecd1-4457-80e9-27f23518bd1b
This setup provides comprehensive monitoring capabilities for your Kubernetes cluster. With Prometheus collecting metrics and Grafana visualizing them, you can effectively track performance, set up alerts for potential issues, and gain valuable insights into your infrastructure and applications.
Centralized logging is essential for monitoring and troubleshooting applications deployed on Kubernetes. This section guides you through setting up an ELK stack (Elasticsearch, Logstash, Kibana) with Filebeat for logging your GKE cluster.
You can use this single helmfile script to kick off the ELK stack:
cd deployments/ELK
helmfile sync
1. Install ELK Stack with Helm
We will use Helm to deploy the ELK stack components:
- Elasticsearch: Stores the logs.
- Logstash: Processes and filters the logs.
- Kibana: Provides a web UI for visualizing and searching logs.
- Filebeat: Collects logs from your pods and forwards them to Logstash.
First, create a namespace for the logging components:
kubectl create ns logging
kubens logging
Next, install Elasticsearch:
helm install elk-elasticsearch elastic/elasticsearch -f deployments/ELK/elastic.expanded.yaml --namespace logging --create-namespaceWait for Elasticsearch to be ready:
echo "Waiting for Elasticsearch to be ready..."
kubectl wait --for=condition=ready pod -l app=elasticsearch-master --timeout=300s
Create a secret for Logstash to access Elasticsearch:
kubectl create secret generic logstash-elasticsearch-credentials \
  --from-literal=username=elastic \
  --from-literal=password=$(kubectl get secrets --namespace=logging elasticsearch-master-credentials -ojsonpath='{.data.password}' | base64 -d)
Install Kibana:
helm install elk-kibana elastic/kibana -f deployments/ELK/kibana.expanded.yamlInstall Logstash:
helm install elk-logstash elastic/logstash -f deployments/ELK/logstash.expanded.yamlInstall Filebeat:
helm install elk-filebeat elastic/filebeat -f deployments/ELK/filebeat.expanded.yamlhttps://github.com/user-attachments/assets/75dbde44-6ce4-432d-9851-143e13a60fce
Expose Kibana using a service and access it through your browser:
kubectl port-forward -n logging svc/elk-kibana-kibana 5601:5601Please use this script to get the Kibana password:
kubectl get secrets --namespace=logging elasticsearch-master-credentials -ojsonpath='{.data.password}' | base64 -dOpen your browser and navigate to http://localhost:5601.
You should now be able to see logs from your Kubernetes pods in Kibana. You can create dashboards and visualizations to analyze your logs and gain insights into your application's behavior.
https://github.com/user-attachments/assets/a767e143-4fd2-406c-bf9f-9c5714b7404d
Please go to Cast AI to sign up for a free account and get the TOKEN.
Then run this line to connect to GKE:
curl -H "Authorization: Token <TOKEN>" "https://api.cast.ai/v1/agent.yaml?provider=gke" | kubectl apply -f -Hit I ran this script on Cast AI's UI, then copy the configuration code and paste it into the terminal:
CASTAI_API_TOKEN=<API_TOKEN> CASTAI_CLUSTER_ID=<CASTAI_CLUSTER_ID> CLUSTER_NAME=easy-llmops-gke INSTALL_AUTOSCALER=true INSTALL_POD_PINNER=true INSTALL_SECURITY_AGENT=true LOCATION=asia-southeast1-b PROJECT_ID=easy-llmops /bin/bash -c "$(curl -fsSL 'https://api.cast.ai/v1/scripts/gke/onboarding.sh')"Hit I ran this script again and waite for the installation to complete.
Then you can see your dashboards on Cast AI's UI:
It's time to optimize your cluster with Cast AI! Go go the Available savings seaction and click Rebalance button.
- Langfuse is an open source LLM engineering platform - LLM observability, metrics, evaluations, prompt management.
- Supabase is an open source Firebase alternative. Start your project with a Postgres database, Authentication, instant APIs, Edge Functions, Realtime subscriptions, Storage, and Vector embeddings.
Please go to Langfuse and Supabase to sign up for a free account and get API keys, then replace the placehoders in .env.example file with your API keys.
We welcome contributions to ChatOpsLLM! Please see our CONTRIBUTING.md for more information on how to get started.
ChatOpsLLM is released under the MIT License. See the LICENSE file for more details.
If you use ChatOpsLLM in your research, please cite it as follows:
@software{ChatOpsLLM2024,
  author = {Minh-Duc Bui},
  title = {ChatOpsLLM: Effortless MLOps for Powerful Language Models.},
  year = {2024},
  url = {https://github.com/bmd1905/ChatOpsLLM}
}
For questions, issues, or collaborations, please open an issue on our GitHub repository or contact the maintainers directly.
For Tasks:
Click tags to check more tools for each tasksFor Jobs:
Alternative AI tools for ChatOpsLLM
Similar Open Source Tools

ChatOpsLLM
ChatOpsLLM is a project designed to empower chatbots with effortless DevOps capabilities. It provides an intuitive interface and streamlined workflows for managing and scaling language models. The project incorporates robust MLOps practices, including CI/CD pipelines with Jenkins and Ansible, monitoring with Prometheus and Grafana, and centralized logging with the ELK stack. Developers can find detailed documentation and instructions on the project's website.
middleware
Middleware is an open-source engineering management tool that helps engineering leaders measure and analyze team effectiveness using DORA metrics. It integrates with CI/CD tools, automates DORA metric collection and analysis, visualizes key performance indicators, provides customizable reports and dashboards, and integrates with project management platforms. Users can set up Middleware using Docker or manually, generate encryption keys, set up backend and web servers, and access the application to view DORA metrics. The tool calculates DORA metrics using GitHub data, including Deployment Frequency, Lead Time for Changes, Mean Time to Restore, and Change Failure Rate. Middleware aims to provide DORA metrics to users based on their Git data, simplifying the process of tracking software delivery performance and operational efficiency.
shortest
Shortest is a project for local development that helps set up environment variables and services for a web application. It provides a guide for setting up Node.js and pnpm dependencies, configuring services like Clerk, Vercel Postgres, Anthropic, Stripe, and GitHub OAuth, and running the application and tests locally.
steel-browser
Steel is an open-source browser API designed for AI agents and applications, simplifying the process of building live web agents and browser automation tools. It serves as a core building block for a production-ready, containerized browser sandbox with features like stealth capabilities, text-to-markdown session management, UI for session viewing/debugging, and full browser control through popular automation frameworks. Steel allows users to control, run, and manage a production-ready browser environment via a REST API, offering features such as full browser control, session management, proxy support, extension support, debugging tools, anti-detection mechanisms, resource management, and various browser tools. It aims to streamline complex browsing tasks programmatically, enabling users to focus on their AI applications while Steel handles the underlying complexity.
robocorp
Robocorp is a platform that allows users to create, deploy, and operate Python automations and AI actions. It provides an easy way to extend the capabilities of AI agents, assistants, and copilots with custom actions written in Python. Users can create and deploy tools, skills, loaders, and plugins that securely connect any AI Assistant platform to their data and applications. The Robocorp Action Server makes Python scripts compatible with ChatGPT and LangChain by automatically creating and exposing an API based on function declaration, type hints, and docstrings. It simplifies the process of developing and deploying AI actions, enabling users to interact with AI frameworks effortlessly.
well-architected-iac-analyzer
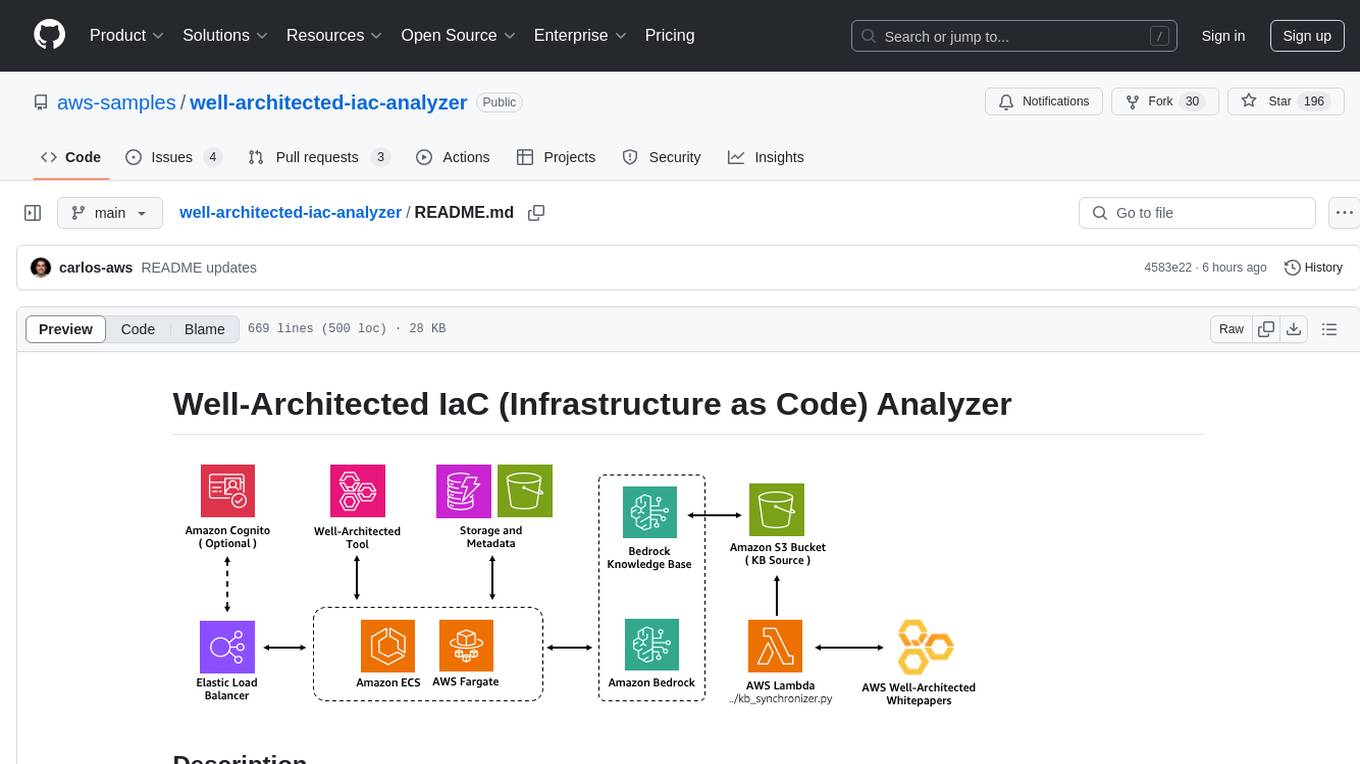
Well-Architected Infrastructure as Code (IaC) Analyzer is a project demonstrating how generative AI can evaluate infrastructure code for alignment with best practices. It features a modern web application allowing users to upload IaC documents, complete IaC projects, or architecture diagrams for assessment. The tool provides insights into infrastructure code alignment with AWS best practices, offers suggestions for improving cloud architecture designs, and can generate IaC templates from architecture diagrams. Users can analyze CloudFormation, Terraform, or AWS CDK templates, architecture diagrams in PNG or JPEG format, and complete IaC projects with supporting documents. Real-time analysis against Well-Architected best practices, integration with AWS Well-Architected Tool, and export of analysis results and recommendations are included.
tiledesk-dashboard
Tiledesk is an open-source live chat platform with integrated chatbots written in Node.js and Express. It is designed to be a multi-channel platform for web, Android, and iOS, and it can be used to increase sales or provide post-sales customer service. Tiledesk's chatbot technology allows for automation of conversations, and it also provides APIs and webhooks for connecting external applications. Additionally, it offers a marketplace for apps and features such as CRM, ticketing, and data export.
rag-gpt
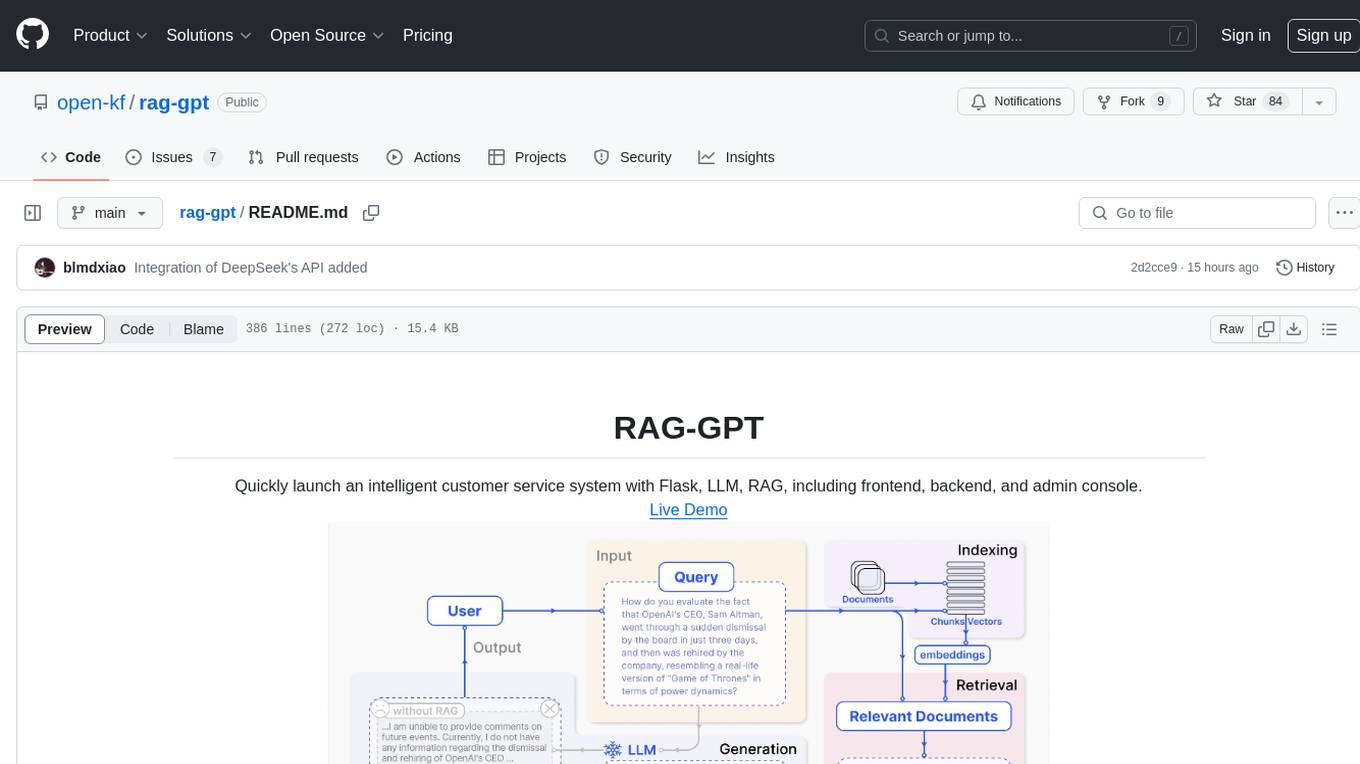
RAG-GPT is a tool that allows users to quickly launch an intelligent customer service system with Flask, LLM, and RAG. It includes frontend, backend, and admin console components. The tool supports cloud-based and local LLMs, enables deployment of conversational service robots in minutes, integrates diverse knowledge bases, offers flexible configuration options, and features an attractive user interface.
SWELancer-Benchmark
SWE-Lancer is a benchmark repository containing datasets and code for the paper 'SWE-Lancer: Can Frontier LLMs Earn $1 Million from Real-World Freelance Software Engineering?'. It provides instructions for package management, building Docker images, configuring environment variables, and running evaluations. Users can use this tool to assess the performance of language models in real-world freelance software engineering tasks.
torchchat
torchchat is a codebase showcasing the ability to run large language models (LLMs) seamlessly. It allows running LLMs using Python in various environments such as desktop, server, iOS, and Android. The tool supports running models via PyTorch, chatting, generating text, running chat in the browser, and running models on desktop/server without Python. It also provides features like AOT Inductor for faster execution, running in C++ using the runner, and deploying and running on iOS and Android. The tool supports popular hardware and OS including Linux, Mac OS, Android, and iOS, with various data types and execution modes available.
frontend
Nuclia frontend apps and libraries repository contains various frontend applications and libraries for the Nuclia platform. It includes components such as Dashboard, Widget, SDK, Sistema (design system), NucliaDB admin, CI/CD Deployment, and Maintenance page. The repository provides detailed instructions on installation, dependencies, and usage of these components for both Nuclia employees and external developers. It also covers deployment processes for different components and tools like ArgoCD for monitoring deployments and logs. The repository aims to facilitate the development, testing, and deployment of frontend applications within the Nuclia ecosystem.
lexido
Lexido is an innovative assistant for the Linux command line, designed to boost your productivity and efficiency. Powered by Gemini Pro 1.0 and utilizing the free API, Lexido offers smart suggestions for commands based on your prompts and importantly your current environment. Whether you're installing software, managing files, or configuring system settings, Lexido streamlines the process, making it faster and more intuitive.
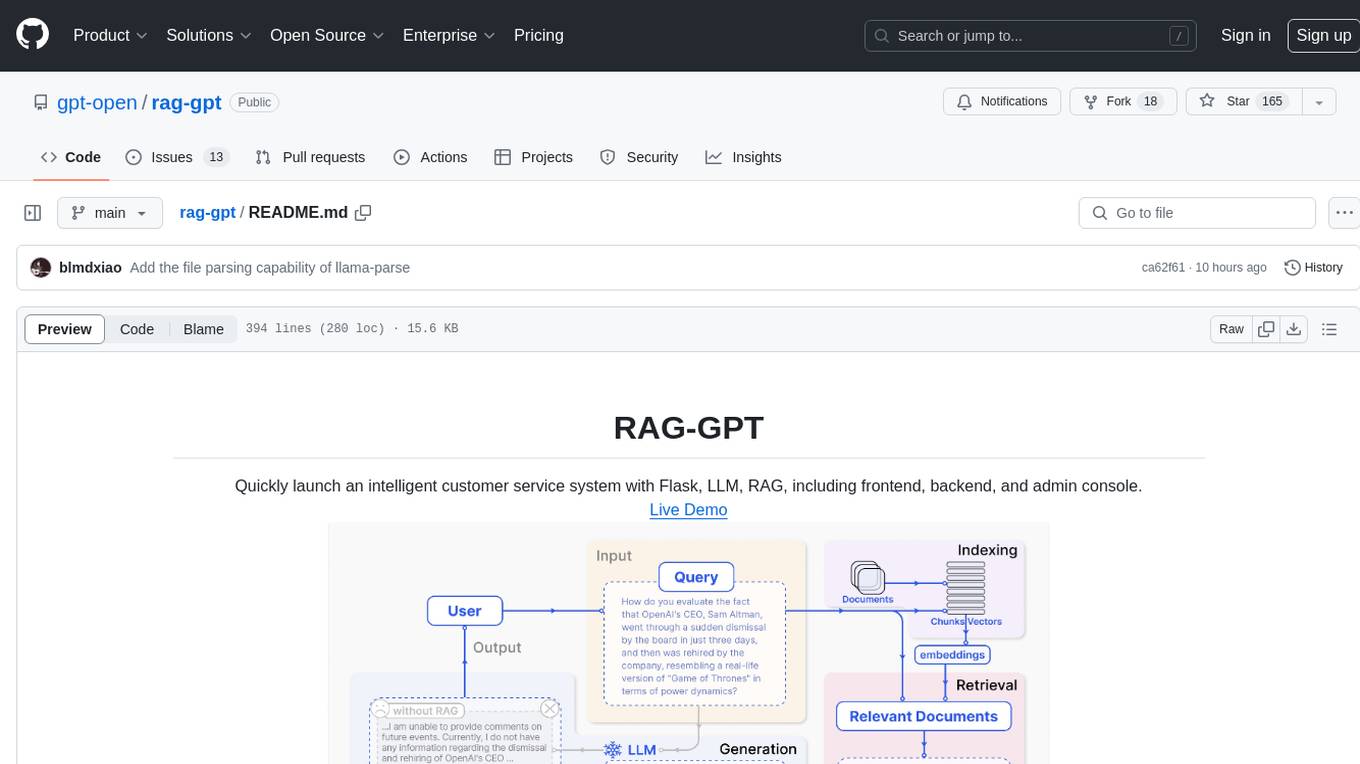
rag-gpt
RAG-GPT is a tool that allows users to quickly launch an intelligent customer service system with Flask, LLM, and RAG. It includes frontend, backend, and admin console components. The tool supports cloud-based and local LLMs, offers quick setup for conversational service robots, integrates diverse knowledge bases, provides flexible configuration options, and features an attractive user interface.
vector-inference
This repository provides an easy-to-use solution for running inference servers on Slurm-managed computing clusters using vLLM. All scripts in this repository run natively on the Vector Institute cluster environment. Users can deploy models as Slurm jobs, check server status and performance metrics, and shut down models. The repository also supports launching custom models with specific configurations. Additionally, users can send inference requests and set up an SSH tunnel to run inference from a local device.
cursor-tools
cursor-tools is a CLI tool designed to enhance AI agents with advanced skills, such as web search, repository context, documentation generation, GitHub integration, Xcode tools, and browser automation. It provides features like Perplexity for web search, Gemini 2.0 for codebase context, and Stagehand for browser operations. The tool requires API keys for Perplexity AI and Google Gemini, and supports global installation for system-wide access. It offers various commands for different tasks and integrates with Cursor Composer for AI agent usage.
trieve
Trieve is an advanced relevance API for hybrid search, recommendations, and RAG. It offers a range of features including self-hosting, semantic dense vector search, typo tolerant full-text/neural search, sub-sentence highlighting, recommendations, convenient RAG API routes, the ability to bring your own models, hybrid search with cross-encoder re-ranking, recency biasing, tunable popularity-based ranking, filtering, duplicate detection, and grouping. Trieve is designed to be flexible and customizable, allowing users to tailor it to their specific needs. It is also easy to use, with a simple API and well-documented features.
For similar tasks
sfdx-hardis
sfdx-hardis is a toolbox for Salesforce DX, developed by Cloudity, that simplifies tasks which would otherwise take minutes or hours to complete manually. It enables users to define complete CI/CD pipelines for Salesforce projects, backup metadata, and monitor any Salesforce org. The tool offers a wide range of commands that can be accessed via the command line interface or through a Visual Studio Code extension. Additionally, sfdx-hardis provides Docker images for easy integration into CI workflows. The tool is designed to be natively compliant with various platforms and tools, making it a versatile solution for Salesforce developers.
omnia
Omnia is a deployment tool designed to turn servers with RPM-based Linux images into functioning Slurm/Kubernetes clusters. It provides an Ansible playbook-based deployment for Slurm and Kubernetes on servers running an RPM-based Linux OS. The tool simplifies the process of setting up and managing clusters, making it easier for users to deploy and maintain their infrastructure.

ChatOpsLLM
ChatOpsLLM is a project designed to empower chatbots with effortless DevOps capabilities. It provides an intuitive interface and streamlined workflows for managing and scaling language models. The project incorporates robust MLOps practices, including CI/CD pipelines with Jenkins and Ansible, monitoring with Prometheus and Grafana, and centralized logging with the ELK stack. Developers can find detailed documentation and instructions on the project's website.
LangGraph-learn
LangGraph-learn is a community-driven project focused on mastering LangGraph and other AI-related topics. It provides hands-on examples and resources to help users learn how to create and manage language model workflows using LangGraph and related tools. The project aims to foster a collaborative learning environment for individuals interested in AI and machine learning by offering practical examples and tutorials on building efficient and reusable workflows involving language models.
tt-metal
TT-NN is a python & C++ Neural Network OP library. It provides a low-level programming model, TT-Metalium, enabling kernel development for Tenstorrent hardware.
mscclpp
MSCCL++ is a GPU-driven communication stack for scalable AI applications. It provides a highly efficient and customizable communication stack for distributed GPU applications. MSCCL++ redefines inter-GPU communication interfaces, delivering a highly efficient and customizable communication stack for distributed GPU applications. Its design is specifically tailored to accommodate diverse performance optimization scenarios often encountered in state-of-the-art AI applications. MSCCL++ provides communication abstractions at the lowest level close to hardware and at the highest level close to application API. The lowest level of abstraction is ultra light weight which enables a user to implement logics of data movement for a collective operation such as AllReduce inside a GPU kernel extremely efficiently without worrying about memory ordering of different ops. The modularity of MSCCL++ enables a user to construct the building blocks of MSCCL++ in a high level abstraction in Python and feed them to a CUDA kernel in order to facilitate the user's productivity. MSCCL++ provides fine-grained synchronous and asynchronous 0-copy 1-sided abstracts for communication primitives such as `put()`, `get()`, `signal()`, `flush()`, and `wait()`. The 1-sided abstractions allows a user to asynchronously `put()` their data on the remote GPU as soon as it is ready without requiring the remote side to issue any receive instruction. This enables users to easily implement flexible communication logics, such as overlapping communication with computation, or implementing customized collective communication algorithms without worrying about potential deadlocks. Additionally, the 0-copy capability enables MSCCL++ to directly transfer data between user's buffers without using intermediate internal buffers which saves GPU bandwidth and memory capacity. MSCCL++ provides consistent abstractions regardless of the location of the remote GPU (either on the local node or on a remote node) or the underlying link (either NVLink/xGMI or InfiniBand). This simplifies the code for inter-GPU communication, which is often complex due to memory ordering of GPU/CPU read/writes and therefore, is error-prone.
mlir-air
This repository contains tools and libraries for building AIR platforms, runtimes and compilers.

free-for-life
A massive list including a huge amount of products and services that are completely free! ⭐ Star on GitHub • 🤝 Contribute # Table of Contents * APIs, Data & ML * Artificial Intelligence * BaaS * Code Editors * Code Generation * DNS * Databases * Design & UI * Domains * Email * Font * For Students * Forms * Linux Distributions * Messaging & Streaming * PaaS * Payments & Billing * SSL
For similar jobs
flux-aio
Flux All-In-One is a lightweight distribution optimized for running the GitOps Toolkit controllers as a single deployable unit on Kubernetes clusters. It is designed for bare clusters, edge clusters, clusters with restricted communication, clusters with egress via proxies, and serverless clusters. The distribution follows semver versioning and provides documentation for specifications, installation, upgrade, OCI sync configuration, Git sync configuration, and multi-tenancy configuration. Users can deploy Flux using Timoni CLI and a Timoni Bundle file, fine-tune installation options, sync from public Git repositories, bootstrap repositories, and uninstall Flux without affecting reconciled workloads.
paddler
Paddler is an open-source load balancer and reverse proxy designed specifically for optimizing servers running llama.cpp. It overcomes typical load balancing challenges by maintaining a stateful load balancer that is aware of each server's available slots, ensuring efficient request distribution. Paddler also supports dynamic addition or removal of servers, enabling integration with autoscaling tools.
DaoCloud-docs
DaoCloud Enterprise 5.0 Documentation provides detailed information on using DaoCloud, a Certified Kubernetes Service Provider. The documentation covers current and legacy versions, workflow control using GitOps, and instructions for opening a PR and previewing changes locally. It also includes naming conventions, writing tips, references, and acknowledgments to contributors. Users can find guidelines on writing, contributing, and translating pages, along with using tools like MkDocs, Docker, and Poetry for managing the documentation.
ztncui-aio
This repository contains a Docker image with ZeroTier One and ztncui to set up a standalone ZeroTier network controller with a web user interface. It provides features like Golang auto-mkworld for generating a planet file, supports local persistent storage configuration, and includes a public file server. Users can build the Docker image, set up the container with specific environment variables, and manage the ZeroTier network controller through the web interface.
devops-gpt
DevOpsGPT is a revolutionary tool designed to streamline your workflow and empower you to build systems and automate tasks with ease. Tired of spending hours on repetitive DevOps tasks? DevOpsGPT is here to help! Whether you're setting up infrastructure, speeding up deployments, or tackling any other DevOps challenge, our app can make your life easier and more productive. With DevOpsGPT, you can expect faster task completion, simplified workflows, and increased efficiency. Ready to experience the DevOpsGPT difference? Visit our website, sign in or create an account, start exploring the features, and share your feedback to help us improve. DevOpsGPT will become an essential tool in your DevOps toolkit.

ChatOpsLLM
ChatOpsLLM is a project designed to empower chatbots with effortless DevOps capabilities. It provides an intuitive interface and streamlined workflows for managing and scaling language models. The project incorporates robust MLOps practices, including CI/CD pipelines with Jenkins and Ansible, monitoring with Prometheus and Grafana, and centralized logging with the ELK stack. Developers can find detailed documentation and instructions on the project's website.
aiops-modules
AIOps Modules is a collection of reusable Infrastructure as Code (IAC) modules that work with SeedFarmer CLI. The modules are decoupled and can be aggregated using GitOps principles to achieve desired use cases, removing heavy lifting for end users. They must be generic for reuse in Machine Learning and Foundation Model Operations domain, adhering to SeedFarmer Guide structure. The repository includes deployment steps, project manifests, and various modules for SageMaker, Mlflow, FMOps/LLMOps, MWAA, Step Functions, EKS, and example use cases. It also supports Industry Data Framework (IDF) and Autonomous Driving Data Framework (ADDF) Modules.
3FS
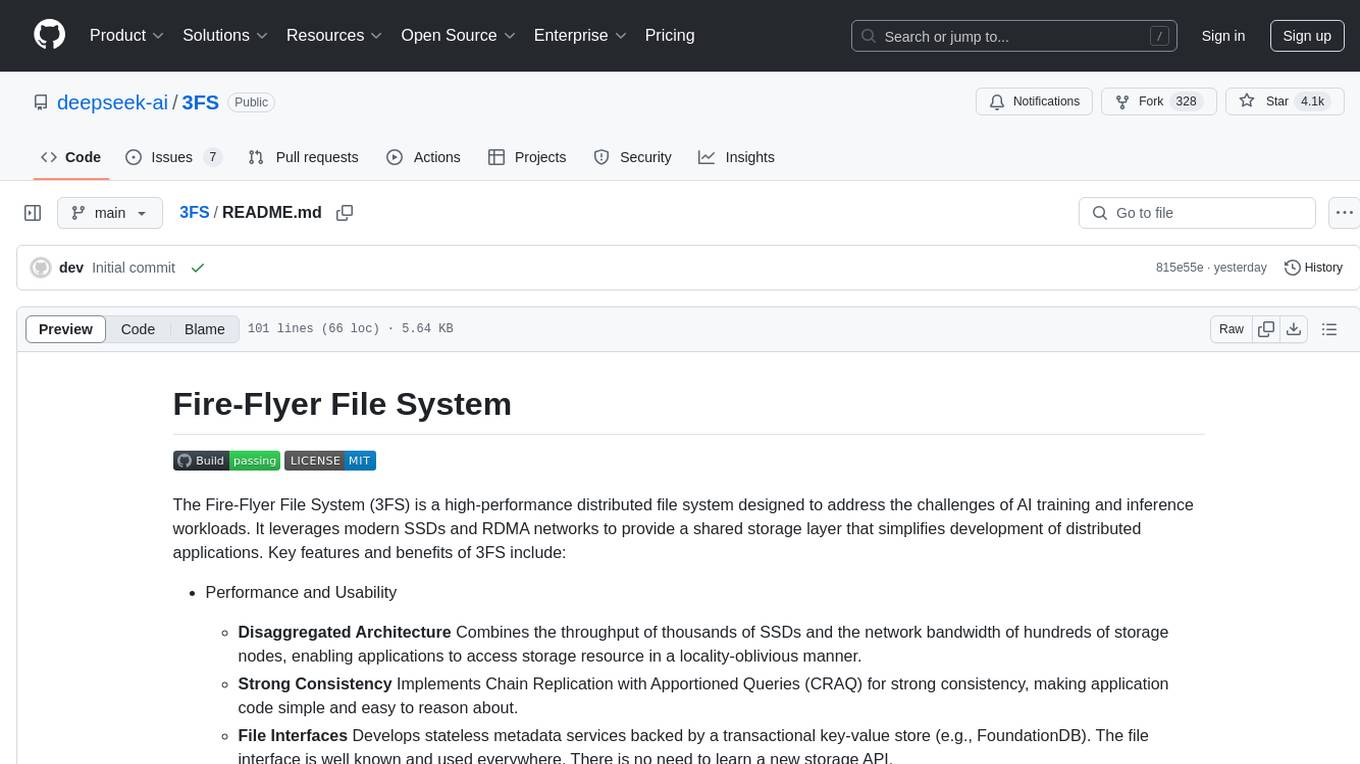
The Fire-Flyer File System (3FS) is a high-performance distributed file system designed for AI training and inference workloads. It leverages modern SSDs and RDMA networks to provide a shared storage layer that simplifies development of distributed applications. Key features include performance, disaggregated architecture, strong consistency, file interfaces, data preparation, dataloaders, checkpointing, and KVCache for inference. The system is well-documented with design notes, setup guide, USRBIO API reference, and P specifications. Performance metrics include peak throughput, GraySort benchmark results, and KVCache optimization. The source code is available on GitHub for cloning and installation of dependencies. Users can build 3FS and run test clusters following the provided instructions. Issues can be reported on the GitHub repository.


