
simple-data-analysis
Easy-to-use and high-performance TypeScript library for data analysis. Works with tabular, geospatial and vector data.
Stars: 329
Simple data analysis (SDA) is an easy-to-use and high-performance TypeScript library for data analysis. It can be used with tabular and geospatial data. The library is maintained by Nael Shiab, a computational journalist and senior data producer for CBC News. SDA is based on DuckDB, a fast in-process analytical database, and it sends SQL queries to be executed by DuckDB. The library provides methods inspired by Pandas (Python) and the Tidyverse (R), and it also supports writing custom SQL queries and processing data with JavaScript. Additionally, SDA offers methods for leveraging large language models (LLMs) for data cleaning, extraction, categorization, and natural language interaction, as well as for embeddings and semantic search.
README:
SDA is an easy-to-use and high-performance TypeScript library for data analysis. You can use it with tabular and geospatial data.
The library is available on JSR with its documentation.
The documentation is also available as the markdown file llm.md, which can be passed as context to improve the use of the library by AI coding assistants or agents.
The library is maintained by Nael Shiab, computational journalist and senior data producer for CBC News.
[!TIP] To learn how to use SDA, check out Code Like a Journalist, a free and open-source data analysis and data visualization course in TypeScript.
You might also find the journalism library interesting.
If you wish to contribute, please check the guidelines.
Create a folder and run setup-sda in it with:
# Deno >= 2.2.x
deno -A jsr:@nshiab/setup-sda

# Node.js >= 22.6.x
npx setup-sda

# Bun
bunx --bun setup-sda
Here are available options:
-
--claudeor--geminior--copilot: Adds aCLAUDE.mdorGEMINI.mdor.github/copilot-instructions.mdfile and extra documentation in./docsto work efficiently with AI agents. -
--example: adds example files -
--scrape: adds web scraping dependencies -
--svelte: adds a Svelte project -
--pages: adds a GitHub Pages Actions workflow (works just with--svelte) -
--git: initializes a git repository and commits the initial files -
--env: adds a.envfile for environment variables and loads them when running
You can combine options, for example, this will install web scraping dependencies, set up a Svelte project with example files, initialize a git repository, make a first commit, and add a GitHub Pages Actions workflow:
deno -A jsr:@nshiab/setup-sda --scrape --svelte --example --pages --gitIf you want to add the library to an existing project, run this:
# Deno >= 2.2.x
deno install --node-modules-dir=auto --allow-scripts=npm:playwright-chromium jsr:@nshiab/simple-data-analysis
# To run with Deno
deno run -A main.ts

# Node.js
npx jsr add @nshiab/simple-data-analysis

# Bun
bunx jsr add @nshiab/simple-data-analysisSDA is born out of the frustration of switching between Python, R, and JavaScript to produce data journalism projects. Usually, data crunching and analysis are done with Python or R, and interactive data visualizations are coded in JavaScript. However, being proficient in multiple programming languages is hard. Why can't we do everything in JS?
The missing piece in the JavaScript/TypeScript ecosystem was an easy-to-use and performant library for data analysis. This is why SDA was created.
The library is based on DuckDB, a fast in-process analytical database. Under the hood, SDA sends SQL queries to be executed by DuckDB. We use duckdb-node-neo. For geospatial computations, we rely on the duckdb_spatial extension.
The syntax and the available methods were inspired by Pandas (Python) and the Tidyverse (R).
You can also write your own SQL queries if you want to (check the customQuery method) or use JavaScript to process your data (check the updateWithJS method).
Several methods can also leverage LLMs (large language models). See aiRowByRow for cleaning, extracting, or categorizing data, and aiQuery for interacting with your data using natural language. For embeddings and semantic search, have a look at aiEmbeddings and aiVectorSimilarity.
Feel free to start a conversation or open an issue. Check how you can contribute.
To test and compare the library's performance, we calculated the average temperature per decade and city with the daily temperatures from the Adjusted and Homogenized Canadian Climate Data. See this repository for the code.
We ran the same calculations with simple-data-analysis (Node.js, Bun, and Deno), Pandas (Python), and the tidyverse (R).
In each script, we:
- Loaded a CSV file (Importing)
- Selected four columns, removed rows with missing temperature, converted date strings to date and temperature strings to float (Cleaning)
- Added a new column decade and calculated the decade (Modifying)
- Calculated the average temperature per decade and city (Summarizing)
- Wrote the cleaned-up data that we computed the averages from in a new CSV file (Writing)
Each script has been run ten times on a MacBook Pro (Apple M4 Max / 64 GB).
With ahccd.csv:
- 1.7 GB
- 773 cities
- 20 columns
- 22,051,025 rows
Thanks to DuckDB, simple-data-analysis is the fastest option.

To test the geospatial computation speed, we performed a spatial join to match each public tree in Montreal to its neighbourhood. We then counted the number of trees in each neighbourhood. For more information, check this repository.
With trees.csv:
- 128 MB
- 316,321 trees
- 33 columns
And neighbourhoods.geojson:
- 991 KB
- 91 neighbourhoods
- 6 columns
Each script has been run ten times on a MacBook Pro (Apple M4 Max / 64 GB).
As we can see, simple-data-analysis is also the fastest option here.

DuckDB, which powers SDA, can also be used with Python and R.
In this example, we load a CSV file with the latitude and longitude of 2023 wildfires in Canada, create point geometries from it, do a spatial join with provinces' boundaries, and then compute the number of fires and the total area burnt per province. We create charts and write the results to a file.
If you are using Deno, make sure to install and enable the Deno extension.
import { SimpleDB } from "@nshiab/simple-data-analysis";
import { barX, plot } from "@observablehq/plot";

// We start a SimpleDB instance.
const sdb = new SimpleDB();

// We create a new table
const fires = sdb.newTable("fires");
// We fetch the wildfires data. It's a csv.
await fires.loadData(
  "https://raw.githubusercontent.com/nshiab/simple-data-analysis/main/test/geodata/files/firesCanada2023.csv",
);
// We create point geometries from the lat and lon columns
// and we store the points in the new column geom
await fires.points("lat", "lon", "geom");
// We log the fires
await fires.logTable();

// We create a new table
const provinces = sdb.newTable("provinces");
// We fetch the provinces' boundaries. It's a geojson.
await provinces.loadGeoData(
  "https://raw.githubusercontent.com/nshiab/simple-data-analysis/main/test/geodata/files/CanadianProvincesAndTerritories.json",
);
// We log the provinces
await provinces.logTable();

// We match fires with provinces
// and we output the results into a new table.
// By default, joinGeo will automatically look
// for columns storing geometries in the tables,
// do a left join, and put the results
// in the left table. For non-spatial data,
// you can use the method join.
const firesInsideProvinces = await fires.joinGeo(provinces, "inside", {
  outputTable: "firesInsideProvinces",
});

// We summarize to count the number of fires
// and sum up the area burnt in each province.
await firesInsideProvinces.summarize({
  values: "hectares",
  categories: "nameEnglish",
  summaries: ["count", "sum"],
  decimals: 0,
});
// We rename columns.
await firesInsideProvinces.renameColumns({
  count: "nbFires",
  sum: "burntArea",
});
// We want the province with
// the greatest burnt area first.
await firesInsideProvinces.sort({ burntArea: "desc" });

// We log the results. By default, the method
// logs the first 10 rows, but there is 13
// rows in our data. We also log the data types.
await firesInsideProvinces.logTable({ nbRowsToLog: 13, types: true });

// We can also log a bar chart directly in the terminal...
await firesInsideProvinces.logBarChart("nameEnglish", "burntArea");

// ... or make a fancier chart or map
// with Observable Plot (don't forget to install it)
// and save it to a file.
const chart = (data: unknown[]) =>
  plot({
    marginLeft: 170,
    grid: true,
    x: { tickFormat: (d) => `${d / 1_000_000}M`, label: "Burnt area (ha)" },
    y: { label: null },
    color: { scheme: "Reds" },
    marks: [
      barX(data, {
        x: "burntArea",
        y: "nameEnglish",
        fill: "burntArea",
        sort: { y: "-x" },
      }),
    ],
  });
await firesInsideProvinces.writeChart(chart, "./chart.png");

// And we can write the data to a parquet, json or csv file.
// For geospatial data, you can use writeGeoData to
// write geojson or geoparquet files.
await firesInsideProvinces.writeData("./firesInsideProvinces.parquet");

// We close everything.
await sdb.done();
Here's what you should see in your console if your run this script.

You'll also find a chart.png file and a firesInsideProvinces.parquet file in
your folder.

You can easily display charts and maps directly in the terminal with the
logBarChart,
logDotChart,
logLineChart
and
logHistogram
methods.
But you can also create Observable Plot
charts as an image file (.png, .jpeg or .svg) with
writeChart.
Here's an example.
import { SimpleDB } from "@nshiab/simple-data-analysis";
import { dodgeX, dot, plot } from "@observablehq/plot";

const sdb = new SimpleDB();
const table = sdb.newTable();

await table.loadData(
  "https://raw.githubusercontent.com/nshiab/simple-data-analysis/main/test/geodata/files/firesCanada2023.csv",
);
// We keep only the fires that are larger than 1 hectare.
await table.filter(`hectares > 1`);
// We rename the causes.
await table.replace("cause", { "H": "Human", "N": "Natural", "U": "Unknown" });
await table.logTable();

// Let's create a beeswarm chart with a log scale.
// We facet over the causes.
const chart = (data: unknown[]) =>
  plot({
    height: 600,
    width: 800,
    color: { legend: true },
    y: { type: "log", label: "Hectares" },
    r: { range: [1, 20] },
    marks: [
      dot(
        data,
        dodgeX("middle", {
          fx: "cause",
          y: "hectares",
          fill: "cause",
          r: "hectares",
        }),
      ),
    ],
  });

const path = "./chart.png";

await table.writeChart(chart, path);

await sdb.done();
If you want to create Observable Plot
maps, you can use
writeMap.
Here's an example.
import { SimpleDB } from "@nshiab/simple-data-analysis";
import { geo, plot } from "@observablehq/plot";

const sdb = new SimpleDB();
const provinces = sdb.newTable("provinces");

// We fetch the Canadian provinces boundaries.
await provinces.loadGeoData(
  "https://raw.githubusercontent.com/nshiab/simple-data-analysis/main/test/geodata/files/CanadianProvincesAndTerritories.json",
);
await provinces.logTable();

// We fetch the fires.
const fires = sdb.newTable("fires");
await fires.loadData(
  "https://raw.githubusercontent.com/nshiab/simple-data-analysis/main/test/geodata/files/firesCanada2023.csv",
);
// We create a new column to store the points as geometries.
await fires.points("lat", "lon", "geom");
// We select the columns of interest and filter out
// fires less than 1 hectare.
await fires.replace("cause", { "H": "Human", "N": "Natural", "U": "Unknown" });
await fires.selectColumns(["geom", "hectares", "cause"]);
await fires.filter(`hectares > 0`);
await fires.logTable();

// Now, we want the provinces and the fires in the same table
// to draw our map with the writeMap method.
// First, we clone the provinces table.
const provincesAndFires = await provinces.cloneTable({
  outputTable: "provincesAndFires",
});
// Now we can insert the fires into the provincesAndFires table.
// By default, SDA will throw an error if the tables don't have the
// same columns. So we set the unifyColumns option to true.
await provincesAndFires.insertTables(fires, { unifyColumns: true });
// To make our lives easier, we add a column to
// distinguish between provinces and fires.
await provincesAndFires.addColumn("isFire", "boolean", `hectares > 0`);
await provincesAndFires.logTable();

// This is our function to draw the map, using the Plot library.
// The geoData will come from the our provincesAndFires table
// as GeoJSON data. Each row of the table is a feature, and each
// feature has properties matching the columns of the table.
const map = (geoData: {
  features: {
    properties: { [key: string]: unknown };
  }[];
}) => {
  const fires = geoData.features.filter((d) => d.properties.isFire);
  const provinces = geoData.features.filter((d) => !d.properties.isFire);

  return plot({
    projection: {
      type: "conic-conformal",
      rotate: [100, -60],
      domain: geoData,
    },
    color: {
      legend: true,
    },
    r: { range: [0.5, 25] },
    marks: [
      geo(provinces, {
        stroke: "lightgray",
        fill: "whitesmoke",
      }),
      geo(fires, {
        r: "hectares",
        fill: "cause",
        fillOpacity: 0.25,
        stroke: "cause",
        strokeOpacity: 0.5,
      }),
    ],
  });
};

// This is the path where the map will be saved.
const path = "./map.png";

// Now we can call writeMap.
await provincesAndFires.writeMap(map, path);

await sdb.done();
Instead of running the same code over and over again, you can cache the results. This can speed up your workflow, especially when fetching data or performing computationally expensive operations.
Here's the previous example adapted to cache data. For more information, check the cache method documentation.
The data is cached in the hidden folder .sda-cache at the root of your code
repository. Make sure to add it to your .gitignore. If you want to clean your
cache, just delete the folder.
If you set up with setup-sda (see Quick setup at the top), .sda-cache is
automatically added to your .gitignore and you can use npm run clean or
bun run clean or deno task clean to clear the cache.
import { SimpleDB } from "@nshiab/simple-data-analysis";

// We enable two options to make our lives easier.
// cacheVerbose will log information about the cached
// data, and logDuration will log the total duration between
// the creation of this SimpleDB instance and its last operation.
const sdb = new SimpleDB({ cacheVerbose: true, logDuration: true });

const fires = sdb.newTable("fires");

// We cache these steps with a ttl of 60 seconds.
// On the first run, the data will be fetched
// and stored in the hidden folder .sda-cache.
// If you rerun the script less than 60 seconds
// later, the data won't be fetched but loaded
// from the local cache. However, if you run the
// code after 60 seconds, the data will be
// considered outdated and fetched again.
// After another 60 seconds, the new data in the cache will
// expire again. This is useful when working with scraped data.
// If you update the code passed to the cache method,
// everything starts over.
await fires.cache(
  async () => {
    await fires.loadData(
      "https://raw.githubusercontent.com/nshiab/simple-data-analysis/main/test/geodata/files/firesCanada2023.csv",
    );
    await fires.points("lat", "lon", "geom");
  },
  { ttl: 60 },
);

const provinces = sdb.newTable("provinces");

// Same thing here, except there is no ttl option,
// so the cached data will never expire unless you delete
// the hidden folder .sda-cache. Again, if you update
// the code passed to the cache method, everything
// starts over.
await provinces.cache(async () => {
  await provinces.loadGeoData(
    "https://raw.githubusercontent.com/nshiab/simple-data-analysis/main/test/geodata/files/CanadianProvincesAndTerritories.json",
  );
});

const firesInsideProvinces = sdb.newTable("firesInsideProvinces");

// While caching is quite useful when fetching data,
// it's also handy for computationally expensive
// operations like joins and summaries.
// Since the fires table has a ttl of 60 seconds
// and we depend on it here, we need a ttl equal
// or lower. Otherwise, we won't work with
// up-to-date data.
await firesInsideProvinces.cache(
  async () => {
    await fires.joinGeo(provinces, "inside", {
      outputTable: "firesInsideProvinces",
    });
    await firesInsideProvinces.removeMissing();
    await firesInsideProvinces.summarize({
      values: "hectares",
      categories: "nameEnglish",
      summaries: ["count", "sum"],
      decimals: 0,
    });
    await firesInsideProvinces.renameColumns({
      count: "nbFires",
      sum: "burntArea",
    });
    await firesInsideProvinces.sort({ burntArea: "desc" });
  },
  { ttl: 60 },
);

await firesInsideProvinces.logTable({ nbRowsToLog: 13, types: true });
await firesInsideProvinces.logBarChart("nameEnglish", "burntArea");

// It's important to call done() at the end.
// This method will remove the unused files
// in the cache. It will also log the total duration
// if the logDuration option was set to true.
await sdb.done();
After the first run, here's what you'll see in your terminal. For each
cache(), a file storing the results has been written in .sda-cache.
The whole script took around a second to complete.
Nothing in cache. Running and storing in cache.
Duration: 311 ms. Wrote ./.sda-cache/fires.ff...68f.geojson.

Nothing in cache. Running and storing in cache.
Duration: 397 ms. Wrote ./.sda-cache/provinces.42...55.geojson.

Nothing in cache. Running and storing in cache.
Duration: 49 ms. Wrote ./.sda-cache/firesInsideProvinces.71...a8.parquet.

table firesInsideProvinces:
┌─────────┬────────────┬─────────────────────────────┬─────────┬───────────┐
│ (index) │ value      │ nameEnglish                 │ nbFires │ burntArea │
├─────────┼────────────┼─────────────────────────────┼─────────┼───────────┤
│ 0       │ 'hectares' │ 'Quebec'                    │ 706     │ 5024737   │
│ 1       │ 'hectares' │ 'Northwest Territories'     │ 314     │ 4253907   │
│ 2       │ 'hectares' │ 'Alberta'                   │ 1208    │ 3214444   │
│ 3       │ 'hectares' │ 'British Columbia'          │ 2496    │ 2856625   │
│ 4       │ 'hectares' │ 'Saskatchewan'              │ 560     │ 1801903   │
│ 5       │ 'hectares' │ 'Ontario'                   │ 741     │ 441581    │
│ 6       │ 'hectares' │ 'Yukon'                     │ 227     │ 395461    │
│ 7       │ 'hectares' │ 'Manitoba'                  │ 301     │ 199200    │
│ 8       │ 'hectares' │ 'Nova Scotia'               │ 208     │ 25017     │
│ 9       │ 'hectares' │ 'Newfoundland and Labrador' │ 85      │ 21833     │
│ 10      │ 'hectares' │ 'Nunavut'                   │ 1       │ 2700      │
│ 11      │ 'hectares' │ 'New Brunswick'             │ 202     │ 854       │
│ 12      │ 'hectares' │ null                        │ 124     │ 258       │
└─────────┴────────────┴─────────────────────────────┴─────────┴───────────┘
13 rows in total (nbRowsToLog: 13)

SimpleDB - Done in 891 ms
If you run the script less than 60 seconds after the first run, here's what you'll see.
Thanks to caching, the script ran five times faster!
Found ./.sda-cache/fires.ff...8f.geojson in cache.
ttl of 60 sec has not expired. The creation date is July 5, 2024, at 4:25 p.m.. There are 11 sec, 491 ms left.
Data loaded in 151 ms. Running the computations took 311 ms last time. You saved 160 ms.

Found ./.sda-cache/provinces.42...55.geojson in cache.
Data loaded in 8 ms. Running the computations took 397 ms last time. You saved 389 ms.

Found ./.sda-cache/firesInsideProvinces.71...a8.parquet in cache.
ttl of 60 sec has not expired. The creation date is July 5, 2024, at 4:25 p.m.. There are 11 sec, 792 ms left.
Data loaded in 1 ms. Running the computations took 49 ms last time. You saved 48 ms.

table firesInsideProvinces:
┌─────────┬────────────┬─────────────────────────────┬─────────┬───────────┐
│ (index) │ value      │ nameEnglish                 │ nbFires │ burntArea │
├─────────┼────────────┼─────────────────────────────┼─────────┼───────────┤
│ 0       │ 'hectares' │ 'Quebec'                    │ 706     │ 5024737   │
│ 1       │ 'hectares' │ 'Northwest Territories'     │ 314     │ 4253907   │
│ 2       │ 'hectares' │ 'Alberta'                   │ 1208    │ 3214444   │
│ 3       │ 'hectares' │ 'British Columbia'          │ 2496    │ 2856625   │
│ 4       │ 'hectares' │ 'Saskatchewan'              │ 560     │ 1801903   │
│ 5       │ 'hectares' │ 'Ontario'                   │ 741     │ 441581    │
│ 6       │ 'hectares' │ 'Yukon'                     │ 227     │ 395461    │
│ 7       │ 'hectares' │ 'Manitoba'                  │ 301     │ 199200    │
│ 8       │ 'hectares' │ 'Nova Scotia'               │ 208     │ 25017     │
│ 9       │ 'hectares' │ 'Newfoundland and Labrador' │ 85      │ 21833     │
│ 10      │ 'hectares' │ 'Nunavut'                   │ 1       │ 2700      │
│ 11      │ 'hectares' │ 'New Brunswick'             │ 202     │ 854       │
│ 12      │ 'hectares' │ null                        │ 124     │ 258       │
└─────────┴────────────┴─────────────────────────────┴─────────┴───────────┘
13 rows in total (nbRowsToLog: 13)

SimpleDB - Done in 184 ms / You saved 707 ms by using the cache
And if you run the script 60 seconds later, the fires and join/summary caches will have expired, but not the provinces one. Some of the code will have run, but not everything. The script still ran 1.5 times faster. This is quite handy in complex analysis with big datasets. The less you wait, the more fun you have!
Found ./.sda-cache/fires.ff...8f.geojson in cache
ttl of 60 sec has expired. The creation date is July 5, 2024, at 4:25 p.m.. It's is 4 min, 1 sec, 172 ms ago.
Running and storing in cache.
Duration: 424 ms. Wrote ./.sda-cache/fires.ff...8f.geojson.

Found ./.sda-cache/provinces.42...55.geojson in cache.
Data loaded in 10 ms. Running the computations took 397 ms last time. You saved 387 ms.

Fond ./.sda-cache/firesInsideProvinces.71...a8.parquet in cache
ttl of 60 sec has expired. The creation date is July 5, 2024, at 4:25 p.m.. It's is 4 min, 1 sec, 239 ms ago.
Running and storing in cache.
Duration: 42 ms. Wrote ./.sda-cache/firesInsideProvinces.71...a8.parquet.

table firesInsideProvinces:
┌─────────┬────────────┬─────────────────────────────┬─────────┬───────────┐
│ (index) │ value      │ nameEnglish                 │ nbFires │ burntArea │
├─────────┼────────────┼─────────────────────────────┼─────────┼───────────┤
│ 0       │ 'hectares' │ 'Quebec'                    │ 706     │ 5024737   │
│ 1       │ 'hectares' │ 'Northwest Territories'     │ 314     │ 4253907   │
│ 2       │ 'hectares' │ 'Alberta'                   │ 1208    │ 3214444   │
│ 3       │ 'hectares' │ 'British Columbia'          │ 2496    │ 2856625   │
│ 4       │ 'hectares' │ 'Saskatchewan'              │ 560     │ 1801903   │
│ 5       │ 'hectares' │ 'Ontario'                   │ 741     │ 441581    │
│ 6       │ 'hectares' │ 'Yukon'                     │ 227     │ 395461    │
│ 7       │ 'hectares' │ 'Manitoba'                  │ 301     │ 199200    │
│ 8       │ 'hectares' │ 'Nova Scotia'               │ 208     │ 25017     │
│ 9       │ 'hectares' │ 'Newfoundland and Labrador' │ 85      │ 21833     │
│ 10      │ 'hectares' │ 'Nunavut'                   │ 1       │ 2700      │
│ 11      │ 'hectares' │ 'New Brunswick'             │ 202     │ 854       │
│ 12      │ 'hectares' │ null                        │ 124     │ 258       │
└─────────┴────────────┴─────────────────────────────┴─────────┴───────────┘
13 rows in total (nbRowsToLog: 13)

SimpleDB - Done in 594 ms / You saved 297 ms by using the cache
For Tasks:
Click tags to check more tools for each tasksFor Jobs:
Alternative AI tools for simple-data-analysis
Similar Open Source Tools
simple-data-analysis
Simple data analysis (SDA) is an easy-to-use and high-performance TypeScript library for data analysis. It can be used with tabular and geospatial data. The library is maintained by Nael Shiab, a computational journalist and senior data producer for CBC News. SDA is based on DuckDB, a fast in-process analytical database, and it sends SQL queries to be executed by DuckDB. The library provides methods inspired by Pandas (Python) and the Tidyverse (R), and it also supports writing custom SQL queries and processing data with JavaScript. Additionally, SDA offers methods for leveraging large language models (LLMs) for data cleaning, extraction, categorization, and natural language interaction, as well as for embeddings and semantic search.
lihil
Lihil is a performant, productive, and professional web framework designed to make Python the mainstream programming language for web development. It is 100% test covered and strictly typed, offering fast performance, ergonomic API, and built-in solutions for common problems. Lihil is suitable for enterprise web development, delivering robust and scalable solutions with best practices in microservice architecture and related patterns. It features dependency injection, OpenAPI docs generation, error response generation, data validation, message system, testability, and strong support for AI features. Lihil is ASGI compatible and uses starlette as its ASGI toolkit, ensuring compatibility with starlette classes and middlewares. The framework follows semantic versioning and has a roadmap for future enhancements and features.
shell_gpt
ShellGPT is a command-line productivity tool powered by AI large language models (LLMs). This command-line tool offers streamlined generation of shell commands, code snippets, documentation, eliminating the need for external resources (like Google search). Supports Linux, macOS, Windows and compatible with all major Shells like PowerShell, CMD, Bash, Zsh, etc.
agentboard
Agentboard is a Web GUI for tmux optimized for agent TUI's like claude and codex. It provides a shared workspace across devices with features such as paste support, touch scrolling, virtual arrow keys, log tracking, and session pinning. Users can interact with tmux sessions from any device through a live terminal stream. The tool allows session discovery, status inference, and terminal I/O streaming for efficient agent management.
httpjail
httpjail is a cross-platform tool designed for monitoring and restricting HTTP/HTTPS requests from processes using network isolation and transparent proxy interception. It provides process-level network isolation, HTTP/HTTPS interception with TLS certificate injection, script-based and JavaScript evaluation for custom request logic, request logging, default deny behavior, and zero-configuration setup. The tool operates on Linux and macOS, creating an isolated network environment for target processes and intercepting all HTTP/HTTPS traffic through a transparent proxy enforcing user-defined rules.
blendsql
BlendSQL is a superset of SQLite designed for problem decomposition and hybrid question-answering with Large Language Models (LLMs). It allows users to blend operations over heterogeneous data sources like tables, text, and images, combining the structured and interpretable reasoning of SQL with the generalizable reasoning of LLMs. Users can oversee all calls (LLM + SQL) within a unified query language, enabling tasks such as building LLM chatbots for travel planning and answering complex questions by injecting 'ingredients' as callable functions.
mimiclaw
MimiClaw is a pocket AI assistant that runs on a $5 chip, specifically designed for the ESP32-S3 board. It operates without Linux or Node.js, using pure C language. Users can interact with MimiClaw through Telegram, enabling it to handle various tasks and learn from local memory. The tool is energy-efficient, running on USB power 24/7. With MimiClaw, users can have a personal AI assistant on a chip the size of a thumb, making it convenient and accessible for everyday use.
VT.ai
VT.ai is a multimodal AI platform that offers dynamic conversation routing with SemanticRouter, multi-modal interactions (text/image/audio), an assistant framework with code interpretation, real-time response streaming, cross-provider model switching, and local model support with Ollama integration. It supports various AI providers such as OpenAI, Anthropic, Google Gemini, Groq, Cohere, and OpenRouter, providing a wide range of core capabilities for AI orchestration.
sandbox
AIO Sandbox is an all-in-one agent sandbox environment that combines Browser, Shell, File, MCP operations, and VSCode Server in a single Docker container. It provides a unified, secure execution environment for AI agents and developers, with features like unified file system, multiple interfaces, secure execution, zero configuration, and agent-ready MCP-compatible APIs. The tool allows users to run shell commands, perform file operations, automate browser tasks, and integrate with various development tools and services.
spatz-2
Spatz-2 is a complete, fullstack template for Svelte, utilizing technologies such as Sveltekit, Pocketbase, OpenAI, Vercel AI SDK, TailwindCSS, svelte-animations, and Zod. It offers features like user authentication, admin dashboard, dark/light mode themes, AI chatbot, guestbook, and forms with client/server validation. The project structure includes components, stores, routes, APIs, and icons. Spatz-2 aims to provide a futuristic web framework for building fast web apps with advanced functionalities and easy customization.
mcp-debugger
mcp-debugger is a Model Context Protocol (MCP) server that provides debugging tools as structured API calls. It enables AI agents to perform step-through debugging of multiple programming languages using the Debug Adapter Protocol (DAP). The tool supports multi-language debugging with clean adapter patterns, including Python debugging via debugpy, JavaScript (Node.js) debugging via js-debug, and Rust debugging via CodeLLDB. It offers features like mock adapter for testing, STDIO and SSE transport modes, zero-runtime dependencies, Docker and npm packages for deployment, structured JSON responses for easy parsing, path validation to prevent crashes, and AI-aware line context for intelligent breakpoint placement with code context.
IG-LLM
IG-LLM is a framework for solving inverse-graphics problems by instruction-tuning a Large Language Model (LLM) to decode visual embeddings into graphics code. The framework demonstrates natural generalization across distribution shifts without special inductive biases. It provides training and evaluation data for various scenarios like CLEVR, 2D, SO(3), 6-DoF, and ShapeNet. The environment setup can be done using conda/micromamba or Dockerfile. Training can be initiated for each scenario with specific commands, and inference can be performed using the provided script.

gpt-all-star
GPT-All-Star is an AI-powered code generation tool designed for scratch development of web applications with team collaboration of autonomous AI agents. The primary focus of this research project is to explore the potential of autonomous AI agents in software development. Users can organize their team, choose leaders for each step, create action plans, and work together to complete tasks. The tool supports various endpoints like OpenAI, Azure, and Anthropic, and provides functionalities for project management, code generation, and team collaboration.
mcp-prompts
mcp-prompts is a Python library that provides a collection of prompts for generating creative writing ideas. It includes a variety of prompts such as story starters, character development, plot twists, and more. The library is designed to inspire writers and help them overcome writer's block by offering unique and engaging prompts to spark creativity. With mcp-prompts, users can access a wide range of writing prompts to kickstart their imagination and enhance their storytelling skills.
one
ONE is a modern web and AI agent development toolkit that empowers developers to build AI-powered applications with high performance, beautiful UI, AI integration, responsive design, type safety, and great developer experience. It is perfect for building modern web applications, from simple landing pages to complex AI-powered platforms.
otter-camp
Otter Camp is an open source work management tool designed for AI agent teams. It provides a centralized platform for managing AI agents, ensuring that important context is not lost, enabling quick hiring and firing of agents, maintaining a single pipeline for all work types, keeping context organized within projects, facilitating work review processes, tracking team activities, and offering self-hosted data security. The tool integrates with OpenClaw to run agents and provides a user-friendly interface for managing agent teams efficiently.
For similar tasks
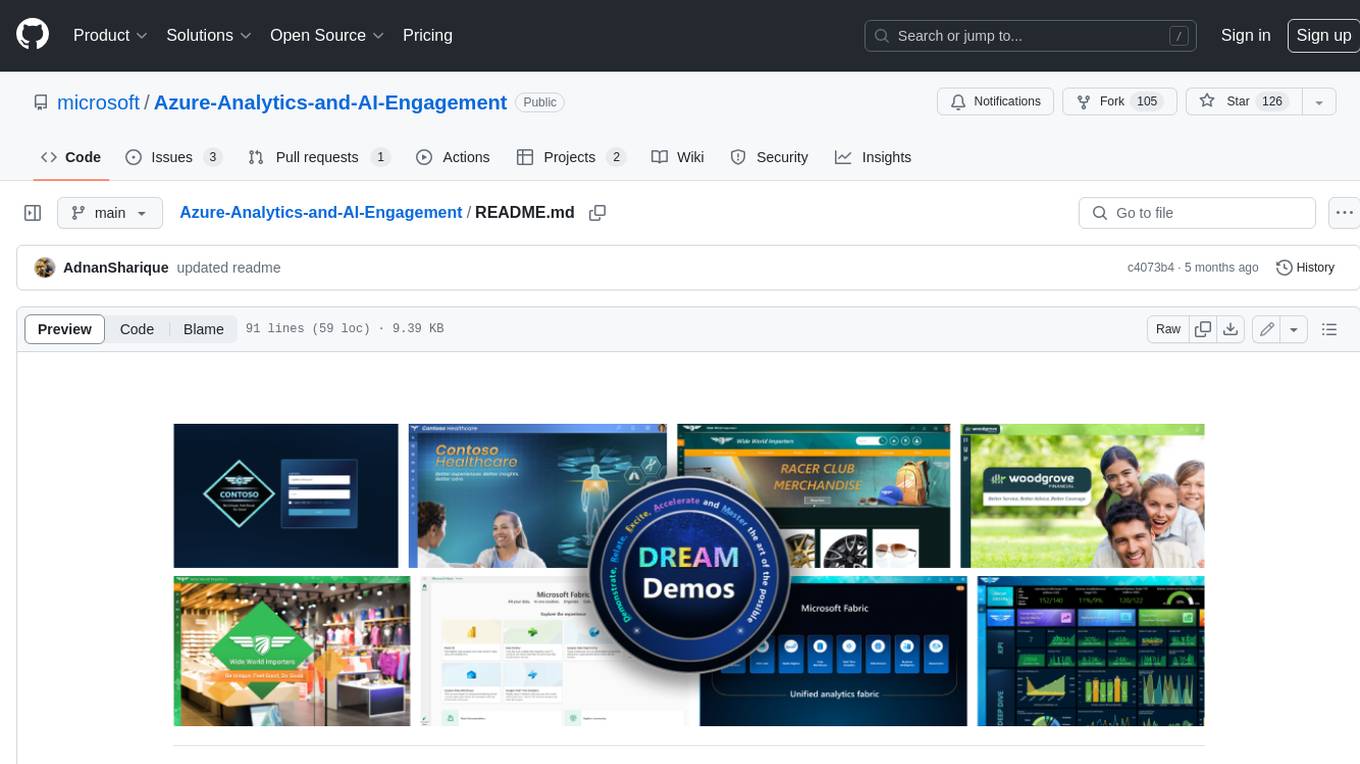
Azure-Analytics-and-AI-Engagement
The Azure-Analytics-and-AI-Engagement repository provides packaged Industry Scenario DREAM Demos with ARM templates (Containing a demo web application, Power BI reports, Synapse resources, AML Notebooks etc.) that can be deployed in a customer’s subscription using the CAPE tool within a matter of few hours. Partners can also deploy DREAM Demos in their own subscriptions using DPoC.
sorrentum
Sorrentum is an open-source project that aims to combine open-source development, startups, and brilliant students to build machine learning, AI, and Web3 / DeFi protocols geared towards finance and economics. The project provides opportunities for internships, research assistantships, and development grants, as well as the chance to work on cutting-edge problems, learn about startups, write academic papers, and get internships and full-time positions at companies working on Sorrentum applications.
tidb
TiDB is an open-source distributed SQL database that supports Hybrid Transactional and Analytical Processing (HTAP) workloads. It is MySQL compatible and features horizontal scalability, strong consistency, and high availability.

zep-python
Zep is an open-source platform for building and deploying large language model (LLM) applications. It provides a suite of tools and services that make it easy to integrate LLMs into your applications, including chat history memory, embedding, vector search, and data enrichment. Zep is designed to be scalable, reliable, and easy to use, making it a great choice for developers who want to build LLM-powered applications quickly and easily.
telemetry-airflow
This repository codifies the Airflow cluster that is deployed at workflow.telemetry.mozilla.org (behind SSO) and commonly referred to as "WTMO" or simply "Airflow". Some links relevant to users and developers of WTMO: * The `dags` directory in this repository contains some custom DAG definitions * Many of the DAGs registered with WTMO don't live in this repository, but are instead generated from ETL task definitions in bigquery-etl * The Data SRE team maintains a WTMO Developer Guide (behind SSO)
mojo
Mojo is a new programming language that bridges the gap between research and production by combining Python syntax and ecosystem with systems programming and metaprogramming features. Mojo is still young, but it is designed to become a superset of Python over time.
pandas-ai
PandasAI is a Python library that makes it easy to ask questions to your data in natural language. It helps you to explore, clean, and analyze your data using generative AI.
databend
Databend is an open-source cloud data warehouse that serves as a cost-effective alternative to Snowflake. With its focus on fast query execution and data ingestion, it's designed for complex analysis of the world's largest datasets.
For similar jobs
lollms-webui
LoLLMs WebUI (Lord of Large Language Multimodal Systems: One tool to rule them all) is a user-friendly interface to access and utilize various LLM (Large Language Models) and other AI models for a wide range of tasks. With over 500 AI expert conditionings across diverse domains and more than 2500 fine tuned models over multiple domains, LoLLMs WebUI provides an immediate resource for any problem, from car repair to coding assistance, legal matters, medical diagnosis, entertainment, and more. The easy-to-use UI with light and dark mode options, integration with GitHub repository, support for different personalities, and features like thumb up/down rating, copy, edit, and remove messages, local database storage, search, export, and delete multiple discussions, make LoLLMs WebUI a powerful and versatile tool.
Azure-Analytics-and-AI-Engagement
The Azure-Analytics-and-AI-Engagement repository provides packaged Industry Scenario DREAM Demos with ARM templates (Containing a demo web application, Power BI reports, Synapse resources, AML Notebooks etc.) that can be deployed in a customer’s subscription using the CAPE tool within a matter of few hours. Partners can also deploy DREAM Demos in their own subscriptions using DPoC.
minio
MinIO is a High Performance Object Storage released under GNU Affero General Public License v3.0. It is API compatible with Amazon S3 cloud storage service. Use MinIO to build high performance infrastructure for machine learning, analytics and application data workloads.
mage-ai
Mage is an open-source data pipeline tool for transforming and integrating data. It offers an easy developer experience, engineering best practices built-in, and data as a first-class citizen. Mage makes it easy to build, preview, and launch data pipelines, and provides observability and scaling capabilities. It supports data integrations, streaming pipelines, and dbt integration.
AiTreasureBox
AiTreasureBox is a versatile AI tool that provides a collection of pre-trained models and algorithms for various machine learning tasks. It simplifies the process of implementing AI solutions by offering ready-to-use components that can be easily integrated into projects. With AiTreasureBox, users can quickly prototype and deploy AI applications without the need for extensive knowledge in machine learning or deep learning. The tool covers a wide range of tasks such as image classification, text generation, sentiment analysis, object detection, and more. It is designed to be user-friendly and accessible to both beginners and experienced developers, making AI development more efficient and accessible to a wider audience.
tidb
TiDB is an open-source distributed SQL database that supports Hybrid Transactional and Analytical Processing (HTAP) workloads. It is MySQL compatible and features horizontal scalability, strong consistency, and high availability.
airbyte
Airbyte is an open-source data integration platform that makes it easy to move data from any source to any destination. With Airbyte, you can build and manage data pipelines without writing any code. Airbyte provides a library of pre-built connectors that make it easy to connect to popular data sources and destinations. You can also create your own connectors using Airbyte's no-code Connector Builder or low-code CDK. Airbyte is used by data engineers and analysts at companies of all sizes to build and manage their data pipelines.
labelbox-python
Labelbox is a data-centric AI platform for enterprises to develop, optimize, and use AI to solve problems and power new products and services. Enterprises use Labelbox to curate data, generate high-quality human feedback data for computer vision and LLMs, evaluate model performance, and automate tasks by combining AI and human-centric workflows. The academic & research community uses Labelbox for cutting-edge AI research.