
Zentara-Code
AI debugger and AI coder integrated. Use AI to code and drives runtime debugger
Stars: 65
Zentara Code is an AI coding assistant for VS Code that turns chat instructions into precise, auditable changes in the codebase. It is optimized for speed, safety, and correctness through parallel execution, LSP semantics, and integrated runtime debugging. It offers features like parallel subagents, integrated LSP tools, and runtime debugging for efficient code modification and analysis.
README:
Zentara Code turns chat instructions into precise, auditable changes in your codebase. It is optimized for speed, safety, and correctness through parallel execution, LSP semantics, and integrated runtime debugging.
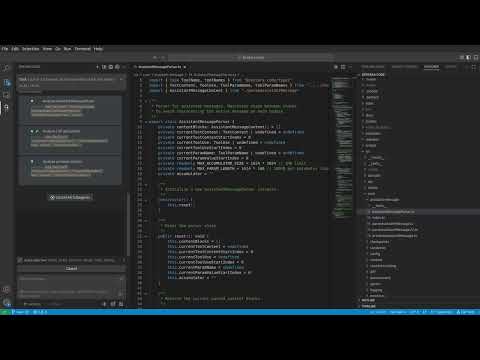
Watch Zentara Code in action:
- Parallel subagents: Independent workers run simultaneously with strict scope separation, opt‑in write permissions, and per‑agent timeouts for high throughput without conflicts.
- Integrated LSP tools: Operations use the Language Server Protocol for file structure, semantic references, call hierarchy, safe renames, workspace‑wide symbol discovery, and targeted snippets.
- Runtime debugging: Launch, control, and inspect debug sessions from tasks to reproduce, instrument, step, and validate before concluding changes.
Zentara Code is a VS Code extension. Here's how you can get started:
Quick Start Tip: Once installed, try the
/initcommand in any project to automatically analyze your codebase and generate AI-friendly documentation. This helps Zentara understand your project's patterns and conventions for better assistance. See the /init Command Guide for details.
1. Install from VS Code Marketplace (Recommended for Users)
- Install latest VS Code. The extension is build for VS Code 1.96.4 and later
- Open VS Code.
- Install the necessary language extension and language debugger extension. For example for Python, just install Microsoft Python extension, it will automatically install debugpy debugger. Check the debugger manually on any of your script to make sure it works.
-
Configure
launch.json(Optional but Recommended): For a more streamlined experience, you can define debug configurations in your.vscode/launch.jsonfile. This allows you to launch complex debugging scenarios with a simple name (e.g., "Run Extension", "Debug Current Test File"). You can then instruct Zentara to use these configurations directly, e.g., "Zentara, launch the debugger with the 'Run Extension' config". For TypeScript files, install npm and tsx (by runningnpm install -g tsx). - For Zentara Code to effectively debug Python projects, especially those using Conda environments or specific
pytestinstallations, ensure the correct Python interpreter is configured in your VS Code settings (.vscode/settings.json):
{
	"python.defaultInterpreterPath": "/path/to/your/conda/env/bin/python"
}
Replace /path/to/your/conda/env/bin/python with the actual path to your Python interpreter.
- For python pytest tests: install pytest. If you would like to install pytest in a conda enviroment,remember to point the python interperter in settings.json(see the above point)
- Go to the Extensions view (Ctrl+Shift+X or Cmd+Shift+X).
- Search for "Zentara Code".
- Click "Install".
- Once installed, Zentara Code will be available to assist you.
For more detailed installation instruction, please visit https://zentar.ai, click on the "Install for free" button.
2. Build and Install from Source (For Developers/Contributors)
If you want to contribute or run the latest development version:
-
Clone the repository:
git clone https://github.com/Zentar-Ai/Zentara-Code.git cd zentara-code -
Install dependencies: This project uses pnpm. Ensure you have Node.js npm , pnpm installed.
pnpm install
-
Build the extension:
pnpm vsix
This will typically compile the TypeScript code and package the extension into a
.vsixfile in abin/directory. -
Install the .vsix file in VS Code:
- Go to the Extensions view in VS Code.
- Click the "..." (More Actions) menu in the top-right corner of the Extensions view.
- Select "Install from VSIX..."
- Navigate to and select the generated
.vsixfile.
We recommend subscribe for Claude Max plan to use Zentara Code. If you have Claude Max subscription already, in the Setting > API Provider, choose Claude Max (not Claude Code option) to get the best and fastest performance
- Plan: Zentara decomposes your request into small, independent steps and proposes safe execution order.
- Approvals: Potentially impactful actions (file writes, network, long operations) require explicit approval.
- Execute: Steps are distributed to parallel subagents when independent to reduce wall‑clock time.
- Analyze: Code understanding is LSP‑first (document symbols → usages → call hierarchy → targeted snippets).
- Verify: Integrated debugging provides breakpoints, stepping, state inspection, and evaluation to confirm behavior.
- File and module structure analysis via LSP document symbols
- True semantic usages across the workspace (not text matches)
- Caller/callee relationships via call hierarchy
- Targeted code snippets for precise context
- 25+ LSP tools for semantic code intelligence
- Independent subagents with isolated contexts
- Scope separation to prevent conflicts
- Predefined agents for common workflows (code review, bug investigation)
- General subagents for custom tasks
- Available across all modes for maximum flexibility
- Feature implementation, bug fixes, refactors
- Safe, reviewable diffs with minimal surface area
- Style‑ and framework‑aware changes
- Safe refactoring with semantic rename and impact analysis
- Complete debug session management (launch, restart, quit)
- Execution control (continue, step, jump, until)
- Comprehensive breakpoint management
- State inspection (stack traces, variables, evaluation)
- 35+ debugging operations for thorough validation
- Generate READMEs, API docs, and test scaffolds
- Propose focused unit/integration tests
- Script generation, config updates, and task runners
For comprehensive information on Zentara's advanced features:
-
/initCommand Guide - Complete overview of the/initslash command for intelligent project analysis and AI documentation generation - LSP Tools Guide - Complete reference for all 25+ Language Server Protocol tools, including discovery, navigation, analysis, and modification operations
- Subagent System Guide - In-depth guide to parallel task execution, scope separation, and performance optimization
- Predefined Agents Guide - How to create, use, and manage template-based subagents for standardized workflows
- Slash Commands Guide - Complete guide to creating and customizing slash commands, including AI-driven execution, configuration system, and best practices
- Debugging Guide - Comprehensive debugging operations, session management, and runtime validation techniques
- Tool Integration Guide - Developer guide for extending Zentara with custom tools and integrations
- Isolation: Each worker runs with its own context and is assigned non‑overlapping scope (files, features, layers).
- Permissions: Writes are opt‑in and constrained to allowed paths; read‑only by default.
- Timeouts: Per‑agent execution is time‑bounded to prevent runaway tasks.
- Determinism: Plans enumerate inputs/outputs; results are merged with conflict avoidance.
- Observability: You can inspect each subtask's plan and results before moving on.
→ See Subagent System Guide for advanced patterns and best practices
- Structure: Get symbol trees without reading entire files.
- Usages: Find real references, not text matches.
- Call graph: See who calls what to understand flows and side effects.
- Safety: Use semantic information to avoid dangerous edits and hidden couplings.
- Scope: Ask for just the code that matters via targeted snippets to reduce noise.
→ See LSP Tools Guide for complete tool reference and workflows
- Control: Launch sessions, continue, step, and stop from within Zentara tasks.
- Breakpoints: Add, remove, enable/disable, conditional, and temporary breakpoints.
- Inspection: View stack traces, active frame variables, arguments, and source context.
- Evaluation: Evaluate expressions and run statements in the current context where supported.
- Integration: Use debugging during or after code edits to verify correctness before finalizing.
→ See Debugging Guide for detailed operations and troubleshooting
- Be goal‑oriented: describe the outcome, constraints, and acceptance criteria.
- Provide guardrails: performance budgets, API boundaries, style preferences.
- Embrace iteration: accept partial progress and refine.
- Let Zentara plan: approve or edit its proposed steps rather than dictating line‑level changes.
To observe all conversations between the LLM and Zentara, including detailed execution logs and debugging information:
-
Open the Output Panel:
-
Method 1: Use the keyboard shortcut
Ctrl+Shift+U(Windows/Linux) orCmd+Shift+U(Mac) - Method 2: Go to the top menu bar → View → Output
-
Method 3: Open the Command Palette (
Ctrl+Shift+PorCmd+Shift+P) and type "View: Toggle Output"
-
Method 1: Use the keyboard shortcut
-
Select Zentara Debug Channel:
- In the Output panel (usually appears at the bottom of VS Code), look for a dropdown menu on the right side
- Click the dropdown and select "Zentara Debug" from the list of available output channels
- If you don't see "Zentara Debug", make sure Zentara Code extension is active and try interacting with it first
-
What You'll See:
- Real-time conversation logs between you and the AI
- Tool execution details and results
- Error messages and debugging information
- Subagent communications and parallel task execution logs
- LSP operation details and responses
Tip: Keep the Output panel open while working with Zentara to monitor its operations and troubleshoot any issues in real-time.
We're constantly evolving Zentara Code. Check out our issue tracker for our public roadmap and planned features. If you're looking to contribute, good first issue labels are a great place to start!
Zentara Code thrives on community involvement! We welcome contributions of all kinds.
Follow us on Twitter: @ZentaraCode
Zentara Code is licensed under the Apache License 2.0.
© 2025 ZentarAI
Zentara Code is a mod from the great Roo-Code. We greatly thank the contributors of the RooCode community and the original Cline community that RooCode developed from.
For Tasks:
Click tags to check more tools for each tasksFor Jobs:
Alternative AI tools for Zentara-Code
Similar Open Source Tools
Zentara-Code
Zentara Code is an AI coding assistant for VS Code that turns chat instructions into precise, auditable changes in the codebase. It is optimized for speed, safety, and correctness through parallel execution, LSP semantics, and integrated runtime debugging. It offers features like parallel subagents, integrated LSP tools, and runtime debugging for efficient code modification and analysis.
FunGen-AI-Powered-Funscript-Generator
FunGen is a Python-based tool that uses AI to generate Funscript files from VR and 2D POV videos. It enables fully automated funscript creation for individual scenes or entire folders of videos. The tool includes features like automatic system scaling support, quick installation guides for Windows, Linux, and macOS, manual installation instructions, NVIDIA GPU setup, AMD GPU acceleration, YOLO model download, GUI settings, GitHub token setup, command-line usage, modular systems for funscript filtering and motion tracking, performance and parallel processing tips, and more. The project is still in early development stages and is not intended for commercial use.
omniscient
Omniscient is an advanced AI Platform offered as a SaaS, empowering projects with cutting-edge artificial intelligence capabilities. Seamlessly integrating with Next.js 14, React, Typescript, and APIs like OpenAI and Replicate, it provides solutions for code generation, conversation simulation, image creation, music composition, and video generation.
heurist-agent-framework
Heurist Agent Framework is a flexible multi-interface AI agent framework that allows processing text and voice messages, generating images and videos, interacting across multiple platforms, fetching and storing information in a knowledge base, accessing external APIs and tools, and composing complex workflows using Mesh Agents. It supports various platforms like Telegram, Discord, Twitter, Farcaster, REST API, and MCP. The framework is built on a modular architecture and provides core components, tools, workflows, and tool integration with MCP support.
Riona-AI-Agent
Riona-AI-Agent is a versatile AI chatbot designed to assist users in various tasks. It utilizes natural language processing and machine learning algorithms to understand user queries and provide accurate responses. The chatbot can be integrated into websites, applications, and messaging platforms to enhance user experience and streamline communication. With its customizable features and easy deployment, Riona-AI-Agent is suitable for businesses, developers, and individuals looking to automate customer support, provide information, and engage with users in a conversational manner.
Vodalus-Expert-LLM-Forge
Vodalus Expert LLM Forge is a tool designed for crafting datasets and efficiently fine-tuning models using free open-source tools. It includes components for data generation, LLM interaction, RAG engine integration, model training, fine-tuning, and quantization. The tool is suitable for users at all levels and is accompanied by comprehensive documentation. Users can generate synthetic data, interact with LLMs, train models, and optimize performance for local execution. The tool provides detailed guides and instructions for setup, usage, and customization.
comfyui_LLM_Polymath
LLM Polymath Chat Node is an advanced Chat Node for ComfyUI that integrates large language models to build text-driven applications and automate data processes, enhancing prompt responses by incorporating real-time web search, linked content extraction, and custom agent instructions. It supports both OpenAI’s GPT-like models and alternative models served via a local Ollama API. The core functionalities include Comfy Node Finder and Smart Assistant, along with additional agents like Flux Prompter, Custom Instructors, Python debugger, and scripter. The tool offers features for prompt processing, web search integration, model & API integration, custom instructions, image handling, logging & debugging, output compression, and more.
ai_automation_suggester
An integration for Home Assistant that leverages AI models to understand your unique home environment and propose intelligent automations. By analyzing your entities, devices, areas, and existing automations, the AI Automation Suggester helps you discover new, context-aware use cases you might not have considered, ultimately streamlining your home management and improving efficiency, comfort, and convenience. The tool acts as a personal automation consultant, providing actionable YAML-based automations that can save energy, improve security, enhance comfort, and reduce manual intervention. It turns the complexity of a large Home Assistant environment into actionable insights and tangible benefits.
Ivy-Framework
Ivy-Framework is a powerful tool for building internal applications with AI assistance using C# codebase. It provides a CLI for project initialization, authentication integrations, database support, LLM code generation, secrets management, container deployment, hot reload, dependency injection, state management, routing, and external widget framework. Users can easily create data tables for sorting, filtering, and pagination. The framework offers a seamless integration of front-end and back-end development, making it ideal for developing robust internal tools and dashboards.
MARBLE
MARBLE (Multi-Agent Coordination Backbone with LLM Engine) is a modular framework for developing, testing, and evaluating multi-agent systems leveraging Large Language Models. It provides a structured environment for agents to interact in simulated environments, utilizing cognitive abilities and communication mechanisms for collaborative or competitive tasks. The framework features modular design, multi-agent support, LLM integration, shared memory, flexible environments, metrics and evaluation, industrial coding standards, and Docker support.

easydiffusion
Easy Diffusion 3.0 is a user-friendly tool for installing and using Stable Diffusion on your computer. It offers hassle-free installation, clutter-free UI, task queue, intelligent model detection, live preview, image modifiers, multiple prompts file, saving generated images, UI themes, searchable models dropdown, and supports various image generation tasks like 'Text to Image', 'Image to Image', and 'InPainting'. The tool also provides advanced features such as custom models, merge models, custom VAE models, multi-GPU support, auto-updater, developer console, and more. It is designed for both new users and advanced users looking for powerful AI image generation capabilities.
AIOStreams
AIOStreams is a versatile tool that combines streams from various addons into one platform, offering extensive customization options. Users can change result formats, filter results by various criteria, remove duplicates, prioritize services, sort results, specify size limits, and more. The tool scrapes results from selected addons, applies user configurations, and presents the results in a unified manner. It simplifies the process of finding and accessing desired content from multiple sources, enhancing user experience and efficiency.
kestra
Kestra is an open-source event-driven orchestration platform that simplifies building scheduled and event-driven workflows. It offers Infrastructure as Code best practices for data, process, and microservice orchestration, allowing users to create reliable workflows using YAML configuration. Key features include everything as code with Git integration, event-driven and scheduled workflows, rich plugin ecosystem for data extraction and script running, intuitive UI with syntax highlighting, scalability for millions of workflows, version control friendly, and various features for structure and resilience. Kestra ensures declarative orchestration logic management even when workflows are modified via UI, API calls, or other methods.
nanobrowser
Nanobrowser is an open-source AI web automation tool that runs in your browser. It is a free alternative to OpenAI Operator with flexible LLM options and a multi-agent system. Nanobrowser offers premium web automation capabilities while keeping users in complete control, with features like a multi-agent system, interactive side panel, task automation, follow-up questions, and multiple LLM support. Users can easily download and install Nanobrowser as a Chrome extension, configure agent models, and accomplish tasks such as news summary, GitHub research, and shopping research with just a sentence. The tool uses a specialized multi-agent system powered by large language models to understand and execute complex web tasks. Nanobrowser is actively developed with plans to expand LLM support, implement security measures, optimize memory usage, enable session replay, and develop specialized agents for domain-specific tasks. Contributions from the community are welcome to improve Nanobrowser and build the future of web automation.

swark
Swark is a VS Code extension that automatically generates architecture diagrams from code using large language models (LLMs). It is directly integrated with GitHub Copilot, requires no authentication or API key, and supports all languages. Swark helps users learn new codebases, review AI-generated code, improve documentation, understand legacy code, spot design flaws, and gain test coverage insights. It saves output in a 'swark-output' folder with diagram and log files. Source code is only shared with GitHub Copilot for privacy. The extension settings allow customization for file reading, file extensions, exclusion patterns, and language model selection. Swark is open source under the GNU Affero General Public License v3.0.
Simplifine
Simplifine is an open-source library designed for easy LLM finetuning, enabling users to perform tasks such as supervised fine tuning, question-answer finetuning, contrastive loss for embedding tasks, multi-label classification finetuning, and more. It provides features like WandB logging, in-built evaluation tools, automated finetuning parameters, and state-of-the-art optimization techniques. The library offers bug fixes, new features, and documentation updates in its latest version. Users can install Simplifine via pip or directly from GitHub. The project welcomes contributors and provides comprehensive documentation and support for users.
For similar tasks
Awesome-LLM4EDA
LLM4EDA is a repository dedicated to showcasing the emerging progress in utilizing Large Language Models for Electronic Design Automation. The repository includes resources, papers, and tools that leverage LLMs to solve problems in EDA. It covers a wide range of applications such as knowledge acquisition, code generation, code analysis, verification, and large circuit models. The goal is to provide a comprehensive understanding of how LLMs can revolutionize the EDA industry by offering innovative solutions and new interaction paradigms.
DeGPT
DeGPT is a tool designed to optimize decompiler output using Large Language Models (LLM). It requires manual installation of specific packages and setting up API key for OpenAI. The tool provides functionality to perform optimization on decompiler output by running specific scripts.
code2prompt
Code2Prompt is a powerful command-line tool that generates comprehensive prompts from codebases, designed to streamline interactions between developers and Large Language Models (LLMs) for code analysis, documentation, and improvement tasks. It bridges the gap between codebases and LLMs by converting projects into AI-friendly prompts, enabling users to leverage AI for various software development tasks. The tool offers features like holistic codebase representation, intelligent source tree generation, customizable prompt templates, smart token management, Gitignore integration, flexible file handling, clipboard-ready output, multiple output options, and enhanced code readability.
SinkFinder
SinkFinder + LLM is a closed-source semi-automatic vulnerability discovery tool that performs static code analysis on jar/war/zip files. It enhances the capability of LLM large models to verify path reachability and assess the trustworthiness score of the path based on the contextual code environment. Users can customize class and jar exclusions, depth of recursive search, and other parameters through command-line arguments. The tool generates rule.json configuration file after each run and requires configuration of the DASHSCOPE_API_KEY for LLM capabilities. The tool provides detailed logs on high-risk paths, LLM results, and other findings. Rules.json file contains sink rules for various vulnerability types with severity levels and corresponding sink methods.
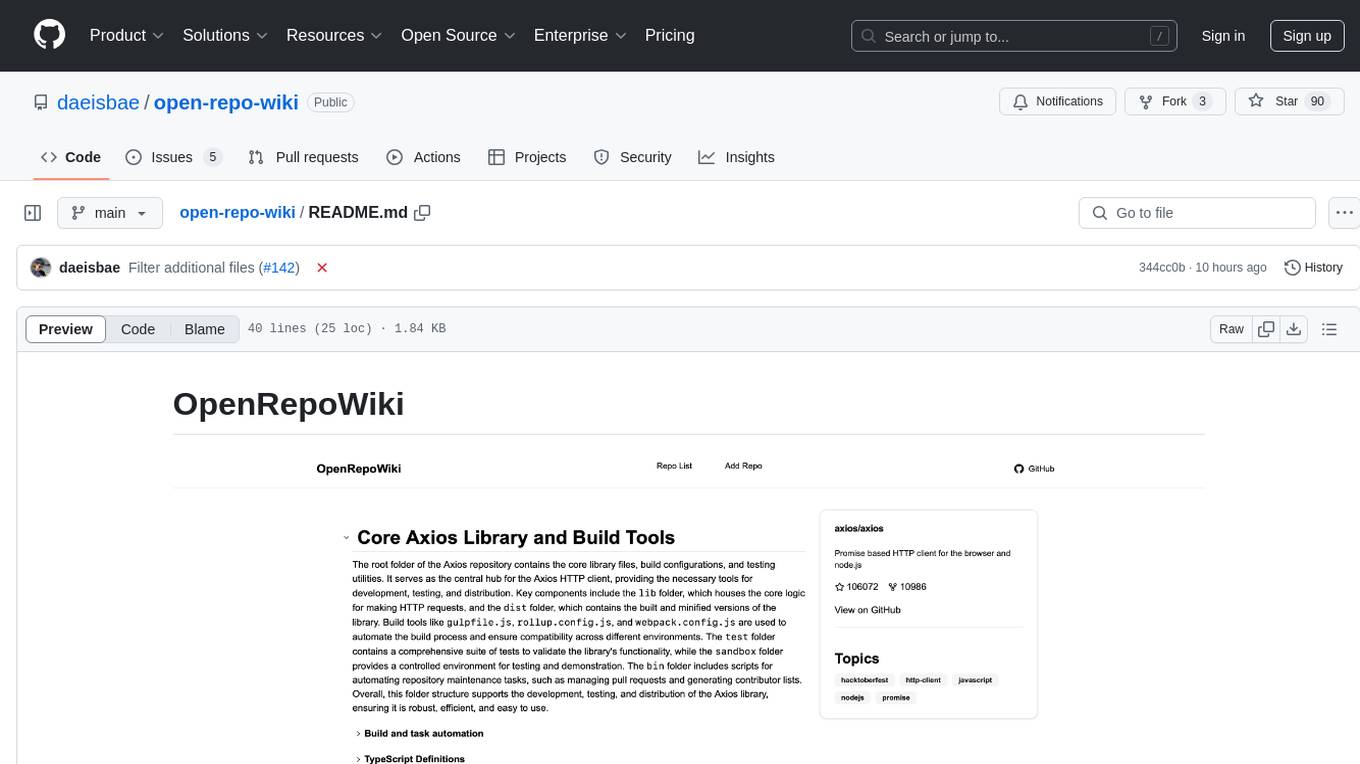
open-repo-wiki
OpenRepoWiki is a tool designed to automatically generate a comprehensive wiki page for any GitHub repository. It simplifies the process of understanding the purpose, functionality, and core components of a repository by analyzing its code structure, identifying key files and functions, and providing explanations. The tool aims to assist individuals who want to learn how to build various projects by providing a summarized overview of the repository's contents. OpenRepoWiki requires certain dependencies such as Google AI Studio or Deepseek API Key, PostgreSQL for storing repository information, Github API Key for accessing repository data, and Amazon S3 for optional usage. Users can configure the tool by setting up environment variables, installing dependencies, building the server, and running the application. It is recommended to consider the token usage and opt for cost-effective options when utilizing the tool.

CodebaseToPrompt
CodebaseToPrompt is a simple tool that converts a local directory into a structured prompt for Large Language Models (LLMs). It allows users to select specific files for code review, analysis, or documentation by exploring and filtering through the file tree in a browser-based interface. The tool generates a formatted output that can be directly used with AI tools, provides token count estimates, and supports local storage for saving selections. Users can easily copy the selected files in the desired format for further use.
air
air is an R formatter and language server written in Rust. It is currently in alpha stage, so users should expect breaking changes in both the API and formatting results. The tool draws inspiration from various sources like roslyn, swift, rust-analyzer, prettier, biome, and ruff. It provides formatters and language servers, influenced by design decisions from these tools. Users can install air using standalone installers for macOS, Linux, and Windows, which automatically add air to the PATH. Developers can also install the dev version of the air CLI and VS Code extension for further customization and development.
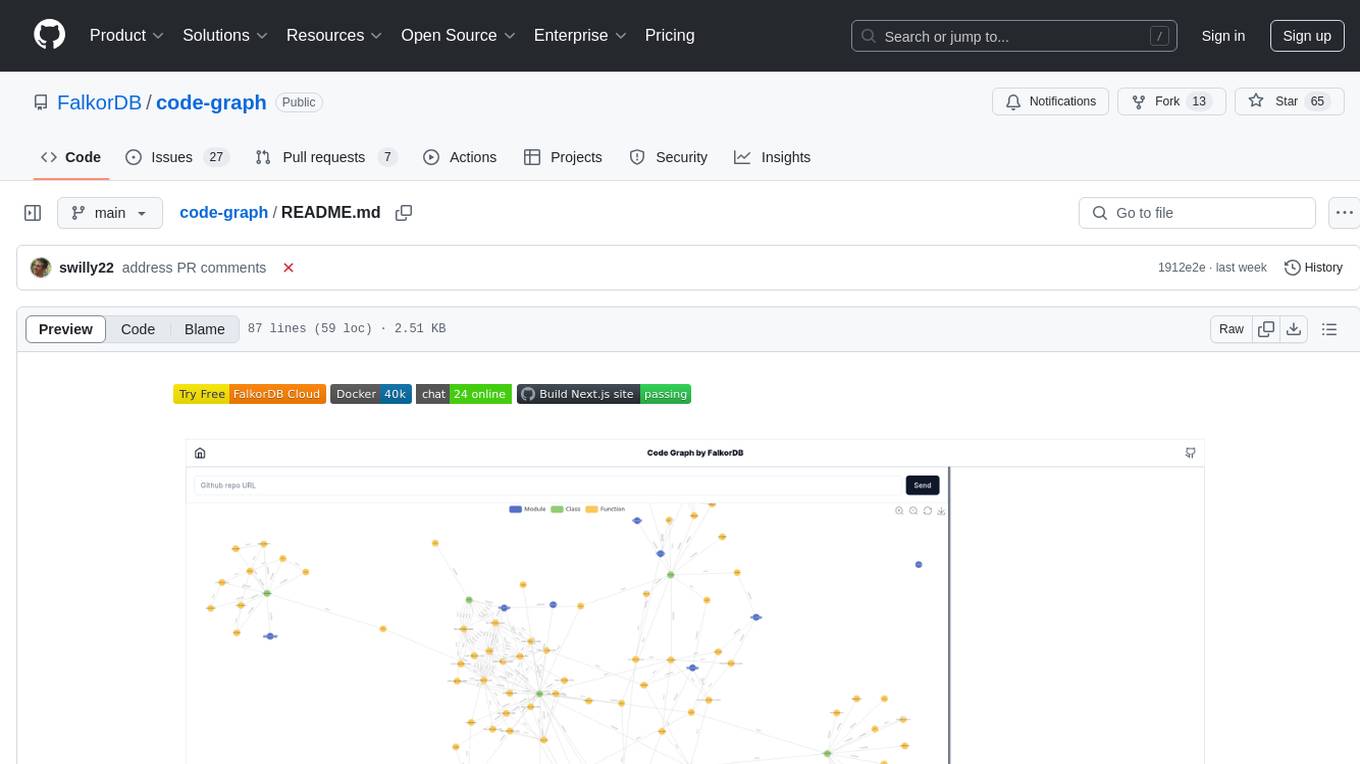
code-graph
Code-graph is a tool composed of FalkorDB Graph DB, Code-Graph-Backend, and Code-Graph-Frontend. It allows users to store and query graphs, manage backend logic, and interact with the website. Users can run the components locally by setting up environment variables and installing dependencies. The tool supports analyzing C & Python source files with plans to add support for more languages in the future. It provides a local repository analysis feature and a live demo accessible through a web browser.
For similar jobs
sweep
Sweep is an AI junior developer that turns bugs and feature requests into code changes. It automatically handles developer experience improvements like adding type hints and improving test coverage.
teams-ai
The Teams AI Library is a software development kit (SDK) that helps developers create bots that can interact with Teams and Microsoft 365 applications. It is built on top of the Bot Framework SDK and simplifies the process of developing bots that interact with Teams' artificial intelligence capabilities. The SDK is available for JavaScript/TypeScript, .NET, and Python.
ai-guide
This guide is dedicated to Large Language Models (LLMs) that you can run on your home computer. It assumes your PC is a lower-end, non-gaming setup.
classifai
Supercharge WordPress Content Workflows and Engagement with Artificial Intelligence. Tap into leading cloud-based services like OpenAI, Microsoft Azure AI, Google Gemini and IBM Watson to augment your WordPress-powered websites. Publish content faster while improving SEO performance and increasing audience engagement. ClassifAI integrates Artificial Intelligence and Machine Learning technologies to lighten your workload and eliminate tedious tasks, giving you more time to create original content that matters.
chatbot-ui
Chatbot UI is an open-source AI chat app that allows users to create and deploy their own AI chatbots. It is easy to use and can be customized to fit any need. Chatbot UI is perfect for businesses, developers, and anyone who wants to create a chatbot.
BricksLLM
BricksLLM is a cloud native AI gateway written in Go. Currently, it provides native support for OpenAI, Anthropic, Azure OpenAI and vLLM. BricksLLM aims to provide enterprise level infrastructure that can power any LLM production use cases. Here are some use cases for BricksLLM: * Set LLM usage limits for users on different pricing tiers * Track LLM usage on a per user and per organization basis * Block or redact requests containing PIIs * Improve LLM reliability with failovers, retries and caching * Distribute API keys with rate limits and cost limits for internal development/production use cases * Distribute API keys with rate limits and cost limits for students
uAgents
uAgents is a Python library developed by Fetch.ai that allows for the creation of autonomous AI agents. These agents can perform various tasks on a schedule or take action on various events. uAgents are easy to create and manage, and they are connected to a fast-growing network of other uAgents. They are also secure, with cryptographically secured messages and wallets.
griptape
Griptape is a modular Python framework for building AI-powered applications that securely connect to your enterprise data and APIs. It offers developers the ability to maintain control and flexibility at every step. Griptape's core components include Structures (Agents, Pipelines, and Workflows), Tasks, Tools, Memory (Conversation Memory, Task Memory, and Meta Memory), Drivers (Prompt and Embedding Drivers, Vector Store Drivers, Image Generation Drivers, Image Query Drivers, SQL Drivers, Web Scraper Drivers, and Conversation Memory Drivers), Engines (Query Engines, Extraction Engines, Summary Engines, Image Generation Engines, and Image Query Engines), and additional components (Rulesets, Loaders, Artifacts, Chunkers, and Tokenizers). Griptape enables developers to create AI-powered applications with ease and efficiency.