scalene
Scalene: a high-performance, high-precision CPU, GPU, and memory profiler for Python with AI-powered optimization proposals
Stars: 12508
Scalene is a high-performance CPU, GPU, and memory profiler for Python that provides detailed information and runs faster than many other profilers. It incorporates AI-powered proposed optimizations, allowing users to generate optimization suggestions by clicking on specific lines or regions of code. Scalene separates time spent in Python from native code, highlights hotspots, and identifies memory usage per line. It supports GPU profiling on NVIDIA-based systems and detects memory leaks. Users can generate reduced profiles, profile specific functions using decorators, and suspend/resume profiling for background processes. Scalene is available as a pip or conda package and works on various platforms. It offers features like profiling at the line level, memory trends, copy volume reporting, and leak detection.
README:
by Emery Berger, Sam Stern, and Juan Altmayer Pizzorno.
(tweet from Ian Ozsvald, author of High Performance Python)
Scalene web-based user interface: http://plasma-umass.org/scalene-gui/
Scalene is a high-performance CPU, GPU and memory profiler for Python that does a number of things that other Python profilers do not and cannot do. It runs orders of magnitude faster than many other profilers while delivering far more detailed information. It is also the first profiler ever to incorporate AI-powered proposed optimizations.
Note
To enable AI-powered optimization suggestions, you need to enter an OpenAI key in the box under "Advanced options". Your account will need to have a positive balance for this to work (check your balance at https://platform.openai.com/account/usage).

Once you've entered your OpenAI key (see above), click on the lightning bolt (⚡) beside any line or the explosion (💥) for an entire region of code to generate a proposed optimization. Click on a proposed optimization to copy it to the clipboard.
You can click as many times as you like on the lightning bolt or explosion, and it will generate different suggested optimizations. Your mileage may vary, but in some cases, the suggestions are quite impressive (e.g., order-of-magnitude improvements).
python3 -m pip install -U scaleneor
conda install -c conda-forge scaleneAfter installing Scalene, you can use Scalene at the command line, or as a Visual Studio Code extension.
Using the Scalene VS Code Extension:
First, install the Scalene extension from the VS Code Marketplace or by searching for it within VS Code by typing Command-Shift-X (Mac) or Ctrl-Shift-X (Windows). Once that's installed, click Command-Shift-P or Ctrl-Shift-P to open the Command Palette. Then select "Scalene: AI-powered profiling..." (you can start typing Scalene and it will pop up if it's installed). Run that and, assuming your code runs for at least a second, a Scalene profile will appear in a webview.
Commonly used command-line options:
scalene your_prog.py                             # full profile (outputs to web interface)
python3 -m scalene your_prog.py                  # equivalent alternative

scalene --cli your_prog.py                       # use the command-line only (no web interface)

scalene --cpu your_prog.py                       # only profile CPU
scalene --cpu --gpu your_prog.py                 # only profile CPU and GPU
scalene --cpu --gpu --memory your_prog.py        # profile everything (same as no options)

scalene --reduced-profile your_prog.py           # only profile lines with significant usage
scalene --profile-interval 5.0 your_prog.py      # output a new profile every five seconds

scalene (Scalene options) --- your_prog.py (...) # use --- to tell Scalene to ignore options after that point
scalene --help                                   # lists all options
Using Scalene programmatically in your code:
Invoke using scalene as above and then:
from scalene import scalene_profiler

# Turn profiling on
scalene_profiler.start()

# your code

# Turn profiling off
scalene_profiler.stop()
from scalene.scalene_profiler import enable_profiling
with enable_profiling():
# do something
Using Scalene to profile only specific functions via @profile:
Just preface any functions you want to profile with the @profile decorator and run it with Scalene:
# do not import profile!

@profile
def slow_function():
    import time
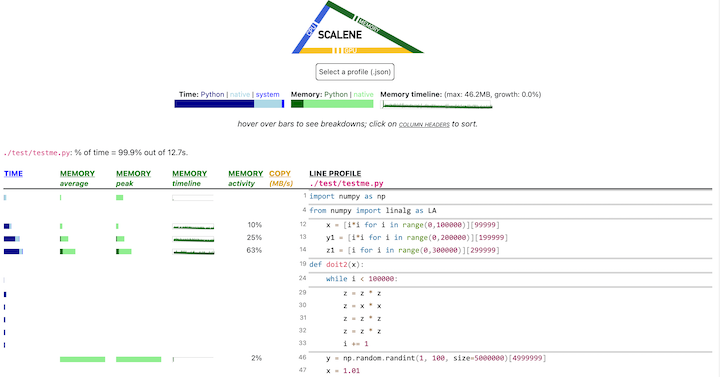
time.sleep(3)Scalene has both a CLI and a web-based GUI (demo here).
By default, once Scalene has profiled your program, it will open a
tab in a web browser with an interactive user interface (all processing is done
locally). Hover over bars to see breakdowns of CPU and memory
consumption, and click on underlined column headers to sort the
columns. The generated file profile.html is self-contained and can be saved for later use.
This talk presented at PyCon 2021 walks through Scalene's advantages and how to use it to debug the performance of an application (and provides some technical details on its internals). We highly recommend watching this video!
-
Scalene is fast. It uses sampling instead of instrumentation or relying on Python's tracing facilities. Its overhead is typically no more than 10-20% (and often less).
-
Scalene is accurate. We tested CPU profiler accuracy and found that Scalene is among the most accurate profilers, correctly measuring time taken.
- Scalene performs profiling at the line level and per function, pointing to the functions and the specific lines of code responsible for the execution time in your program.
- Scalene separates out time spent in Python from time in native code (including libraries). Most Python programmers aren't going to optimize the performance of native code (which is usually either in the Python implementation or external libraries), so this helps developers focus their optimization efforts on the code they can actually improve.
- Scalene highlights hotspots (code accounting for significant percentages of CPU time or memory allocation) in red, making them even easier to spot.
- Scalene also separates out system time, making it easy to find I/O bottlenecks.
- Scalene reports GPU time (currently limited to NVIDIA-based systems).
- Scalene profiles memory usage. In addition to tracking CPU usage, Scalene also points to the specific lines of code responsible for memory growth. It accomplishes this via an included specialized memory allocator.
- Scalene separates out the percentage of memory consumed by Python code vs. native code.
- Scalene produces per-line memory profiles.
- Scalene identifies lines with likely memory leaks.
- Scalene profiles copying volume, making it easy to spot inadvertent copying, especially due to crossing Python/library boundaries (e.g., accidentally converting
numpyarrays into Python arrays, and vice versa).
- Scalene can produce reduced profiles (via
--reduced-profile) that only report lines that consume more than 1% of CPU or perform at least 100 allocations. - Scalene supports
@profiledecorators to profile only specific functions. - When Scalene is profiling a program launched in the background (via
&), you can suspend and resume profiling.
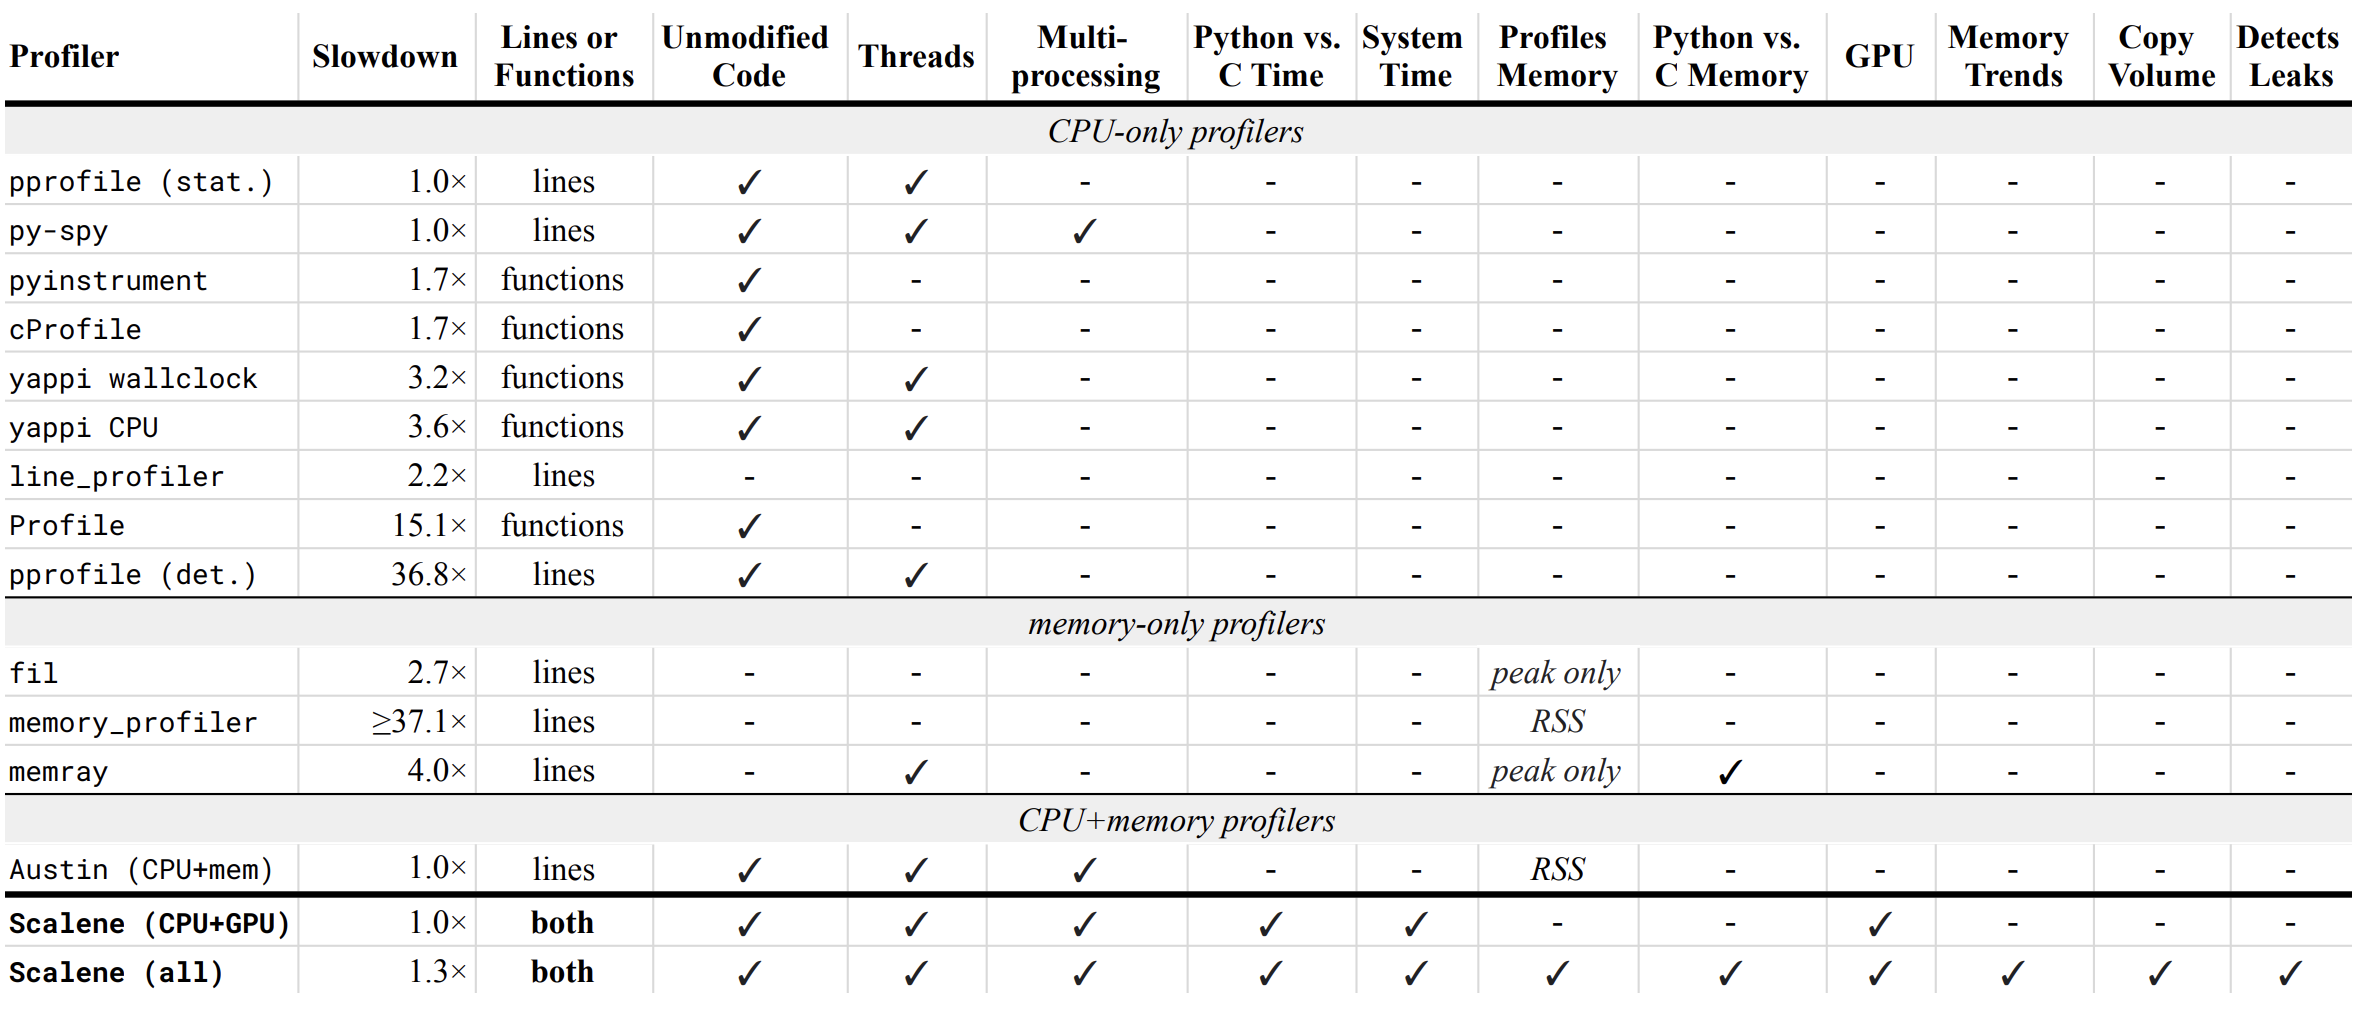
Below is a table comparing the performance and features of various profilers to Scalene.
- Slowdown: the slowdown when running a benchmark from the Pyperformance suite. Green means less than 2x overhead. Scalene's overhead is just a 35% slowdown.
Scalene has all of the following features, many of which only Scalene supports:
- Lines or functions: does the profiler report information only for entire functions, or for every line -- Scalene does both.
- Unmodified Code: works on unmodified code.
- Threads: supports Python threads.
-
Multiprocessing: supports use of the
multiprocessinglibrary -- Scalene only - Python vs. C time: breaks out time spent in Python vs. native code (e.g., libraries) -- Scalene only
- System time: breaks out system time (e.g., sleeping or performing I/O) -- Scalene only
- Profiles memory: reports memory consumption per line / function
- GPU: reports time spent on an NVIDIA GPU (if present) -- Scalene only
- Memory trends: reports memory use over time per line / function -- Scalene only
- Copy volume: reports megabytes being copied per second -- Scalene only
- Detects leaks: automatically pinpoints lines responsible for likely memory leaks -- Scalene only
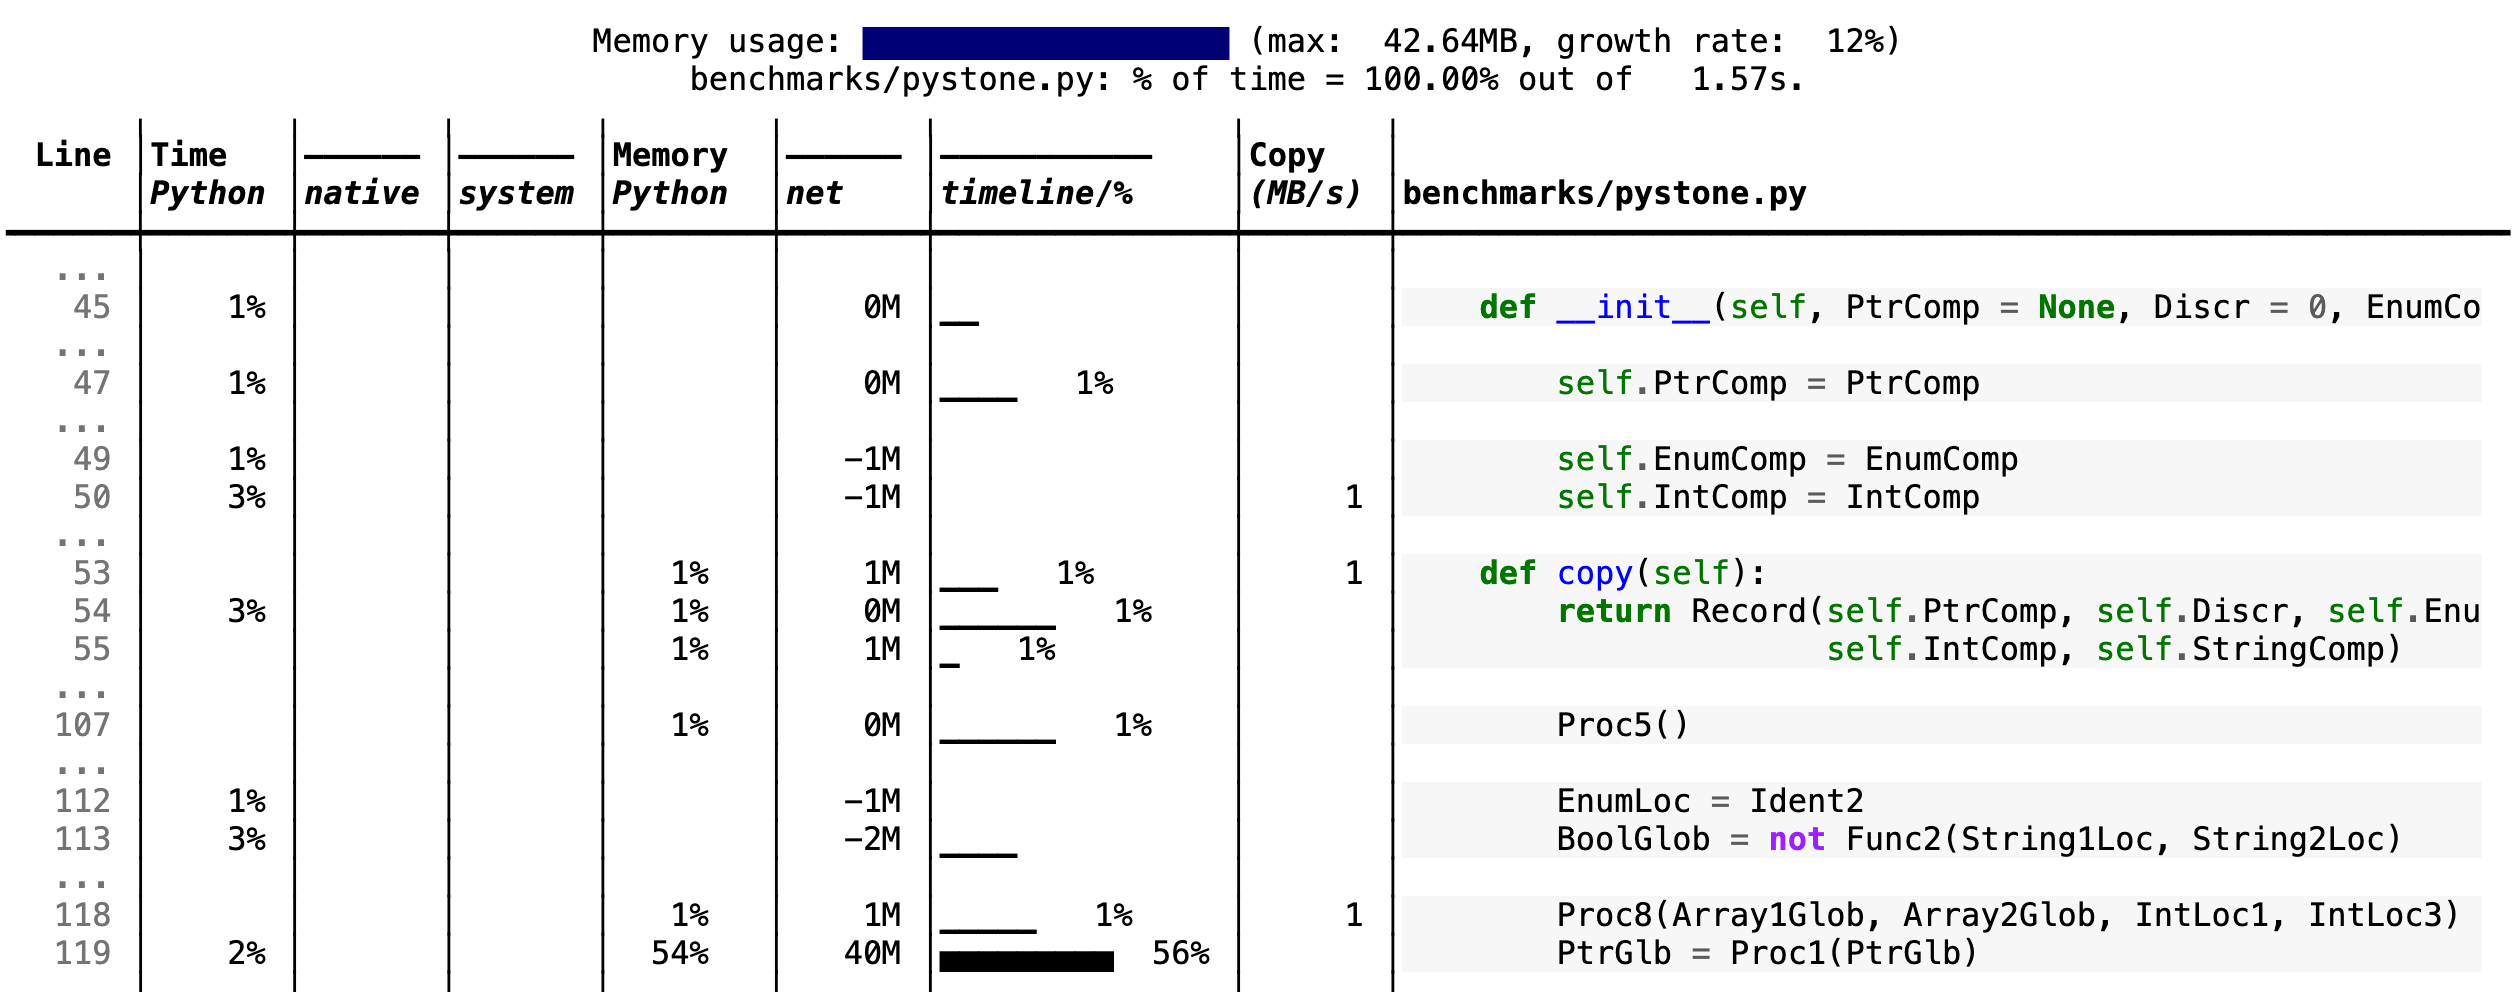
If you include the --cli option, Scalene prints annotated source code for the program being profiled
(as text, JSON (--json), or HTML (--html)) and any modules it
uses in the same directory or subdirectories (you can optionally have
it --profile-all and only include files with at least a
--cpu-percent-threshold of time). Here is a snippet from
pystone.py.
- Memory usage at the top: Visualized by "sparklines", memory consumption over the runtime of the profiled code.
- "Time Python": How much time was spent in Python code.
- "native": How much time was spent in non-Python code (e.g., libraries written in C/C++).
- "system": How much time was spent in the system (e.g., I/O).
- "GPU": (not shown here) How much time spent on the GPU, if your system has an NVIDIA GPU installed.
- "Memory Python": How much of the memory allocation happened on the Python side of the code, as opposed to in non-Python code (e.g., libraries written in C/C++).
- "net": Positive net memory numbers indicate total memory allocation in megabytes; negative net memory numbers indicate memory reclamation.
- "timeline / %": Visualized by "sparklines", memory consumption generated by this line over the program runtime, and the percentages of total memory activity this line represents.
- "Copy (MB/s)": The amount of megabytes being copied per second (see "About Scalene").
The following command runs Scalene on a provided example program.
scalene test/testme.py
Click to see all Scalene's options (available by running with --help)
    % scalene --help
     usage: scalene [-h] [--outfile OUTFILE] [--html] [--reduced-profile]
                    [--profile-interval PROFILE_INTERVAL] [--cpu-only]
                    [--profile-all] [--profile-only PROFILE_ONLY]
                    [--use-virtual-time]
                    [--cpu-percent-threshold CPU_PERCENT_THRESHOLD]
                    [--cpu-sampling-rate CPU_SAMPLING_RATE]
                    [--malloc-threshold MALLOC_THRESHOLD]

     Scalene: a high-precision CPU and memory profiler.
     https://github.com/plasma-umass/scalene

     command-line:
        % scalene [options] yourprogram.py
     or
        % python3 -m scalene [options] yourprogram.py

     in Jupyter, line mode:
        %scrun [options] statement

     in Jupyter, cell mode:
        %%scalene [options]
        code...
        code...

     optional arguments:
       -h, --help            show this help message and exit
       --outfile OUTFILE     file to hold profiler output (default: stdout)
       --html                output as HTML (default: text)
       --reduced-profile     generate a reduced profile, with non-zero lines only (default: False)
       --profile-interval PROFILE_INTERVAL
                             output profiles every so many seconds (default: inf)
       --cpu-only            only profile CPU time (default: profile CPU, memory, and copying)
       --profile-all         profile all executed code, not just the target program (default: only the target program)
       --profile-only PROFILE_ONLY
                             profile only code in filenames that contain the given strings, separated by commas (default: no restrictions)
       --use-virtual-time    measure only CPU time, not time spent in I/O or blocking (default: False)
       --cpu-percent-threshold CPU_PERCENT_THRESHOLD
                             only report profiles with at least this percent of CPU time (default: 1%)
       --cpu-sampling-rate CPU_SAMPLING_RATE
                             CPU sampling rate (default: every 0.01s)
       --malloc-threshold MALLOC_THRESHOLD
                             only report profiles with at least this many allocations (default: 100)

     When running Scalene in the background, you can suspend/resume profiling
     for the process ID that Scalene reports. For example:

        % python3 -m scalene [options] yourprogram.py &
      Scalene now profiling process 12345
        to suspend profiling: python3 -m scalene.profile --off --pid 12345
to resume profiling: python3 -m scalene.profile --on --pid 12345Instructions for installing and using Scalene with Jupyter notebooks
This notebook illustrates the use of Scalene in Jupyter.
Installation:
!pip install scalene
%load_ext scalene
Line mode:
%scrun [options] statementCell mode:
%%scalene [options]
code...
code...Using pip (Mac OS X, Linux, Windows, and WSL2)
Scalene is distributed as a pip package and works on Mac OS X, Linux (including Ubuntu in Windows WSL2) and (with limitations) Windows platforms.
Note
The Windows version currently only supports CPU and GPU profiling, but not memory or copy profiling.
You can install it as follows:
% pip install -U scaleneor
% python3 -m pip install -U scaleneYou may need to install some packages first.
See https://stackoverflow.com/a/19344978/4954434 for full instructions for all Linux flavors.
For Ubuntu/Debian:
% sudo apt install git python3-all-devUsing conda (Mac OS X, Linux, Windows, and WSL2)
% conda install -c conda-forge scaleneScalene is distributed as a conda package and works on Mac OS X, Linux (including Ubuntu in Windows WSL2) and (with limitations) Windows platforms.
Note
The Windows version currently only supports CPU and GPU profiling, but not memory or copy profiling.
On ArchLinux
You can install Scalene on Arch Linux via the AUR
package. Use your favorite AUR helper, or
manually download the PKGBUILD and run makepkg -cirs to build. Note that this will place
libscalene.so in /usr/lib; modify the below usage instructions accordingly.
Can I use Scalene with PyTest?
A: Yes! You can run it as follows (for example):
python3 -m scalene --- -m pytest your_test.py
Is there any way to get shorter profiles or do more targeted profiling?
A: Yes! There are several options:
- Use
--reduced-profileto include only lines and files with memory/CPU/GPU activity. - Use
--profile-onlyto include only filenames containing specific strings (as in,--profile-only foo,bar,baz). - Decorate functions of interest with
@profileto have Scalene report only those functions. - Turn profiling on and off programmatically by importing Scalene profiler (
from scalene import scalene_profiler) and then turning profiling on and off viascalene_profiler.start()andscalene_profiler.stop(). By default, Scalene runs with profiling on, so to delay profiling until desired, use the--offcommand-line option (python3 -m scalene --off yourprogram.py).
How do I run Scalene in PyCharm?
A: In PyCharm, you can run Scalene at the command line by opening the terminal at the bottom of the IDE and running a Scalene command (e.g., python -m scalene <your program>). Use the options --cli, --html, and --outfile <your output.html> to generate an HTML file that you can then view in the IDE.
How do I use Scalene with Django?
A: Pass in the --noreload option (see https://github.com/plasma-umass/scalene/issues/178).
Does Scalene work with gevent/Greenlets?
A: Yes! Put the following code in the beginning of your program, or modify the call to monkey.patch_all as below:
from gevent import monkey
monkey.patch_all(thread=False)
How do I use Scalene with PyTorch on the Mac?
A: Scalene works with PyTorch version 1.5.1 on Mac OS X. There's a bug in newer versions of PyTorch (https://github.com/pytorch/pytorch/issues/57185) that interferes with Scalene (discussion here: https://github.com/plasma-umass/scalene/issues/110), but only on Macs.
For details about how Scalene works, please see the following paper, which won the Jay Lepreau Best Paper Award at OSDI 2023: Triangulating Python Performance Issues with Scalene. (Note that this paper does not include information about the AI-driven proposed optimizations.)
To cite Scalene in an academic paper, please use the following:
@inproceedings{288540,
author = {Emery D. Berger and Sam Stern and Juan Altmayer Pizzorno},
title = {Triangulating Python Performance Issues with {S}calene},
booktitle = {{17th USENIX Symposium on Operating Systems Design and Implementation (OSDI 23)}},
year = {2023},
isbn = {978-1-939133-34-2},
address = {Boston, MA},
pages = {51--64},
url = {https://www.usenix.org/conference/osdi23/presentation/berger},
publisher = {USENIX Association},
month = jul
}If you use Scalene to successfully debug a performance problem, please add a comment to this issue!
Logo created by Sophia Berger.
This material is based upon work supported by the National Science Foundation under Grant No. 1955610. Any opinions, findings, and conclusions or recommendations expressed in this material are those of the author(s) and do not necessarily reflect the views of the National Science Foundation.
For Tasks:
Click tags to check more tools for each tasksFor Jobs:
Alternative AI tools for scalene
Similar Open Source Tools

scalene
Scalene is a high-performance CPU, GPU, and memory profiler for Python that provides detailed information and runs faster than many other profilers. It incorporates AI-powered proposed optimizations, allowing users to generate optimization suggestions by clicking on specific lines or regions of code. Scalene separates time spent in Python from native code, highlights hotspots, and identifies memory usage per line. It supports GPU profiling on NVIDIA-based systems and detects memory leaks. Users can generate reduced profiles, profile specific functions using decorators, and suspend/resume profiling for background processes. Scalene is available as a pip or conda package and works on various platforms. It offers features like profiling at the line level, memory trends, copy volume reporting, and leak detection.
Easy-Translate
Easy-Translate is a script designed for translating large text files with a single command. It supports various models like M2M100, NLLB200, SeamlessM4T, LLaMA, and Bloom. The tool is beginner-friendly and offers seamless and customizable features for advanced users. It allows acceleration on CPU, multi-CPU, GPU, multi-GPU, and TPU, with support for different precisions and decoding strategies. Easy-Translate also provides an evaluation script for translations. Built on HuggingFace's Transformers and Accelerate library, it supports prompt usage and loading huge models efficiently.
Fabric
Fabric is an open-source framework designed to augment humans using AI by organizing prompts by real-world tasks. It addresses the integration problem of AI by creating and organizing prompts for various tasks. Users can create, collect, and organize AI solutions in a single place for use in their favorite tools. Fabric also serves as a command-line interface for those focused on the terminal. It offers a wide range of features and capabilities, including support for multiple AI providers, internationalization, speech-to-text, AI reasoning, model management, web search, text-to-speech, desktop notifications, and more. The project aims to help humans flourish by leveraging AI technology to solve human problems and enhance creativity.
kwaak
Kwaak is a tool that allows users to run a team of autonomous AI agents locally from their own machine. It enables users to write code, improve test coverage, update documentation, and enhance code quality while focusing on building innovative projects. Kwaak is designed to run multiple agents in parallel, interact with codebases, answer questions about code, find examples, write and execute code, create pull requests, and more. It is free and open-source, allowing users to bring their own API keys or models via Ollama. Kwaak is part of the bosun.ai project, aiming to be a platform for autonomous code improvement.

shellChatGPT
ShellChatGPT is a shell wrapper for OpenAI's ChatGPT, DALL-E, Whisper, and TTS, featuring integration with LocalAI, Ollama, Gemini, Mistral, Groq, and GitHub Models. It provides text and chat completions, vision, reasoning, and audio models, voice-in and voice-out chatting mode, text editor interface, markdown rendering support, session management, instruction prompt manager, integration with various service providers, command line completion, file picker dialogs, color scheme personalization, stdin and text file input support, and compatibility with Linux, FreeBSD, MacOS, and Termux for a responsive experience.
wcgw
wcgw is a shell and coding agent designed for Claude and Chatgpt. It provides full shell access with no restrictions, desktop control on Claude for screen capture and control, interactive command handling, large file editing, and REPL support. Users can use wcgw to create, execute, and iterate on tasks, such as solving problems with Python, finding code instances, setting up projects, creating web apps, editing large files, and running server commands. Additionally, wcgw supports computer use on Docker containers for desktop control. The tool can be extended with a VS Code extension for pasting context on Claude app and integrates with Chatgpt for custom GPT interactions.
tinystruct
Tinystruct is a simple Java framework designed for easy development with better performance. It offers a modern approach with features like CLI and web integration, built-in lightweight HTTP server, minimal configuration philosophy, annotation-based routing, and performance-first architecture. Developers can focus on real business logic without dealing with unnecessary complexities, making it transparent, predictable, and extensible.
Trace
Trace is a new AutoDiff-like tool for training AI systems end-to-end with general feedback. It generalizes the back-propagation algorithm by capturing and propagating an AI system's execution trace. Implemented as a PyTorch-like Python library, users can write Python code directly and use Trace primitives to optimize certain parts, similar to training neural networks.
basic-memory
Basic Memory is a tool that enables users to build persistent knowledge through natural conversations with Large Language Models (LLMs) like Claude. It uses the Model Context Protocol (MCP) to allow compatible LLMs to read and write to a local knowledge base stored in simple Markdown files on the user's computer. The tool facilitates creating structured notes during conversations, maintaining a semantic knowledge graph, and keeping all data local and under user control. Basic Memory aims to address the limitations of ephemeral LLM interactions by providing a structured, bi-directional, and locally stored knowledge management solution.
generative-models
Generative Models by Stability AI is a repository that provides various generative models for research purposes. It includes models like Stable Video 4D (SV4D) for video synthesis, Stable Video 3D (SV3D) for multi-view synthesis, SDXL-Turbo for text-to-image generation, and more. The repository focuses on modularity and implements a config-driven approach for building and combining submodules. It supports training with PyTorch Lightning and offers inference demos for different models. Users can access pre-trained models like SDXL-base-1.0 and SDXL-refiner-1.0 under a CreativeML Open RAIL++-M license. The codebase also includes tools for invisible watermark detection in generated images.
OpenMusic
OpenMusic is a repository providing an implementation of QA-MDT, a Quality-Aware Masked Diffusion Transformer for music generation. The code integrates state-of-the-art models and offers training strategies for music generation. The repository includes implementations of AudioLDM, PixArt-alpha, MDT, AudioMAE, and Open-Sora. Users can train or fine-tune the model using different strategies and datasets. The model is well-pretrained and can be used for music generation tasks. The repository also includes instructions for preparing datasets, training the model, and performing inference. Contact information is provided for any questions or suggestions regarding the project.
mflux
MFLUX is a line-by-line port of the FLUX implementation in the Huggingface Diffusers library to Apple MLX. It aims to run powerful FLUX models from Black Forest Labs locally on Mac machines. The codebase is minimal and explicit, prioritizing readability over generality and performance. Models are implemented from scratch in MLX, with tokenizers from the Huggingface Transformers library. Dependencies include Numpy and Pillow for image post-processing. Installation can be done using `uv tool` or classic virtual environment setup. Command-line arguments allow for image generation with specified models, prompts, and optional parameters. Quantization options for speed and memory reduction are available. LoRA adapters can be loaded for fine-tuning image generation. Controlnet support provides more control over image generation with reference images. Current limitations include generating images one by one, lack of support for negative prompts, and some LoRA adapters not working.
claude-code-tools
The 'claude-code-tools' repository provides productivity tools for Claude Code, Codex-CLI, and similar CLI coding agents. It includes CLI commands, skills, agents, hooks, and plugins for various tasks. The tools cover functionalities like session search, terminal automation, encrypted backup and sync, safe inspection of .env files, safety hooks, voice feedback, session chain repair, conversion between markdown and Google Docs, and CSV to Google Sheets and vice versa. The repository architecture consists of Python CLI, Rust TUI for search, and Node.js for action menus.
bigcodebench
BigCodeBench is an easy-to-use benchmark for code generation with practical and challenging programming tasks. It aims to evaluate the true programming capabilities of large language models (LLMs) in a more realistic setting. The benchmark is designed for HumanEval-like function-level code generation tasks, but with much more complex instructions and diverse function calls. BigCodeBench focuses on the evaluation of LLM4Code with diverse function calls and complex instructions, providing precise evaluation & ranking and pre-generated samples to accelerate code intelligence research. It inherits the design of the EvalPlus framework but differs in terms of execution environment and test evaluation.
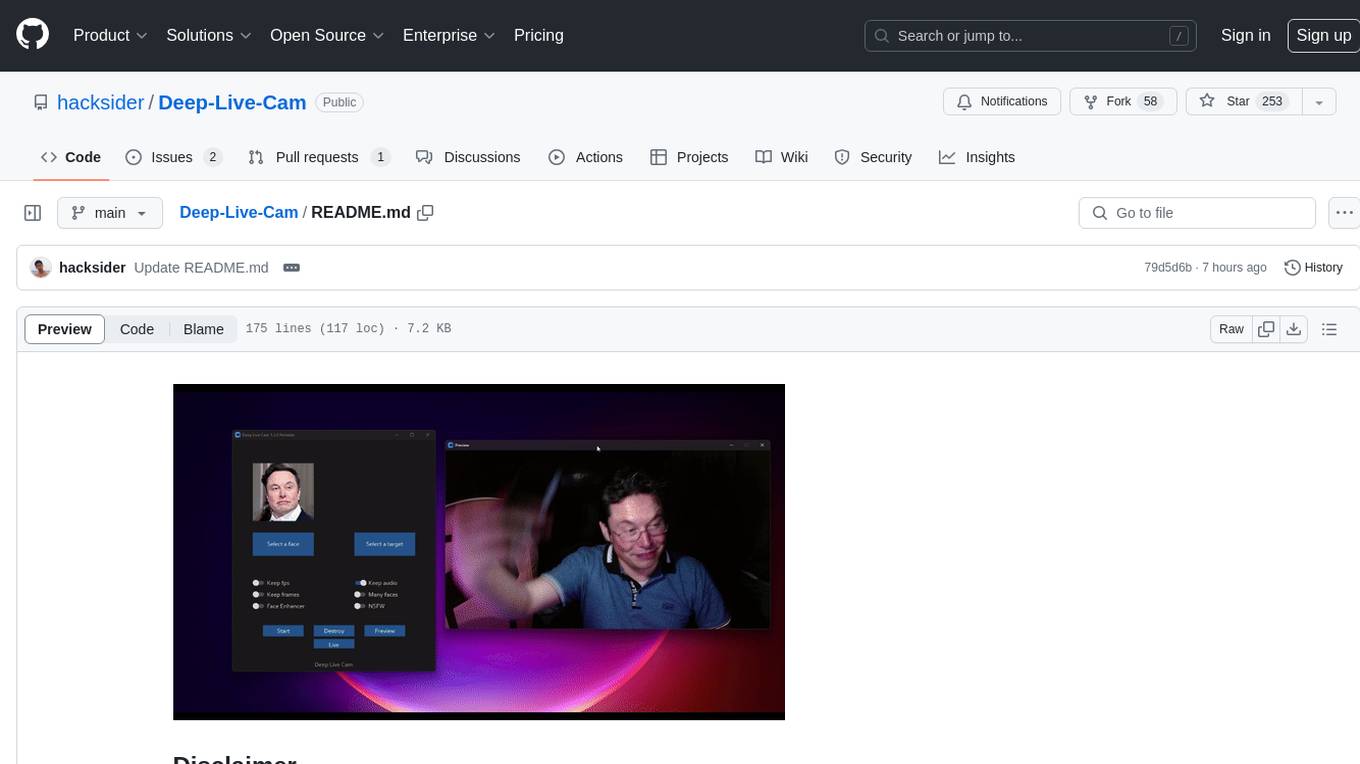
Deep-Live-Cam
Deep-Live-Cam is a software tool designed to assist artists in tasks such as animating custom characters or using characters as models for clothing. The tool includes built-in checks to prevent unethical applications, such as working on inappropriate media. Users are expected to use the tool responsibly and adhere to local laws, especially when using real faces for deepfake content. The tool supports both CPU and GPU acceleration for faster processing and provides a user-friendly GUI for swapping faces in images or videos.
For similar tasks

scalene
Scalene is a high-performance CPU, GPU, and memory profiler for Python that provides detailed information and runs faster than many other profilers. It incorporates AI-powered proposed optimizations, allowing users to generate optimization suggestions by clicking on specific lines or regions of code. Scalene separates time spent in Python from native code, highlights hotspots, and identifies memory usage per line. It supports GPU profiling on NVIDIA-based systems and detects memory leaks. Users can generate reduced profiles, profile specific functions using decorators, and suspend/resume profiling for background processes. Scalene is available as a pip or conda package and works on various platforms. It offers features like profiling at the line level, memory trends, copy volume reporting, and leak detection.
bpf-developer-tutorial
This is a development tutorial for eBPF based on CO-RE (Compile Once, Run Everywhere). It provides practical eBPF development practices from beginner to advanced, including basic concepts, code examples, and real-world applications. The tutorial focuses on eBPF examples in observability, networking, security, and more. It aims to help eBPF application developers quickly grasp eBPF development methods and techniques through examples in languages such as C, Go, and Rust. The tutorial is structured with independent eBPF tool examples in each directory, covering topics like kprobes, fentry, opensnoop, uprobe, sigsnoop, execsnoop, exitsnoop, runqlat, hardirqs, and more. The project is based on libbpf and frameworks like libbpf, Cilium, libbpf-rs, and eunomia-bpf for development.
memori
Memori is a lightweight and user-friendly memory management tool for developers. It helps in tracking memory usage, detecting memory leaks, and optimizing memory allocation in software projects. With Memori, developers can easily monitor and analyze memory consumption to improve the performance and stability of their applications. The tool provides detailed insights into memory usage patterns and helps in identifying areas for optimization. Memori is designed to be easy to integrate into existing projects and offers a simple yet powerful interface for managing memory resources effectively.
sourcery
Sourcery is an automated code reviewer tool that provides instant feedback on pull requests, helping to speed up the code review process, improve code quality, and accelerate development velocity. It offers high-level feedback, line-by-line suggestions, and aims to mimic the type of code review one would expect from a colleague. Sourcery can also be used as an IDE coding assistant to understand existing code, add unit tests, optimize code, and improve code quality with instant suggestions. It is free for public repos/open source projects and offers a 14-day trial for private repos.
remix-antd-admin
Remix Antd Admin is a full-stack management system built on Remix and Antd/TailwindCSS, featuring RBAC permission management and remix-i18n integration. It aims to provide a modern, simple, fast, and scalable full-stack website. The project is currently in development, transitioning from UI to full-stack, with a focus on stable architecture. The frontend utilizes remix data flow with server-side rendering, while the backend API uses redux-toolkit/query, prisma, rxjs, zod, and remix action/loader for server API services. The project includes authorization management with jose jwt for external API services beyond web applications. Key libraries used are Remix, express, Prisma, and pgsql.
ogpt.nvim
OGPT.nvim is a Neovim plugin that enables users to interact with various language models (LLMs) such as Ollama, OpenAI, TextGenUI, and more. Users can engage in interactive question-and-answer sessions, have persona-based conversations, and execute customizable actions like grammar correction, translation, keyword generation, docstring creation, test addition, code optimization, summarization, bug fixing, code explanation, and code readability analysis. The plugin allows users to define custom actions using a JSON file or plugin configurations.
llm.nvim
llm.nvim is a universal plugin for a large language model (LLM) designed to enable users to interact with LLM within neovim. Users can customize various LLMs such as gpt, glm, kimi, and local LLM. The plugin provides tools for optimizing code, comparing code, translating text, and more. It also supports integration with free models from Cloudflare, Github models, siliconflow, and others. Users can customize tools, chat with LLM, quickly translate text, and explain code snippets. The plugin offers a flexible window interface for easy interaction and customization.
Bodo
Bodo is a high-performance Python compute engine designed for large-scale data processing and AI workloads. It utilizes an auto-parallelizing just-in-time compiler to optimize Python programs, making them 20x to 240x faster compared to alternatives. Bodo seamlessly integrates with native Python APIs like Pandas and NumPy, eliminates runtime overheads using MPI for distributed execution, and provides exceptional performance and scalability for data workloads. It is easy to use, interoperable with the Python ecosystem, and integrates with modern data platforms like Apache Iceberg and Snowflake. Bodo focuses on data-intensive and computationally heavy workloads in data engineering, data science, and AI/ML, offering automatic optimization and parallelization, linear scalability, advanced I/O support, and a high-performance SQL engine.
For similar jobs
weave
Weave is a toolkit for developing Generative AI applications, built by Weights & Biases. With Weave, you can log and debug language model inputs, outputs, and traces; build rigorous, apples-to-apples evaluations for language model use cases; and organize all the information generated across the LLM workflow, from experimentation to evaluations to production. Weave aims to bring rigor, best-practices, and composability to the inherently experimental process of developing Generative AI software, without introducing cognitive overhead.
agentcloud
AgentCloud is an open-source platform that enables companies to build and deploy private LLM chat apps, empowering teams to securely interact with their data. It comprises three main components: Agent Backend, Webapp, and Vector Proxy. To run this project locally, clone the repository, install Docker, and start the services. The project is licensed under the GNU Affero General Public License, version 3 only. Contributions and feedback are welcome from the community.
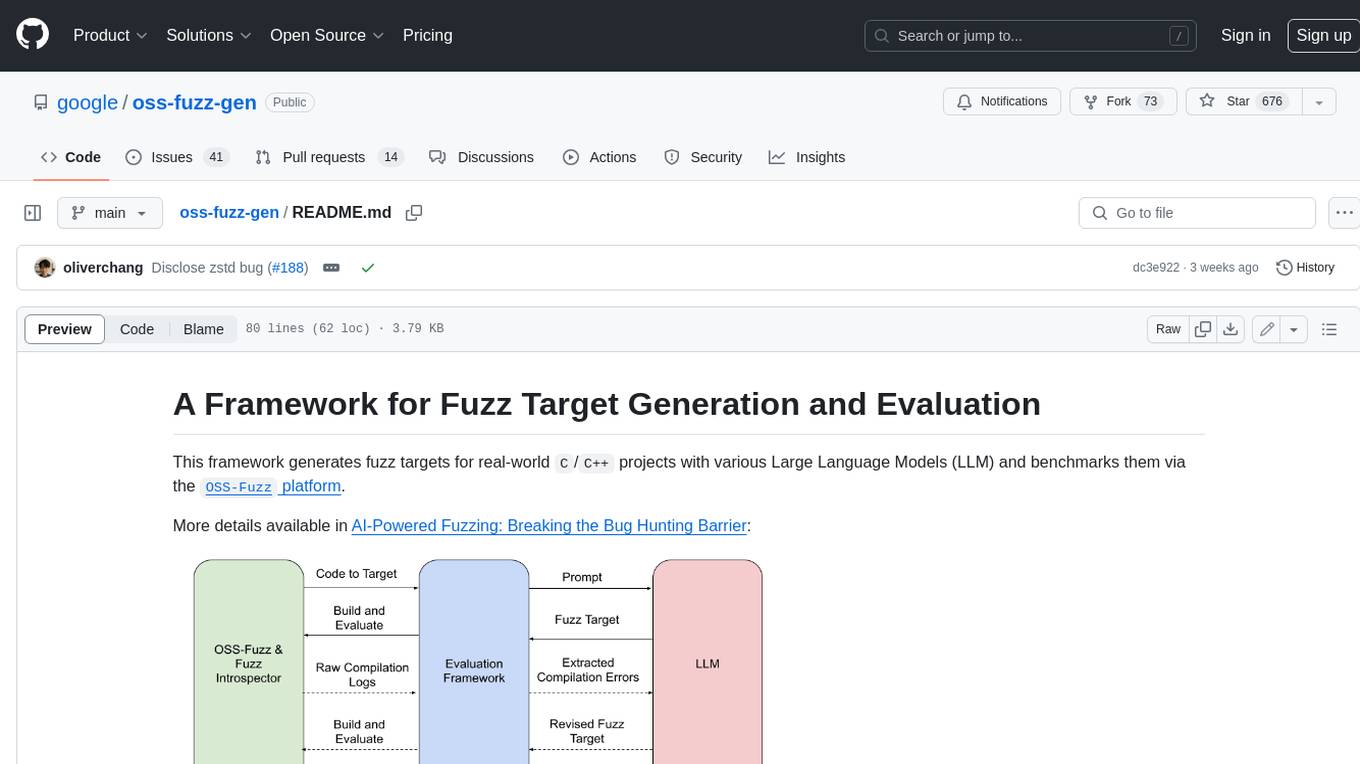
oss-fuzz-gen
This framework generates fuzz targets for real-world `C`/`C++` projects with various Large Language Models (LLM) and benchmarks them via the `OSS-Fuzz` platform. It manages to successfully leverage LLMs to generate valid fuzz targets (which generate non-zero coverage increase) for 160 C/C++ projects. The maximum line coverage increase is 29% from the existing human-written targets.
LLMStack
LLMStack is a no-code platform for building generative AI agents, workflows, and chatbots. It allows users to connect their own data, internal tools, and GPT-powered models without any coding experience. LLMStack can be deployed to the cloud or on-premise and can be accessed via HTTP API or triggered from Slack or Discord.
VisionCraft
The VisionCraft API is a free API for using over 100 different AI models. From images to sound.
kaito
Kaito is an operator that automates the AI/ML inference model deployment in a Kubernetes cluster. It manages large model files using container images, avoids tuning deployment parameters to fit GPU hardware by providing preset configurations, auto-provisions GPU nodes based on model requirements, and hosts large model images in the public Microsoft Container Registry (MCR) if the license allows. Using Kaito, the workflow of onboarding large AI inference models in Kubernetes is largely simplified.
PyRIT
PyRIT is an open access automation framework designed to empower security professionals and ML engineers to red team foundation models and their applications. It automates AI Red Teaming tasks to allow operators to focus on more complicated and time-consuming tasks and can also identify security harms such as misuse (e.g., malware generation, jailbreaking), and privacy harms (e.g., identity theft). The goal is to allow researchers to have a baseline of how well their model and entire inference pipeline is doing against different harm categories and to be able to compare that baseline to future iterations of their model. This allows them to have empirical data on how well their model is doing today, and detect any degradation of performance based on future improvements.
Azure-Analytics-and-AI-Engagement
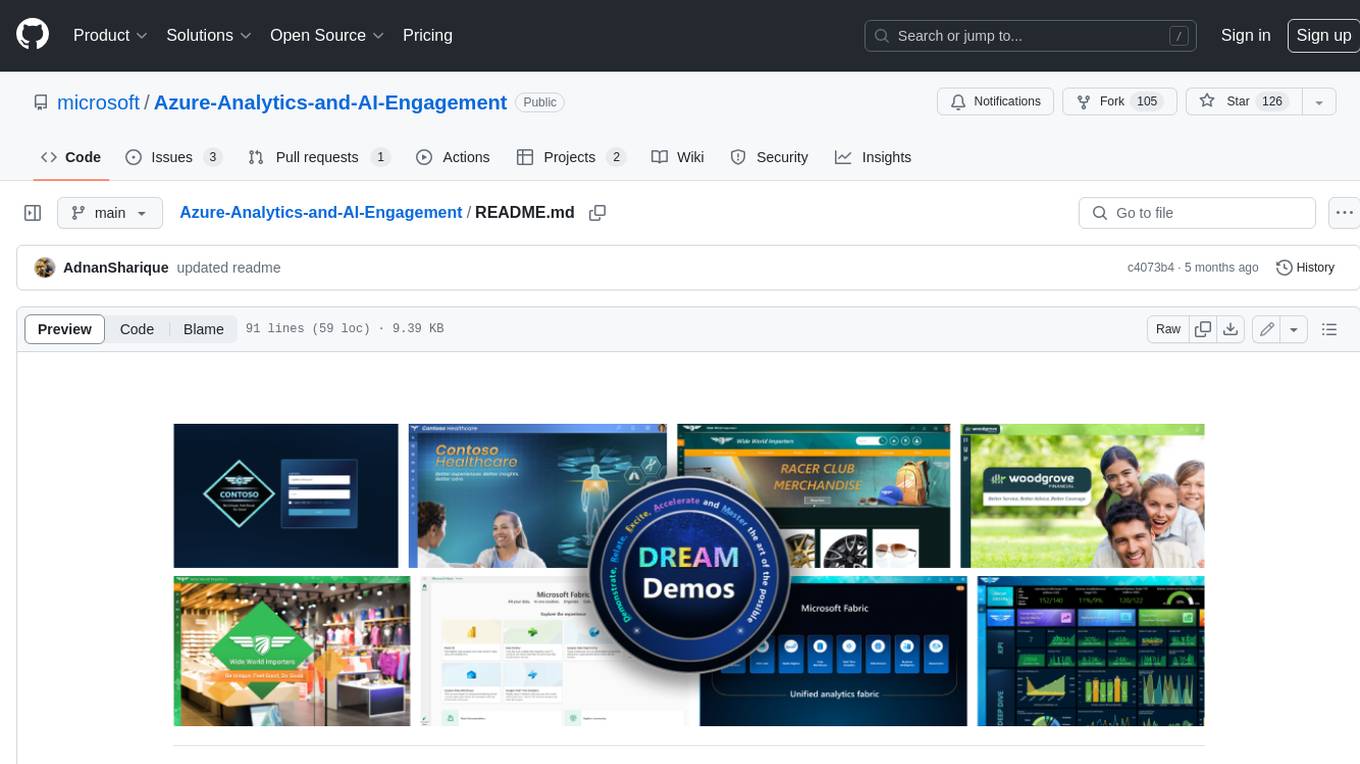
The Azure-Analytics-and-AI-Engagement repository provides packaged Industry Scenario DREAM Demos with ARM templates (Containing a demo web application, Power BI reports, Synapse resources, AML Notebooks etc.) that can be deployed in a customer’s subscription using the CAPE tool within a matter of few hours. Partners can also deploy DREAM Demos in their own subscriptions using DPoC.


