ChatDBG
ChatDBG - AI-assisted debugging. Uses AI to answer 'why'
Stars: 825
ChatDBG is an AI-based debugging assistant for C/C++/Python/Rust code that integrates large language models into a standard debugger (`pdb`, `lldb`, `gdb`, and `windbg`) to help debug your code. With ChatDBG, you can engage in a dialog with your debugger, asking open-ended questions about your program, like `why is x null?`. ChatDBG will _take the wheel_ and steer the debugger to answer your queries. ChatDBG can provide error diagnoses and suggest fixes. As far as we are aware, ChatDBG is the _first_ debugger to automatically perform root cause analysis and to provide suggested fixes.
README:
by Emery Berger, Stephen Freund, Kyla Levin, Nicolas van Kempen (ordered alphabetically)
ChatDBG is an AI-based debugging assistant for C/C++/Python/Rust code that integrates large language models into a standard debugger (pdb, lldb, gdb, and windbg) to help debug your code. With ChatDBG, you can engage in a dialog with your debugger, asking open-ended questions about your program, like why is x null?. ChatDBG will take the wheel and steer the debugger to answer your queries. ChatDBG can provide error diagnoses and suggest fixes.
As far as we are aware, ChatDBG is the first debugger to automatically perform root cause analysis and to provide suggested fixes.
Watch ChatDBG in action!
| LLDB on test-overflow.cpp | GDB on test-overflow.cpp | Pdb on bootstrap.py |
|---|---|---|
 |
 |
 |
For technical details and a complete evaluation, see our arXiv paper, ChatDBG: An AI-Powered Debugging Assistant (PDF).
[!NOTE]
ChatDBG for
pdb,lldb, andgdbare feature-complete; we are currently backporting features for these debuggers into the other debuggers.
[!IMPORTANT]
ChatDBG currently needs to be connected to an OpenAI account. Your account will need to have a positive balance for this to work (check your balance). If you have never purchased credits, you will need to purchase at least $1 in credits (if your API account was created before August 13, 2023) or $0.50 (if you have a newer API account) in order to have access to GPT-4, which ChatDBG uses. Get a key here.
Once you have an API key, set it as an environment variable called
OPENAI_API_KEY.export OPENAI_API_KEY=<your-api-key>
Install ChatDBG using pip (you need to do this whether you are debugging Python, C, or C++ code):
python3 -m pip install chatdbgIf you are using ChatDBG to debug Python programs, you are done. If you want to use ChatDBG to debug native code with gdb or lldb, follow the installation instructions below.
lldb installation instructions
Install ChatDBG into the lldb debugger by running the following command:
python3 -m pip install ChatDBG
python3 -c 'import chatdbg; print(f"command script import {chatdbg.__path__[0]}/chatdbg_lldb.py")' >> ~/.lldbinit
If you encounter an error, you may be using an older version of LLVM. Update to the latest version as follows:
sudo apt install -y lsb-release wget software-properties-common gnupg
curl -sSf https://apt.llvm.org/llvm.sh | sudo bash -s -- 18 all
# LLDB now available as `lldb-18`.
xcrun python3 -m pip install ChatDBG
xcrun python3 -c 'import chatdbg; print(f"command script import {chatdbg.__path__[0]}/chatdbg_lldb.py")' >> ~/.lldbinit
This will install ChatDBG as an LLVM extension.
gdb installation instructions
Install ChatDBG into the gdb debugger by running the following command:
python3 -m pip install ChatDBG
python3 -c 'import chatdbg; print(f"source {chatdbg.__path__[0]}/chatdbg_gdb.py")' >> ~/.gdbinit
This will install ChatDBG as a GDB extension.
WinDBG installation instructions
-
Install WinDBG: Follow instructions here if
WinDBGis not installed already. -
Install
vcpkg: Follow instructions here ifvcpkgis not installed already. -
Install Debugging Tools for Windows: Install the Windows SDK here and check the box
Debugging Tools for Windows. -
Navigate to the
src\chatdbgdirectory:cd src\chatdbg -
Install needed dependencies: Run
vcpkg install -
Build the chatdbg.dll extension: Run
mkdir build & cd build & cmake .. & cmake --build . & cd ..
Using ChatDBG:
- Load into WinDBGX:
- Run
windbgx your_executable_here.exe - Click the menu items
View->Command browser - Type
.load debug\chatdbg.dll
- Run
- After running code and hitting an exception / signal:
- Type
!whyin Command browser
- Type
To use ChatDBG to debug Python programs, simply run your Python script as follows:
chatdbg -c continue yourscript.pyChatDBG is an extension of the standard Python debugger pdb. Like
pdb, when your script encounters an uncaught exception, ChatDBG will
enter post mortem debugging mode.
Unlike other debuggers, you can then use the why command to ask
ChatDBG why your program failed and get a suggested fix. After the LLM responds,
you may issue additional debugging commands or continue the conversation by entering
any other text.
To use ChatDBG as the default debugger for IPython or inside Jupyter Notebooks, create a IPython profile and then add the necessary exensions on startup. (Modify these lines as necessary if you already have a customized profile file.)
ipython profile create
echo "c.InteractiveShellApp.extensions = ['chatdbg.chatdbg_pdb', 'ipyflow']" >> ~/.ipython/profile_default/ipython_config.py
On the command line, you can then run:
ipython --pdb yourscript.pyInside Jupyter, run your notebook with the ipyflow kernel and include this line magic at the top of the file.
%pdb
To use ChatDBG with lldb or gdb, just run native code (compiled with -g for debugging symbols) with your choice of debugger; when it crashes, ask why. This also works for post mortem debugging (when you load a core with the -c option).
The native debuggers work slightly differently than Pdb. After the debugger responds to your question, you will enter into ChatDBG's command loop, as indicated by the (ChatDBG chatting) prompt. You may continue issuing debugging commands and you may send additional messages to the LLM by starting those messages with "chat". When you are done, type quit to return to the debugger's main command loop.
Debugging Rust programs
To use ChatDBG with Rust, you need to do two steps: modify your
Cargo.toml file and add one line to your source program.
- Add this to your
Cargo.tomlfile:
[dependencies]
chatdbg = "0.6.2"

[profile.dev]
panic = "abort"

[profile.release]
panic = "abort"- In your program, apply the
#[chatdbg::main]attribute to yourmainfunction:
#[chatdbg::main]
fn main() {
Now you can debug your Rust code with gdb or lldb.
ChatDBG example in lldb
(ChatDBG lldb) run
Process 85494 launched: '/Users/emery/git/ChatDBG/test/a.out' (arm64)
TEST 1
TEST -422761288
TEST 0
TEST 0
TEST 0
TEST 0
TEST 0
TEST 0
Process 85494 stopped
* thread #1, queue = 'com.apple.main-thread', stop reason = EXC_BAD_ACCESS (code=1, address=0x100056200)
    frame #0: 0x0000000100002f64 a.out`foo(n=8, b=1) at test.cpp:7:22
   4     int x[] = { 1, 2, 3, 4, 5 };
   5
   6     void foo(int n, float b) {
-> 7       cout << "TEST " << x[n * 10000] << endl;
   8     }
   9
   10    int main()
Target 0: (a.out) stopped.
Ask why to have ChatDBG provide a helpful explanation why this program failed, and suggest a fix:
(ChatDBG lldb) why
The root cause of this error is accessing an index of the array `x`
that is out of bounds. In `foo()`, the index is calculated as `n *
10000`, which can be much larger than the size of the array `x` (which
is only 5 elements). In the given trace, the program is trying to
access the memory address `0x100056200`, which is outside of the range
of allocated memory for the array `x`.

To fix this error, we need to ensure that the index is within the
bounds of the array. One way to do this is to check the value of `n`
before calculating the index, and ensure that it is less than the size
of the array divided by the size of the element. For example, we can
modify `foo()` as follows:

    ```
    void foo(int n, float b) {
      if (n < 0 || n >= sizeof(x)/sizeof(x[0])) {
        cout << "ERROR: Invalid index" << endl;
        return;
      }
      cout << "TEST " << x[n] << endl;
    }
    ```

This code checks if `n` is within the valid range, and prints an error
message if it is not. If `n` is within the range, the function prints
the value of the element at index `n` of `x`. With this modification,
the program will avoid accessing memory outside the bounds of the
array, and will print the expected output for valid indices.
ChatDBG example in Python (pdb)
Traceback (most recent call last):
  File "yourscript.py", line 9, in <module>
    print(tryme(100))
  File "yourscript.py", line 4, in tryme
    if x / i > 2:
ZeroDivisionError: division by zero
Uncaught exception. Entering post mortem debugging
Running 'cont' or 'step' will restart the program
> yourscript.py(4)tryme()
-> if x / i > 2:
Ask why to have ChatDBG provide a helpful explanation why this program failed, and suggest a fix:
(ChatDBG Pdb) why
The root cause of the error is that the code is attempting to
divide by zero in the line "if x / i > 2". As i ranges from 0 to 99,
it will eventually reach the value of 0, causing a ZeroDivisionError.

A possible fix for this would be to add a check for i being equal to
zero before performing the division. This could be done by adding an
additional conditional statement, such as "if i == 0: continue", to
skip over the iteration when i is zero. The updated code would look
like this:

def tryme(x):
    count = 0
    for i in range(100):
        if i == 0:
            continue
        if x / i > 2:
            count += 1
    return count

if __name__ == '__main__':
    print(tryme(100))
For Tasks:
Click tags to check more tools for each tasksFor Jobs:
Alternative AI tools for ChatDBG
Similar Open Source Tools

ChatDBG
ChatDBG is an AI-based debugging assistant for C/C++/Python/Rust code that integrates large language models into a standard debugger (`pdb`, `lldb`, `gdb`, and `windbg`) to help debug your code. With ChatDBG, you can engage in a dialog with your debugger, asking open-ended questions about your program, like `why is x null?`. ChatDBG will _take the wheel_ and steer the debugger to answer your queries. ChatDBG can provide error diagnoses and suggest fixes. As far as we are aware, ChatDBG is the _first_ debugger to automatically perform root cause analysis and to provide suggested fixes.
shell-pilot
Shell-pilot is a simple, lightweight shell script designed to interact with various AI models such as OpenAI, Ollama, Mistral AI, LocalAI, ZhipuAI, Anthropic, Moonshot, and Novita AI from the terminal. It enhances intelligent system management without any dependencies, offering features like setting up a local LLM repository, using official models and APIs, viewing history and session persistence, passing input prompts with pipe/redirector, listing available models, setting request parameters, generating and running commands in the terminal, easy configuration setup, system package version checking, and managing system aliases.
python-tgpt
Python-tgpt is a Python package that enables seamless interaction with over 45 free LLM providers without requiring an API key. It also provides image generation capabilities. The name _python-tgpt_ draws inspiration from its parent project tgpt, which operates on Golang. Through this Python adaptation, users can effortlessly engage with a number of free LLMs available, fostering a smoother AI interaction experience.
k8sgpt
K8sGPT is a tool for scanning your Kubernetes clusters, diagnosing, and triaging issues in simple English. It has SRE experience codified into its analyzers and helps to pull out the most relevant information to enrich it with AI.
AirspeedVelocity.jl
AirspeedVelocity.jl is a tool designed to simplify benchmarking of Julia packages over their lifetime. It provides a CLI to generate benchmarks, compare commits/tags/branches, plot benchmarks, and run benchmark comparisons for every submitted PR as a GitHub action. The tool freezes the benchmark script at a specific revision to prevent old history from affecting benchmarks. Users can configure options using CLI flags and visualize benchmark results. AirspeedVelocity.jl can be used to benchmark any Julia package and offers features like generating tables and plots of benchmark results. It also supports custom benchmarks and can be integrated into GitHub actions for automated benchmarking of PRs.
llm-vscode
llm-vscode is an extension designed for all things LLM, utilizing llm-ls as its backend. It offers features such as code completion with 'ghost-text' suggestions, the ability to choose models for code generation via HTTP requests, ensuring prompt size fits within the context window, and code attribution checks. Users can configure the backend, suggestion behavior, keybindings, llm-ls settings, and tokenization options. Additionally, the extension supports testing models like Code Llama 13B, Phind/Phind-CodeLlama-34B-v2, and WizardLM/WizardCoder-Python-34B-V1.0. Development involves cloning llm-ls, building it, and setting up the llm-vscode extension for use.
fish-ai
fish-ai is a tool that adds AI functionality to Fish shell. It can be integrated with various AI providers like OpenAI, Azure OpenAI, Google, Hugging Face, Mistral, or a self-hosted LLM. Users can transform comments into commands, autocomplete commands, and suggest fixes. The tool allows customization through configuration files and supports switching between contexts. Data privacy is maintained by redacting sensitive information before submission to the AI models. Development features include debug logging, testing, and creating releases.
minja
Minja is a minimalistic C++ Jinja templating engine designed specifically for integration with C++ LLM projects, such as llama.cpp or gemma.cpp. It is not a general-purpose tool but focuses on providing a limited set of filters, tests, and language features tailored for chat templates. The library is header-only, requires C++17, and depends only on nlohmann::json. Minja aims to keep the codebase small, easy to understand, and offers decent performance compared to Python. Users should be cautious when using Minja due to potential security risks, and it is not intended for producing HTML or JavaScript output.
bilingual_book_maker
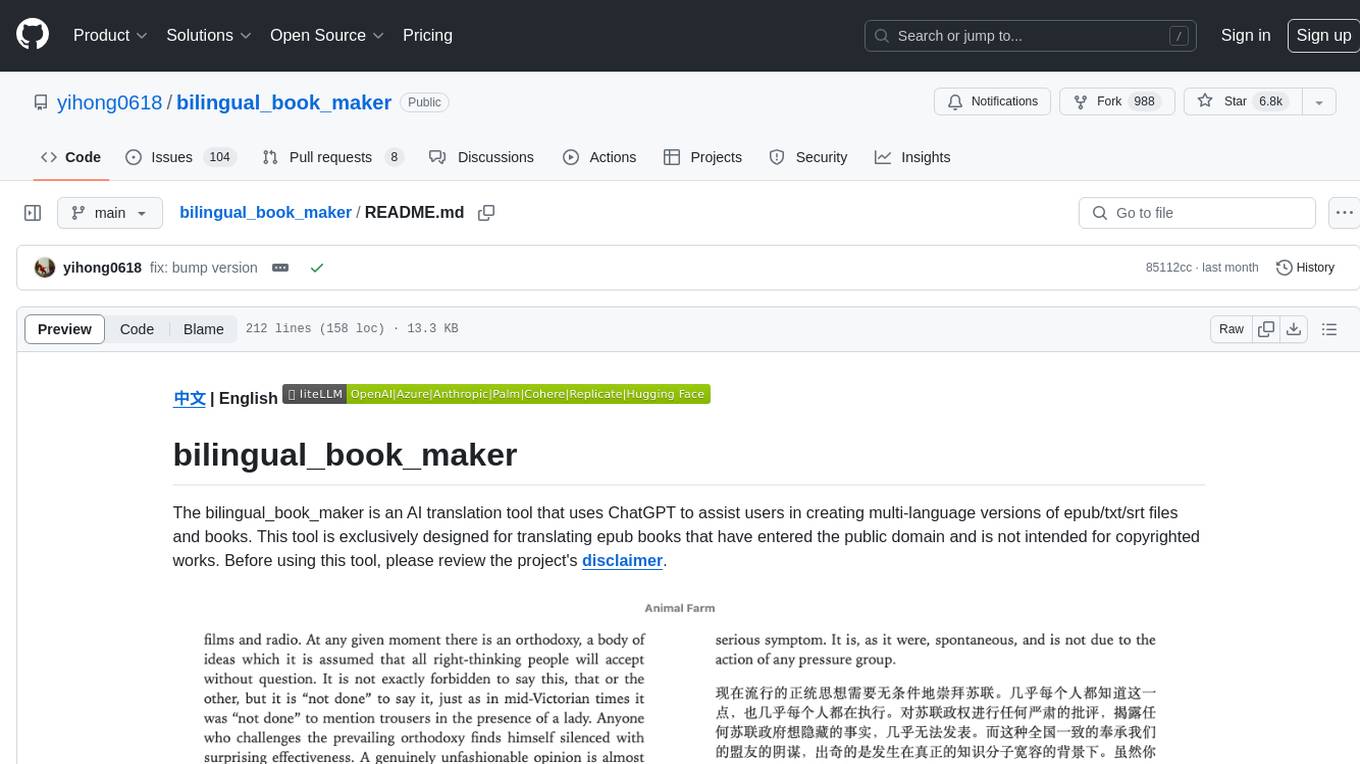
The bilingual_book_maker is an AI translation tool that uses ChatGPT to assist users in creating multi-language versions of epub/txt/srt files and books. It supports various models like gpt-4, gpt-3.5-turbo, claude-2, palm, llama-2, azure-openai, command-nightly, and gemini. Users need ChatGPT or OpenAI token, epub/txt books, internet access, and Python 3.8+. The tool provides options to specify OpenAI API key, model selection, target language, proxy server, context addition, translation style, and more. It generates bilingual books in epub format after translation. Users can test translations, set batch size, tweak prompts, and use different models like DeepL, Google Gemini, Tencent TranSmart, and more. The tool also supports retranslation, translating specific tags, and e-reader type specification. Docker usage is available for easy setup.
ChatSim
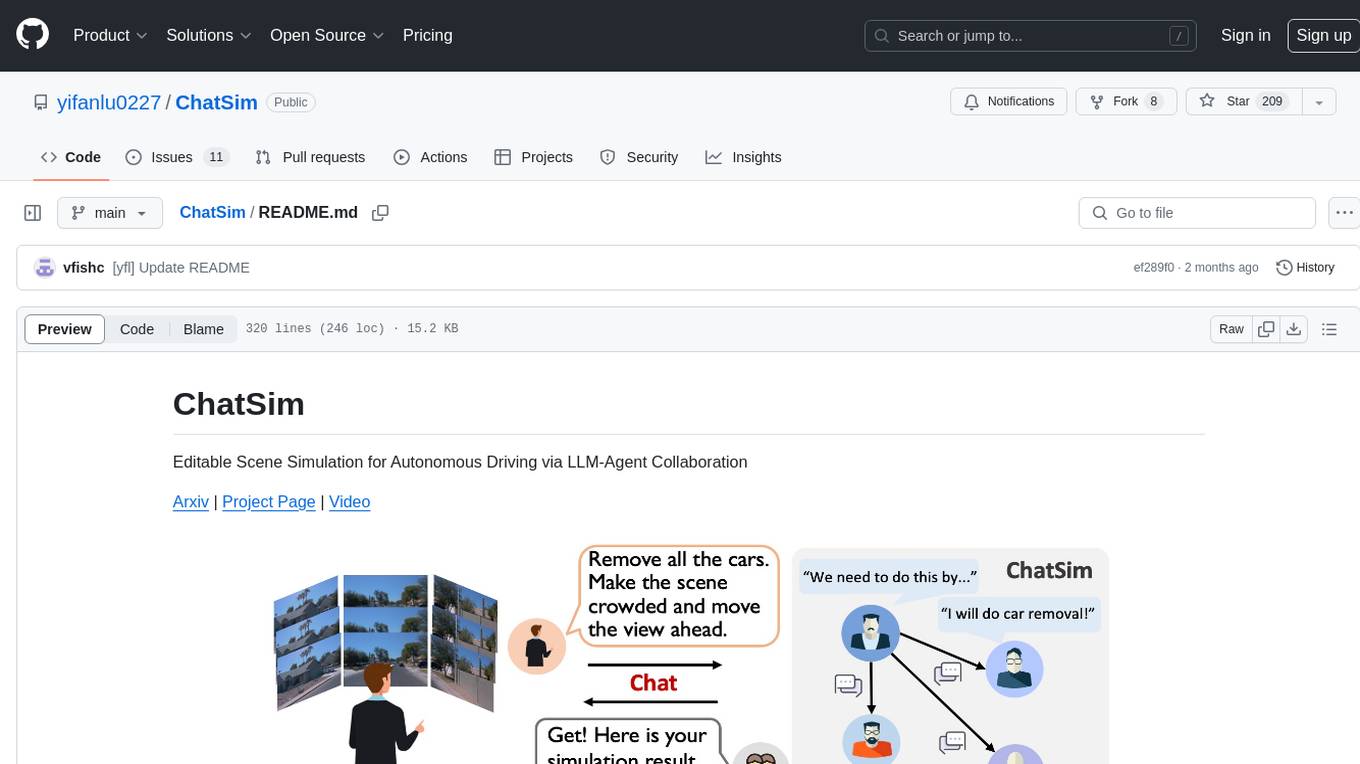
ChatSim is a tool designed for editable scene simulation for autonomous driving via LLM-Agent collaboration. It provides functionalities for setting up the environment, installing necessary dependencies like McNeRF and Inpainting tools, and preparing data for simulation. Users can train models, simulate scenes, and track trajectories for smoother and more realistic results. The tool integrates with Blender software and offers options for training McNeRF models and McLight's skydome estimation network. It also includes a trajectory tracking module for improved trajectory tracking. ChatSim aims to facilitate the simulation of autonomous driving scenarios with collaborative LLM-Agents.
mods
AI for the command line, built for pipelines. LLM based AI is really good at interpreting the output of commands and returning the results in CLI friendly text formats like Markdown. Mods is a simple tool that makes it super easy to use AI on the command line and in your pipelines. Mods works with OpenAI, Groq, Azure OpenAI, and LocalAI To get started, install Mods and check out some of the examples below. Since Mods has built-in Markdown formatting, you may also want to grab Glow to give the output some _pizzazz_.
neocodeium
NeoCodeium is a free AI completion plugin powered by Codeium, designed for Neovim users. It aims to provide a smoother experience by eliminating flickering suggestions and allowing for repeatable completions using the `.` key. The plugin offers performance improvements through cache techniques, displays suggestion count labels, and supports Lua scripting. Users can customize keymaps, manage suggestions, and interact with the AI chat feature. NeoCodeium enhances code completion in Neovim, making it a valuable tool for developers seeking efficient coding assistance.
codespin
CodeSpin.AI is a set of open-source code generation tools that leverage large language models (LLMs) to automate coding tasks. With CodeSpin, you can generate code in various programming languages, including Python, JavaScript, Java, and C++, by providing natural language prompts. CodeSpin offers a range of features to enhance code generation, such as custom templates, inline prompting, and the ability to use ChatGPT as an alternative to API keys. Additionally, CodeSpin provides options for regenerating code, executing code in prompt files, and piping data into the LLM for processing. By utilizing CodeSpin, developers can save time and effort in coding tasks, improve code quality, and explore new possibilities in code generation.
yarepl.nvim
Yet Another REPL is a flexible REPL / TUI App management tool that supports multiple paradigms for interacting with TUI Apps. This plugin allows users to effortlessly interact with multiple TUI Apps through various paradigms, such as sending text from multiple buffers to a single TUI App, sending text from a single buffer to multiple TUI Apps, and attaching a buffer to a dedicated TUI App. It features integration with aider.chat and OpenAI Codex CLI, as well as provides code cell text object definitions. Users can choose their preferred fuzzy finder among telescope, fzf-lua, or Snacks.picker to preview active REPLs. The plugin also supports project-level REPLs and creating persistent REPLs in tmux.
APIMyLlama
APIMyLlama is a server application that provides an interface to interact with the Ollama API, a powerful AI tool to run LLMs. It allows users to easily distribute API keys to create amazing things. The tool offers commands to generate, list, remove, add, change, activate, deactivate, and manage API keys, as well as functionalities to work with webhooks, set rate limits, and get detailed information about API keys. Users can install APIMyLlama packages with NPM, PIP, Jitpack Repo+Gradle or Maven, or from the Crates Repository. The tool supports Node.JS, Python, Java, and Rust for generating responses from the API. Additionally, it provides built-in health checking commands for monitoring API health status.
aiosmtpd
aiosmtpd is an asyncio-based SMTP server implementation that provides a modern and efficient way to handle SMTP and LMTP protocols in Python 3. It replaces the outdated asyncore and asynchat modules with asyncio for improved asynchronous I/O operations. The project aims to offer a more user-friendly, extendable, and maintainable solution for handling email protocols in Python applications. It is actively maintained by experienced Python developers and offers full documentation for easy integration and usage.
For similar tasks
lollms-webui
LoLLMs WebUI (Lord of Large Language Multimodal Systems: One tool to rule them all) is a user-friendly interface to access and utilize various LLM (Large Language Models) and other AI models for a wide range of tasks. With over 500 AI expert conditionings across diverse domains and more than 2500 fine tuned models over multiple domains, LoLLMs WebUI provides an immediate resource for any problem, from car repair to coding assistance, legal matters, medical diagnosis, entertainment, and more. The easy-to-use UI with light and dark mode options, integration with GitHub repository, support for different personalities, and features like thumb up/down rating, copy, edit, and remove messages, local database storage, search, export, and delete multiple discussions, make LoLLMs WebUI a powerful and versatile tool.
continue
Continue is an open-source autopilot for VS Code and JetBrains that allows you to code with any LLM. With Continue, you can ask coding questions, edit code in natural language, generate files from scratch, and more. Continue is easy to use and can help you save time and improve your coding skills.
anterion
Anterion is an open-source AI software engineer that extends the capabilities of `SWE-agent` to plan and execute open-ended engineering tasks, with a frontend inspired by `OpenDevin`. It is designed to help users fix bugs and prototype ideas with ease. Anterion is equipped with easy deployment and a user-friendly interface, making it accessible to users of all skill levels.
sglang
SGLang is a structured generation language designed for large language models (LLMs). It makes your interaction with LLMs faster and more controllable by co-designing the frontend language and the runtime system. The core features of SGLang include: - **A Flexible Front-End Language**: This allows for easy programming of LLM applications with multiple chained generation calls, advanced prompting techniques, control flow, multiple modalities, parallelism, and external interaction. - **A High-Performance Runtime with RadixAttention**: This feature significantly accelerates the execution of complex LLM programs by automatic KV cache reuse across multiple calls. It also supports other common techniques like continuous batching and tensor parallelism.

ChatDBG
ChatDBG is an AI-based debugging assistant for C/C++/Python/Rust code that integrates large language models into a standard debugger (`pdb`, `lldb`, `gdb`, and `windbg`) to help debug your code. With ChatDBG, you can engage in a dialog with your debugger, asking open-ended questions about your program, like `why is x null?`. ChatDBG will _take the wheel_ and steer the debugger to answer your queries. ChatDBG can provide error diagnoses and suggest fixes. As far as we are aware, ChatDBG is the _first_ debugger to automatically perform root cause analysis and to provide suggested fixes.
aider
Aider is a command-line tool that lets you pair program with GPT-3.5/GPT-4 to edit code stored in your local git repository. Aider will directly edit the code in your local source files and git commit the changes with sensible commit messages. You can start a new project or work with an existing git repo. Aider is unique in that it lets you ask for changes to pre-existing, larger codebases.
chatgpt-web
ChatGPT Web is a web application that provides access to the ChatGPT API. It offers two non-official methods to interact with ChatGPT: through the ChatGPTAPI (using the `gpt-3.5-turbo-0301` model) or through the ChatGPTUnofficialProxyAPI (using a web access token). The ChatGPTAPI method is more reliable but requires an OpenAI API key, while the ChatGPTUnofficialProxyAPI method is free but less reliable. The application includes features such as user registration and login, synchronization of conversation history, customization of API keys and sensitive words, and management of users and keys. It also provides a user interface for interacting with ChatGPT and supports multiple languages and themes.
For similar jobs
weave
Weave is a toolkit for developing Generative AI applications, built by Weights & Biases. With Weave, you can log and debug language model inputs, outputs, and traces; build rigorous, apples-to-apples evaluations for language model use cases; and organize all the information generated across the LLM workflow, from experimentation to evaluations to production. Weave aims to bring rigor, best-practices, and composability to the inherently experimental process of developing Generative AI software, without introducing cognitive overhead.
agentcloud
AgentCloud is an open-source platform that enables companies to build and deploy private LLM chat apps, empowering teams to securely interact with their data. It comprises three main components: Agent Backend, Webapp, and Vector Proxy. To run this project locally, clone the repository, install Docker, and start the services. The project is licensed under the GNU Affero General Public License, version 3 only. Contributions and feedback are welcome from the community.
oss-fuzz-gen
This framework generates fuzz targets for real-world `C`/`C++` projects with various Large Language Models (LLM) and benchmarks them via the `OSS-Fuzz` platform. It manages to successfully leverage LLMs to generate valid fuzz targets (which generate non-zero coverage increase) for 160 C/C++ projects. The maximum line coverage increase is 29% from the existing human-written targets.
LLMStack
LLMStack is a no-code platform for building generative AI agents, workflows, and chatbots. It allows users to connect their own data, internal tools, and GPT-powered models without any coding experience. LLMStack can be deployed to the cloud or on-premise and can be accessed via HTTP API or triggered from Slack or Discord.

VisionCraft
The VisionCraft API is a free API for using over 100 different AI models. From images to sound.
kaito
Kaito is an operator that automates the AI/ML inference model deployment in a Kubernetes cluster. It manages large model files using container images, avoids tuning deployment parameters to fit GPU hardware by providing preset configurations, auto-provisions GPU nodes based on model requirements, and hosts large model images in the public Microsoft Container Registry (MCR) if the license allows. Using Kaito, the workflow of onboarding large AI inference models in Kubernetes is largely simplified.
PyRIT
PyRIT is an open access automation framework designed to empower security professionals and ML engineers to red team foundation models and their applications. It automates AI Red Teaming tasks to allow operators to focus on more complicated and time-consuming tasks and can also identify security harms such as misuse (e.g., malware generation, jailbreaking), and privacy harms (e.g., identity theft). The goal is to allow researchers to have a baseline of how well their model and entire inference pipeline is doing against different harm categories and to be able to compare that baseline to future iterations of their model. This allows them to have empirical data on how well their model is doing today, and detect any degradation of performance based on future improvements.
Azure-Analytics-and-AI-Engagement
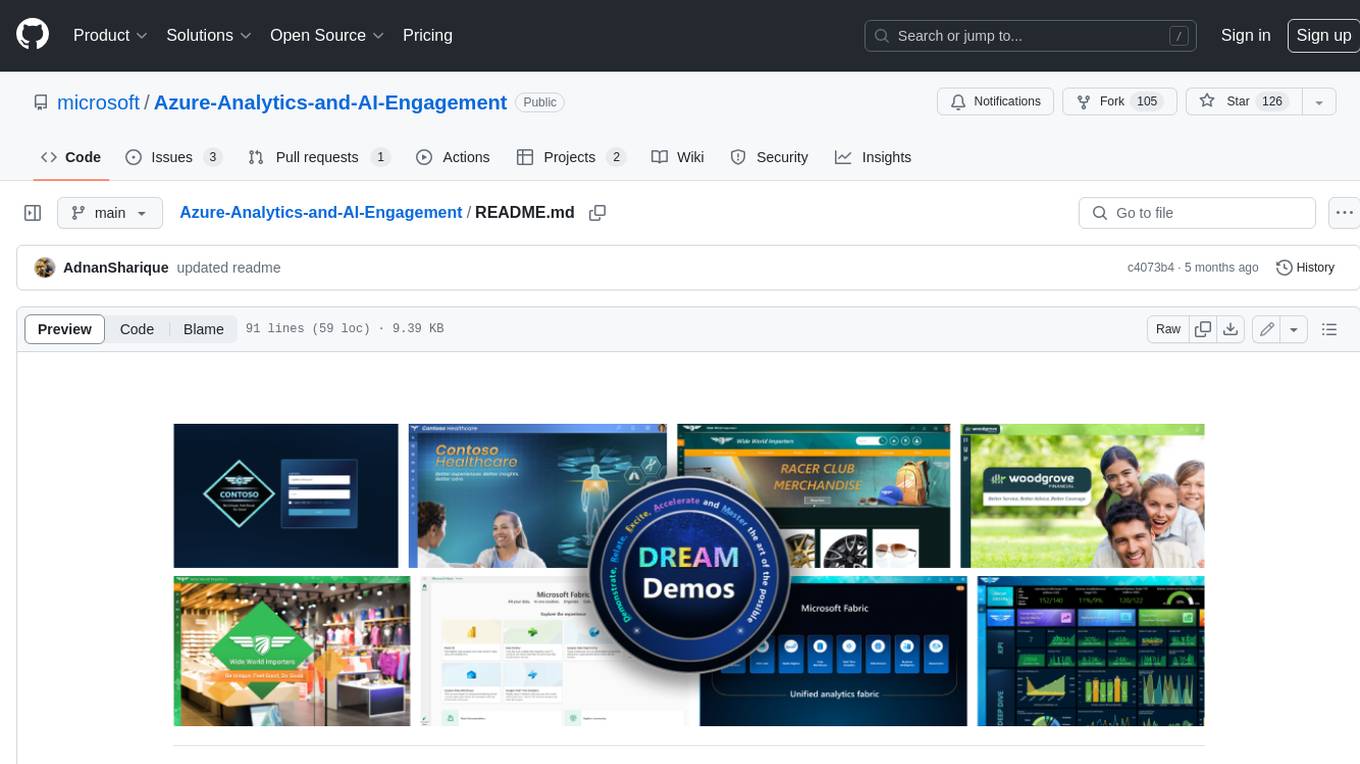
The Azure-Analytics-and-AI-Engagement repository provides packaged Industry Scenario DREAM Demos with ARM templates (Containing a demo web application, Power BI reports, Synapse resources, AML Notebooks etc.) that can be deployed in a customer’s subscription using the CAPE tool within a matter of few hours. Partners can also deploy DREAM Demos in their own subscriptions using DPoC.


