
netdata
The fastest path to AI-powered full stack observability, even for lean teams.
Stars: 77824
Netdata is an open-source, real-time infrastructure monitoring platform that provides instant insights, zero configuration deployment, ML-powered anomaly detection, efficient monitoring with minimal resource usage, and secure & distributed data storage. It offers real-time, per-second updates and clear insights at a glance. Netdata's origin story involves addressing the limitations of existing monitoring tools and led to a fundamental shift in infrastructure monitoring. It is recognized as the most energy-efficient tool for monitoring Docker-based systems according to a study by the University of Amsterdam.
README:
Visit our Home Page
MENU: WHO WE ARE | KEY FEATURES | GETTING STARTED | HOW IT WORKS | FAQ | DOCS | COMMUNITY | CONTRIBUTE | LICENSE
[!WARNING] People get addicted to Netdata. Once you use it on your systems, there's no going back.
Netdata is an open-source, real-time infrastructure monitoring platform. Monitor, detect, and act across your entire infrastructure.
Core Advantages:
- Instant Insights – With Netdata you can access per-second metrics and visualizations.
- Zero Configuration – You can deploy immediately without complex setup.
- ML-Powered – You can detect anomalies, predict issues, and automate analysis.
- Efficient – You can monitor with minimal resource usage and maximum scalability.
- Secure & Distributed – You can keep your data local with no central collection needed.
With Netdata, you get real-time, per-second updates. Clear insights at a glance, no complexity.
All heroes have a great origin story. Click to discover ours.
In 2013, at the company where Costa Tsaousis was COO, a significant percentage of their cloud-based transactions failed silently, severely impacting business performance.
Costa and his team tried every troubleshooting tool available at the time. None could identify the root cause. As Costa later wrote:
“I couldn’t believe that monitoring systems provide so few metrics and with such low resolution, scale so badly, and cost so much to run.”
Frustrated, he decided to build his own monitoring tool, starting from scratch.
That decision led to countless late nights and weekends. It also sparked a fundamental shift in how infrastructure monitoring and troubleshooting are approached, both in method and in cost.
According to the University of Amsterdam study, Netdata is the most energy-efficient tool for monitoring Docker-based systems. The study also shows Netdata excels in CPU usage, RAM usage, and execution time compared to other monitoring solutions.
| Feature | Description | What Makes It Unique |
|---|---|---|
| Real-Time | Per-second data collection and processing | Works in a beat – click and see results instantly |
| Zero-Configuration | Automatic detection and discovery | Auto-discovers everything on the nodes it runs |
| ML-Powered | Unsupervised anomaly detection | Trains multiple ML models per metric at the edge |
| Long-Term Retention | High-performance storage | ~0.5 bytes per sample with tiered storage for archiving |
| Advanced Visualization | Rich, interactive dashboards | Slice and dice data without query language |
| Extreme Scalability | Native horizontal scaling | Parent-Child centralization with multi-million samples/s |
| Complete Visibility | From infrastructure to applications | Simplifies operations and eliminates silos |
| Edge-Based | Processing at your premises | Distributes code instead of centralizing data |
[!NOTE]
Want to put Netdata to the test against Prometheus? Explore the full comparison.
This three-part architecture enables you to scale from single nodes to complex multi-cloud environments:
| Component | Description | License |
|---|---|---|
| Netdata Agent | • Core monitoring engine • Handles collection, storage, ML, alerts, exports • Runs on servers, cloud, K8s, IoT • Zero production impact |
GPL v3+ |
| Netdata Cloud | • Enterprise features • User management, RBAC, horizontal scaling • Centralized alerts • Free community tier • No metric storage centralization |
|
| Netdata UI | • Dashboards and visualizations • Free to use • Included in standard packages • Latest version via CDN |
NCUL1 |
With Netdata you can monitor all these components across platforms:
| Component | Linux | FreeBSD | macOS | Windows |
|---|---|---|---|---|
|
System Resources CPU, Memory and system shared resources |
Full | Yes | Yes | Yes |
|
Storage Disks, Mount points, Filesystems, RAID arrays |
Full | Yes | Yes | Yes |
|
Network Network Interfaces, Protocols, Firewall, etc |
Full | Yes | Yes | Yes |
|
Hardware & Sensors Fans, Temperatures, Controllers, GPUs, etc |
Full | Some | Some | Some |
|
O/S Services Resources, Performance and Status |
Yessystemd
|
- | - | - |
|
Processes Resources, Performance, OOM, and more |
Yes | Yes | Yes | Yes |
| System and Application Logs | Yessystemd-journal
|
- | - | YesWindows Event Log, ETW
|
|
Network Connections Live TCP and UDP sockets per PID |
Yes | - | - | - |
|
Containers Docker/containerd, LXC/LXD, Kubernetes, etc |
Yes | - | - | - |
|
VMs (from the host) KVM, qemu, libvirt, Proxmox, etc |
Yescgroups
|
- | - | YesHyper-V
|
|
Synthetic Checks Test APIs, TCP ports, Ping, Certificates, etc |
Yes | Yes | Yes | Yes |
|
Packaged Applications nginx, apache, postgres, redis, mongodb, and hundreds more |
Yes | Yes | Yes | Yes |
|
Cloud Provider Infrastructure AWS, GCP, Azure, and more |
Yes | Yes | Yes | Yes |
|
Custom Applications OpenMetrics, StatsD and soon OpenTelemetry |
Yes | Yes | Yes | Yes |
On Linux, you can continuously monitor all kernel features and hardware sensors for errors, including Intel/AMD/Nvidia GPUs, PCI AER, RAM EDAC, IPMI, S.M.A.R.T, Intel RAPL, NVMe, fans, power supplies, and voltage readings.
You can install Netdata on all major operating systems. To begin:
Choose your platform and follow the installation guide:
[!NOTE] You can access the Netdata UI at
http://localhost:19999(orhttp://NODE:19999if remote).
Netdata auto-discovers most metrics, but you can manually configure some collectors:
You can use hundreds of built-in alerts and integrate with:
email, Slack, Telegram, PagerDuty, Discord, Microsoft Teams, and more.
[!NOTE]
Email alerts work by default if there's a configured MTA.
You can centralize dashboards, alerts, and storage with Netdata Parents:
[!NOTE]
You can use Netdata Parents for central dashboards, longer retention, and alert configuration.
Sign in to Netdata Cloud and connect your nodes for:
- Access from anywhere
- Horizontal scalability and multi-node dashboards
- UI configuration for alerts and data collection
- Role-based access control
- Free tier available
[!NOTE]
Netdata Cloud is optional. Your data stays in your infrastructure.
See Netdata in action
FRANKFURT |
NEWYORK |
ATLANTA |
SANFRANCISCO |
TORONTO |
SINGAPORE |
BANGALORE
These demo clusters run with default configuration and show real monitoring data.
Choose the instance closest to you for the best performance.
With Netdata you can run a modular pipeline for metrics collection, processing, and visualization.
flowchart TB
  A[Netdata Agent]:::mainNode
  A1(Collect):::green --> A
  A2(Store):::green --> A
  A3(Learn):::green --> A
  A4(Detect):::green --> A
  A5(Check):::green --> A
  A6(Stream):::green --> A
  A7(Archive):::green --> A
  A8(Query):::green --> A
  A9(Score):::green --> A

  classDef green fill:#bbf3bb,stroke:#333,stroke-width:1px,color:#000
  classDef mainNode fill:#f0f0f0,stroke:#333,stroke-width:1px,color:#333
With each Agent you can:
- Collect – Gather metrics from systems, containers, apps, logs, APIs, and synthetic checks.
- Store – Save metrics to a high-efficiency, tiered time-series database.
- Learn – Train ML models per metric using recent behavior.
- Detect – Identify anomalies using trained ML models.
- Check – Evaluate metrics against pre-set or custom alert rules.
- Stream – Send metrics to Netdata Parents in real time.
- Archive – Export metrics to Prometheus, InfluxDB, OpenTSDB, Graphite, and others.
- Query – Access metrics via an API for dashboards or third-party tools.
- Score – Use a scoring engine to find patterns and correlations across metrics.
[!NOTE]
Learn more: Netdata's architecture
With the Netdata Agent, you can use these core capabilities out-of-the-box:
| Capability | Description |
|---|---|
| Comprehensive Collection | • 800+ integrations • Systems, containers, VMs, hardware sensors • OpenMetrics, StatsD, and logs • OpenTelemetry support coming soon |
| Performance & Precision | • Per-second collection • Real-time visualization with 1-second latency • High-resolution metrics |
| Edge-Based ML | • ML models trained at the edge • Automatic anomaly detection per metric • Pattern recognition based on historical behavior |
| Advanced Log Management | • Direct systemd-journald and Windows Event Log integration • Process logs at the edge • Rich log visualization |
| Observability Pipeline | • Parent-Child relationships • Flexible centralization • Multi-level replication and retention |
| Automated Visualization | • NIDL data model • Auto-generated dashboards • No query language needed |
| Smart Alerting | • Pre-configured alerts • Multiple notification methods • Proactive detection |
| Low Maintenance | • Auto-detection • Zero-touch ML • Easy scalability • CI/CD friendly |
| Open & Extensible | • Modular architecture • Easy to customize • Integrates with existing tools |
Netdata actively supports and is a member of the Cloud Native Computing Foundation (CNCF).
It is one of the most starred projects in the CNCF landscape.
Is Netdata secure?
Yes. Netdata follows OpenSSF best practices, has a security-first design, and is regularly audited by the community.
Does Netdata use a lot of resources?
No. Even with ML and per-second metrics, Netdata uses minimal resources.
- ~5% CPU and 150MiB RAM by default on production systems
- <1% CPU and ~100MiB RAM when ML and alerts are disabled and using ephemeral storage
- Parents scale to millions of metrics per second with appropriate hardware
You can use the Netdata Monitoring section in the dashboard to inspect its resource usage.
How much data retention is possible?
As much as your disk allows.
With Netdata you can use tiered retention:
- Tier 0: per-second resolution
- Tier 1: per-minute resolution
- Tier 2: per-hour resolution
These are queried automatically based on the zoom level.
Can Netdata scale to many servers?
Yes. With Netdata you can:
- Scale horizontally with many Agents
- Scale vertically with powerful Parents
- Scale infinitely via Netdata Cloud
You can use Netdata Cloud to merge many independent infrastructures into one logical view.
Is disk I/O a concern?
No. Netdata minimizes disk usage:
- Metrics are flushed to disk every 17 minutes, spread out evenly
- Uses direct I/O and compression (ZSTD)
- Can run entirely in RAM or stream to a Parent
You can use
allocorrammode for no disk writes.
How is Netdata different from Prometheus + Grafana?
With Netdata you get a complete monitoring solution—not just tools.
- No manual setup or dashboards needed
- Built-in ML, alerts, dashboards, and correlations
- More efficient and easier to deploy
How is Netdata different from commercial SaaS tools?
With Netdata you can store all metrics on your infrastructure—no sampling, no aggregation, no loss.
- High-resolution metrics by default
- ML per metric, not shared models
- Unlimited scalability without skyrocketing cost
Can Netdata run alongside Nagios, Zabbix, etc.?
Yes. You can use Netdata together with traditional tools.
With Netdata you get:
- Real-time, high-resolution monitoring
- Zero configuration and auto-generated dashboards
- Anomaly detection and advanced visualization
What if I feel overwhelmed?
You can start small:
- Use the dashboard's table of contents and search
- Explore anomaly scoring ("AR" toggle)
- Create custom dashboards in Netdata Cloud
Do I have to use Netdata Cloud?
No. Netdata Cloud is optional.
Netdata works without it, but with Cloud you can:
- Access remotely with SSO
- Save dashboard customizations
- Configure alerts centrally
- Collaborate with role-based access
What telemetry does Netdata collect?
Anonymous telemetry helps improve the product. You can disable it:
- Add
--disable-telemetryto the installer, or - Create
/etc/netdata/.opt-out-from-anonymous-statisticsand restart Netdata
Telemetry helps us understand usage, not track users. No private data is collected.
Who uses Netdata?
You'll join users including:
- Major companies (Amazon, ABN AMRO Bank, Facebook, Google, IBM, Intel, Netflix, Samsung)
- Universities (NYU, Columbia, Seoul National, UCL)
- Government organizations worldwide
- Infrastructure-intensive organizations
- Technology operators
- Startups and freelancers
- SysAdmins and DevOps professionals
Visit Netdata Learn for full documentation and guides.
[!NOTE]
Includes deployment, configuration, alerting, exporting, troubleshooting, and more.
Join the Netdata community:
[!NOTE]
Code of Conduct
Follow us on: Twitter | Reddit | YouTube | LinkedIn
We welcome your contributions.
Ways you help us stay sharp:
- Share best practices and monitoring insights
- Report issues or missing features
- Improve documentation
- Develop new integrations or collectors
- Help users in forums and chats
[!NOTE]
Contribution guide
The Netdata ecosystem includes:
- Netdata Agent – Open-source core (GPLv3+). Includes data collection, storage, ML, alerting, APIs and redistributes several other open-source tools and libraries.
- Netdata UI – Closed-source but free to use with Netdata Agent and Cloud. Delivered via CDN. It integrates third-party open-source components.
- Netdata Cloud – Closed-source, with free and paid tiers. Adds remote access, SSO, scalability.
For Tasks:
Click tags to check more tools for each tasksFor Jobs:
Alternative AI tools for netdata
Similar Open Source Tools

netdata
Netdata is an open-source, real-time infrastructure monitoring platform that provides instant insights, zero configuration deployment, ML-powered anomaly detection, efficient monitoring with minimal resource usage, and secure & distributed data storage. It offers real-time, per-second updates and clear insights at a glance. Netdata's origin story involves addressing the limitations of existing monitoring tools and led to a fundamental shift in infrastructure monitoring. It is recognized as the most energy-efficient tool for monitoring Docker-based systems according to a study by the University of Amsterdam.
BharatMLStack
BharatMLStack is a comprehensive, production-ready machine learning infrastructure platform designed to democratize ML capabilities across India and beyond. It provides a robust, scalable, and accessible ML stack empowering organizations to build, deploy, and manage machine learning solutions at massive scale. It includes core components like Horizon, Trufflebox UI, Online Feature Store, Go SDK, Python SDK, and Numerix, offering features such as control plane, ML management console, real-time features, mathematical compute engine, and more. The platform is production-ready, cloud agnostic, and offers observability through built-in monitoring and logging.
rhesis
Rhesis is a comprehensive test management platform designed for Gen AI teams, offering tools to create, manage, and execute test cases for generative AI applications. It ensures the robustness, reliability, and compliance of AI systems through features like test set management, automated test generation, edge case discovery, compliance validation, integration capabilities, and performance tracking. The platform is open source, emphasizing community-driven development, transparency, extensible architecture, and democratizing AI safety. It includes components such as backend services, frontend applications, SDK for developers, worker services, chatbot applications, and Polyphemus for uncensored LLM service. Rhesis enables users to address challenges unique to testing generative AI applications, such as non-deterministic outputs, hallucinations, edge cases, ethical concerns, and compliance requirements.
Pulse
Pulse is a real-time monitoring tool designed for Proxmox, Docker, and Kubernetes infrastructure. It provides a unified dashboard to consolidate metrics, alerts, and AI-powered insights into a single interface. Suitable for homelabs, sysadmins, and MSPs, Pulse offers core monitoring features, AI-powered functionalities, multi-platform support, security and operations features, and community integrations. Pulse Pro unlocks advanced AI analysis and auto-fix capabilities. The tool is privacy-focused, secure by design, and offers detailed documentation for installation, configuration, security, troubleshooting, and more.
learn-low-code-agentic-ai
This repository is dedicated to learning about Low-Code Full-Stack Agentic AI Development. It provides material for building modern AI-powered applications using a low-code full-stack approach. The main tools covered are UXPilot for UI/UX mockups, Lovable.dev for frontend applications, n8n for AI agents and workflows, Supabase for backend data storage, authentication, and vector search, and Model Context Protocol (MCP) for integration. The focus is on prompt and context engineering as the foundation for working with AI systems, enabling users to design, develop, and deploy AI-driven full-stack applications faster, smarter, and more reliably.
runtime
Exosphere is a lightweight runtime designed to make AI agents resilient to failure and enable infinite scaling across distributed compute. It provides a powerful foundation for building and orchestrating AI applications with features such as lightweight runtime, inbuilt failure handling, infinite parallel agents, dynamic execution graphs, native state persistence, and observability. Whether you're working on data pipelines, AI agents, or complex workflow orchestrations, Exosphere offers the infrastructure backbone to make your AI applications production-ready and scalable.
MemMachine
MemMachine is an open-source long-term memory layer designed for AI agents and LLM-powered applications. It enables AI to learn, store, and recall information from past sessions, transforming stateless chatbots into personalized, context-aware assistants. With capabilities like episodic memory, profile memory, working memory, and agent memory persistence, MemMachine offers a developer-friendly API, flexible storage options, and seamless integration with various AI frameworks. It is suitable for developers, researchers, and teams needing persistent, cross-session memory for their LLM applications.
AionUi
AionUi is a user interface library for building modern and responsive web applications. It provides a set of customizable components and styles to create visually appealing user interfaces. With AionUi, developers can easily design and implement interactive web interfaces that are both functional and aesthetically pleasing. The library is built using the latest web technologies and follows best practices for performance and accessibility. Whether you are working on a personal project or a professional application, AionUi can help you streamline the UI development process and deliver a seamless user experience.
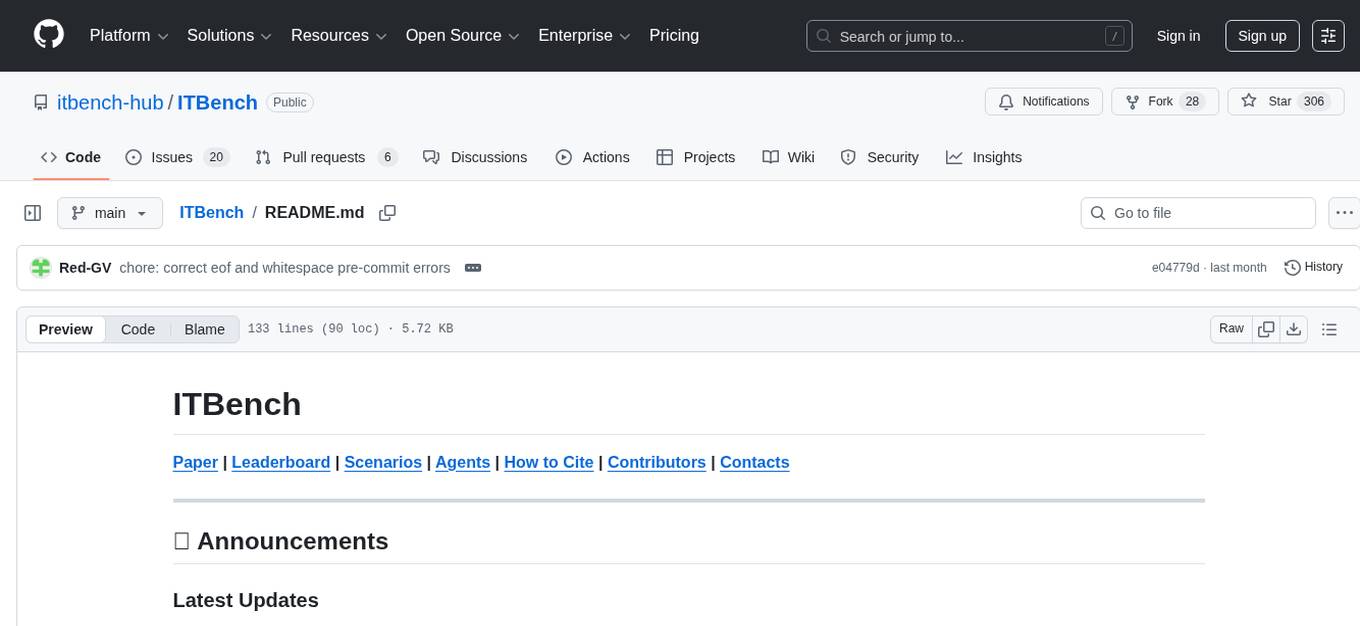
ITBench
ITBench is a platform designed to measure the performance of AI agents in complex and real-world inspired IT automation tasks. It focuses on three key use cases: Site Reliability Engineering (SRE), Compliance & Security Operations (CISO), and Financial Operations (FinOps). The platform provides a real-world representation of IT environments, open and extensible framework, push-button workflows, and Kubernetes-based scenario environments. Researchers and developers can replicate real-world incidents in Kubernetes environments, develop AI agents, and evaluate them using a fully-managed leaderboard.
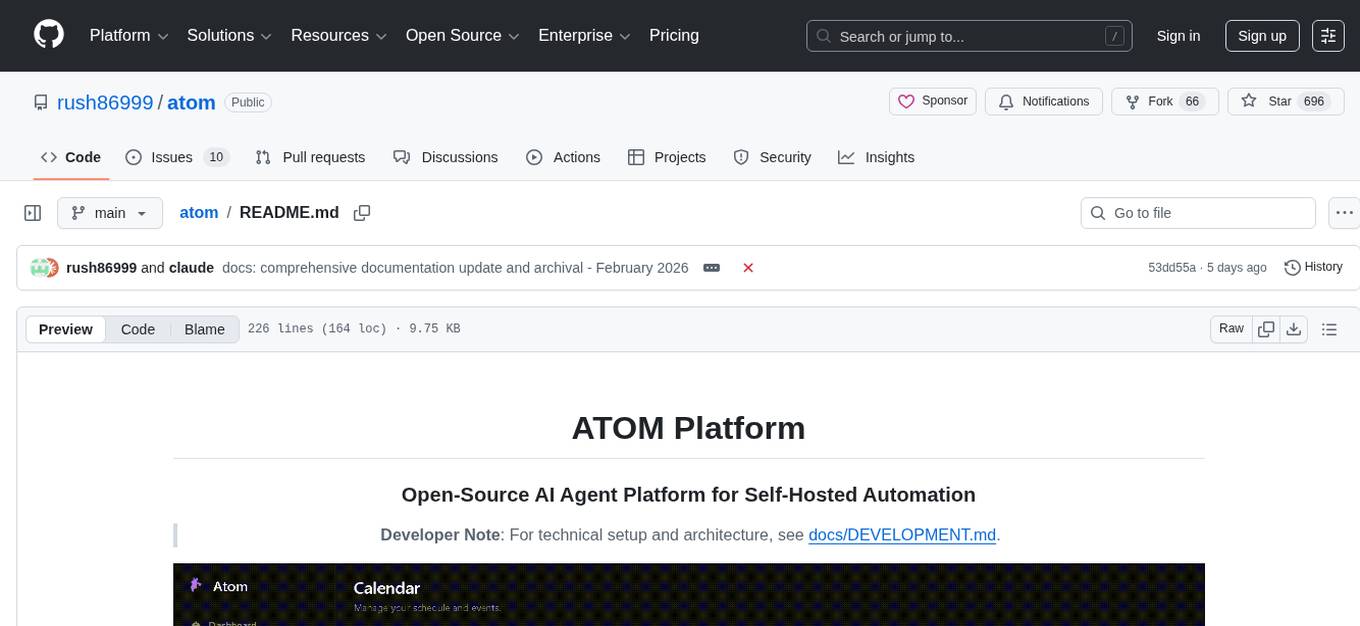
atom
Atom is an open-source, self-hosted AI agent platform that allows users to automate workflows by interacting with AI agents. Users can speak or type requests, and Atom's specialty agents can plan, verify, and execute complex workflows across various tech stacks. Unlike SaaS alternatives, Atom runs entirely on the user's infrastructure, ensuring data privacy. The platform offers features such as voice interface, specialty agents for sales, marketing, and engineering, browser and device automation, universal memory and context, agent governance system, deep integrations, dynamic skills, and more. Atom is designed for business automation, multi-agent workflows, and enterprise governance.
HacxGPT-CLI
HacxGPT-CLI is an open-source command-line interface designed to provide powerful, unrestricted, and seamless AI-driven conversations. It allows users to interact with multiple AI providers through a custom-built local API engine, offering features like powerful AI conversations, extensive model support, unrestricted framework, easy-to-use CLI, cross-platform compatibility, multi-provider support, configuration management, and local storage of API keys.
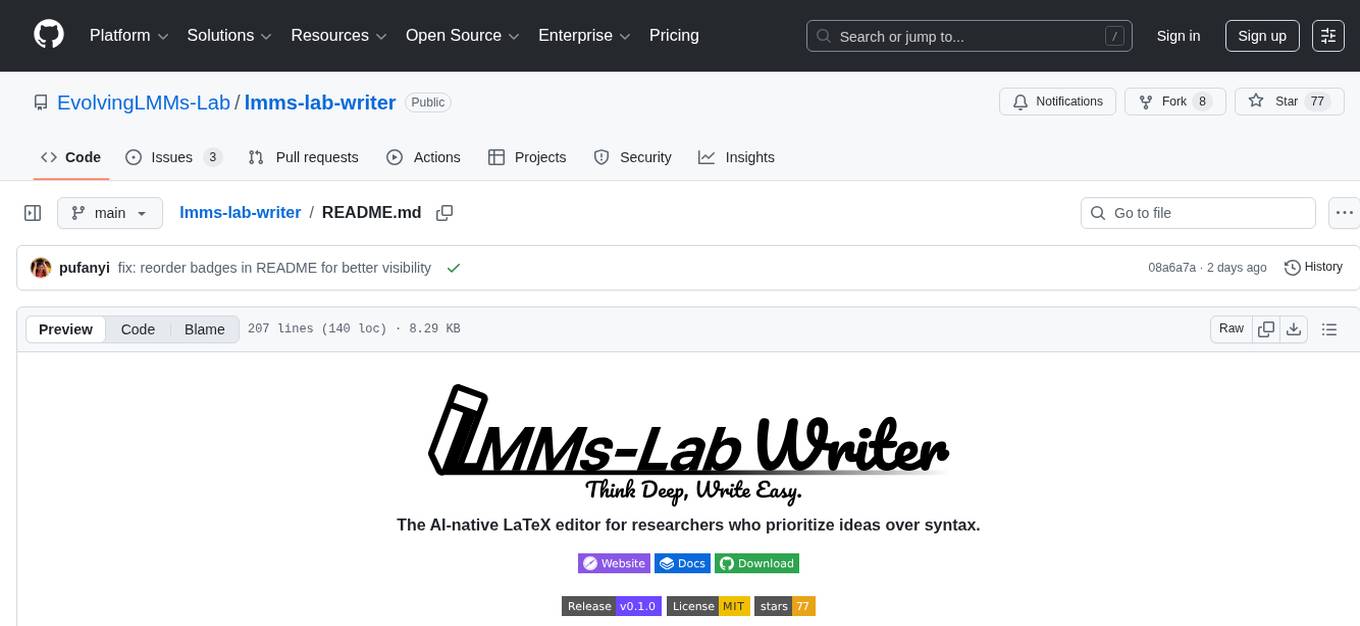
lmms-lab-writer
LMMs-Lab Writer is an AI-native LaTeX editor designed for researchers who prioritize ideas over syntax. It offers a local-first approach with AI agents for editing assistance, one-click LaTeX setup with automatic package installation, support for multiple languages, AI-powered workflows with OpenCode integration, Git integration for modern collaboration, fully open-source with MIT license, cross-platform compatibility, and a comparison with Overleaf highlighting its advantages. The tool aims to streamline the writing and publishing process for researchers while ensuring data security and control.
agentneo
AgentNeo is a Python package that provides functionalities for project, trace, dataset, experiment management. It allows users to authenticate, create projects, trace agents and LangGraph graphs, manage datasets, and run experiments with metrics. The tool aims to streamline AI project management and analysis by offering a comprehensive set of features.
claudia
Claudia is a personal AI assistant that tracks relationships and commitments, helping users remember important details and connections across their network. It catches commitments, remembers context, warns before things slip, and shows the source of information. Claudia syncs memory to an Obsidian vault, ensuring data privacy by running fully locally. Users can try a demo mode with pre-populated data or install Claudia for personalized workspace creation. It is suitable for roles like consultants, executives, founders, solo professionals, and creators, offering features like client folders, deliverable tracking, leadership tools, and collaboration tracking.
natively-cluely-ai-assistant
Natively is a free, open-source, privacy-first AI assistant designed to help users in real time during meetings, interviews, presentations, and conversations. Unlike traditional AI tools that work after the conversation, Natively operates while the conversation is happening. It runs as an invisible, always-on-top desktop overlay, listens when prompted, observes the screen content, and provides instant, context-aware assistance. The tool is fully transparent, customizable, and grants users complete control over local vs cloud AI, data, and credentials.

EpicStaff
EpicStaff is a powerful project management tool designed to streamline team collaboration and task management. It provides a user-friendly interface for creating and assigning tasks, tracking progress, and communicating with team members in real-time. With features such as task prioritization, deadline reminders, and file sharing capabilities, EpicStaff helps teams stay organized and productive. Whether you're working on a small project or managing a large team, EpicStaff is the perfect solution to keep everyone on the same page and ensure project success.
For similar tasks

netdata
Netdata is an open-source, real-time infrastructure monitoring platform that provides instant insights, zero configuration deployment, ML-powered anomaly detection, efficient monitoring with minimal resource usage, and secure & distributed data storage. It offers real-time, per-second updates and clear insights at a glance. Netdata's origin story involves addressing the limitations of existing monitoring tools and led to a fundamental shift in infrastructure monitoring. It is recognized as the most energy-efficient tool for monitoring Docker-based systems according to a study by the University of Amsterdam.
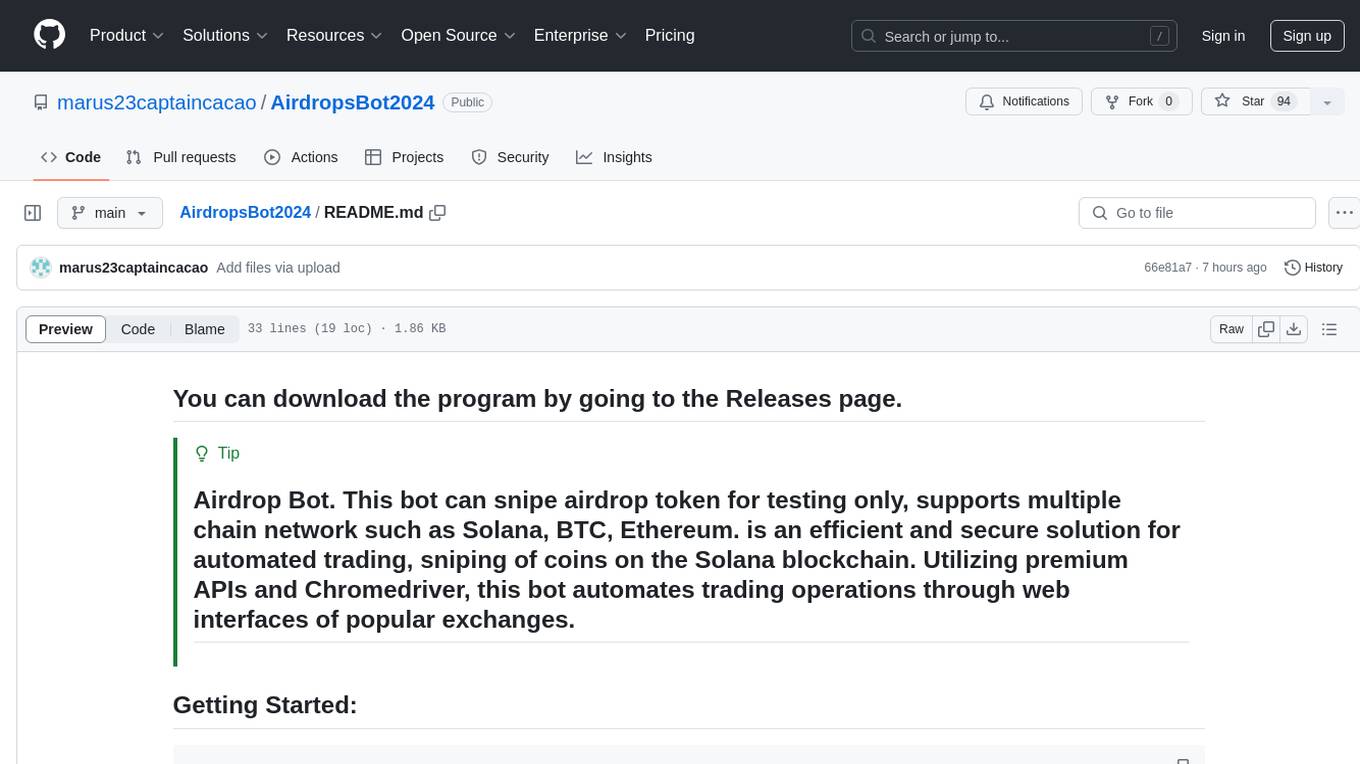
AirdropsBot2024
AirdropsBot2024 is an efficient and secure solution for automated trading and sniping of coins on the Solana blockchain. It supports multiple chain networks such as Solana, BTC, and Ethereum. The bot utilizes premium APIs and Chromedriver to automate trading operations through web interfaces of popular exchanges. It offers high-speed data analysis, in-depth market analysis, support for major exchanges, complete security and control, data visualization, advanced notification options, flexibility and adaptability in trading strategies, and profile management.
AirdropsBot2024
AirdropsBot2024 is an efficient and secure solution for automated trading and sniping of coins on the Solana blockchain. It supports multiple chain networks such as Solana, BTC, and Ethereum. The bot utilizes premium APIs and Chromedriver to automate trading operations through web interfaces of popular exchanges. It offers high-speed data analysis, in-depth market analysis, support for major exchanges, complete security and control, data visualization, advanced notification options, flexibility and adaptability in trading strategies, and profile management for saving and loading different trading strategies.
qdrant
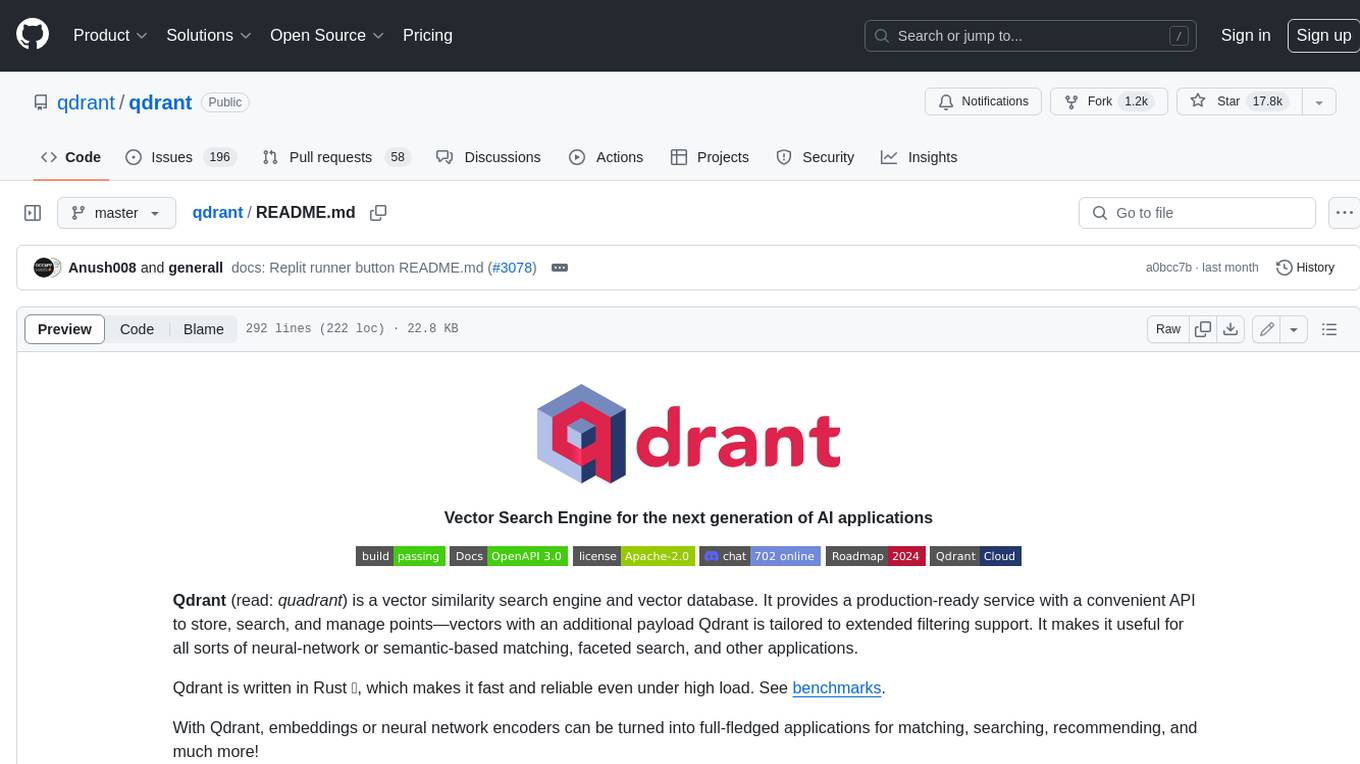
Qdrant is a vector similarity search engine and vector database. It is written in Rust, which makes it fast and reliable even under high load. Qdrant can be used for a variety of applications, including: * Semantic search * Image search * Product recommendations * Chatbots * Anomaly detection Qdrant offers a variety of features, including: * Payload storage and filtering * Hybrid search with sparse vectors * Vector quantization and on-disk storage * Distributed deployment * Highlighted features such as query planning, payload indexes, SIMD hardware acceleration, async I/O, and write-ahead logging Qdrant is available as a fully managed cloud service or as an open-source software that can be deployed on-premises.
SynapseML
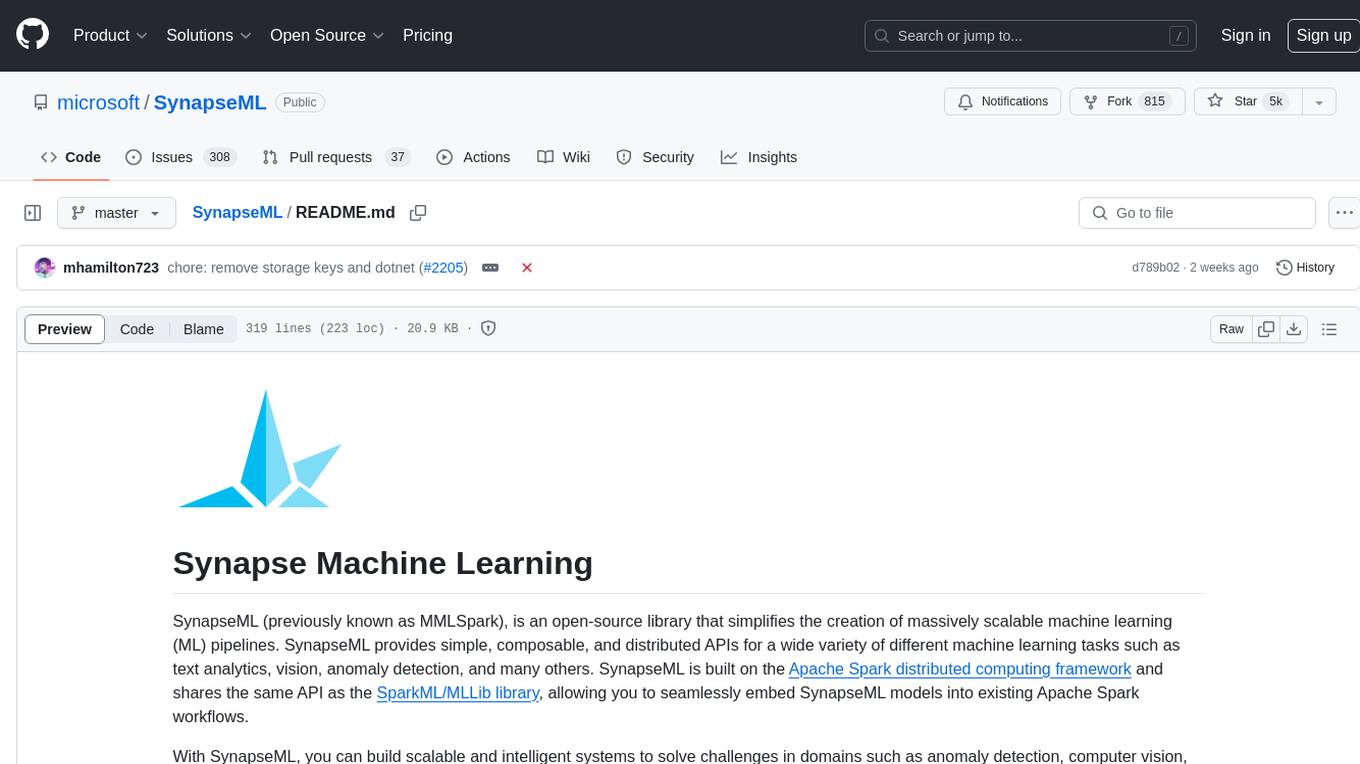
SynapseML (previously known as MMLSpark) is an open-source library that simplifies the creation of massively scalable machine learning (ML) pipelines. It provides simple, composable, and distributed APIs for various machine learning tasks such as text analytics, vision, anomaly detection, and more. Built on Apache Spark, SynapseML allows seamless integration of models into existing workflows. It supports training and evaluation on single-node, multi-node, and resizable clusters, enabling scalability without resource wastage. Compatible with Python, R, Scala, Java, and .NET, SynapseML abstracts over different data sources for easy experimentation. Requires Scala 2.12, Spark 3.4+, and Python 3.8+.
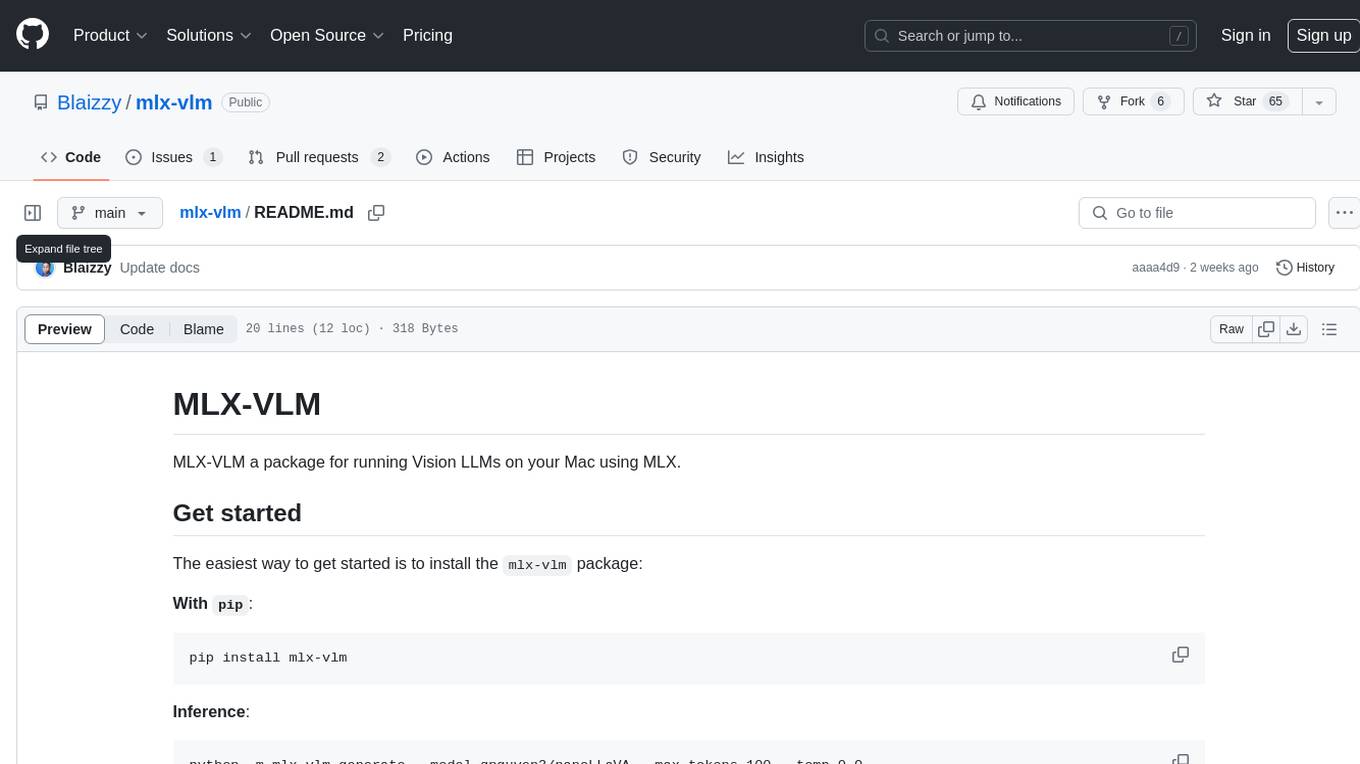
mlx-vlm
MLX-VLM is a package designed for running Vision LLMs on Mac systems using MLX. It provides a convenient way to install and utilize the package for processing large language models related to vision tasks. The tool simplifies the process of running LLMs on Mac computers, offering a seamless experience for users interested in leveraging MLX for vision-related projects.
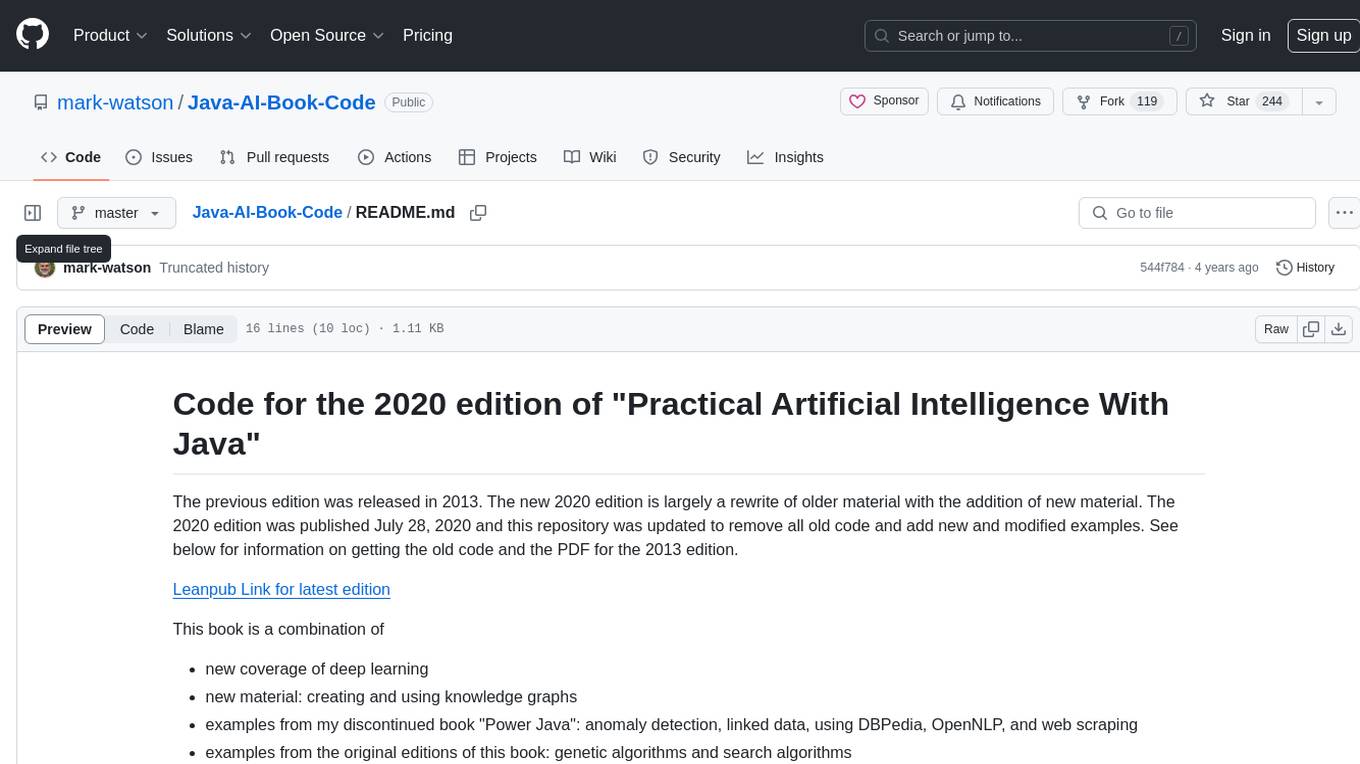
Java-AI-Book-Code
The Java-AI-Book-Code repository contains code examples for the 2020 edition of 'Practical Artificial Intelligence With Java'. It is a comprehensive update of the previous 2013 edition, featuring new content on deep learning, knowledge graphs, anomaly detection, linked data, genetic algorithms, search algorithms, and more. The repository serves as a valuable resource for Java developers interested in AI applications and provides practical implementations of various AI techniques and algorithms.
For similar jobs
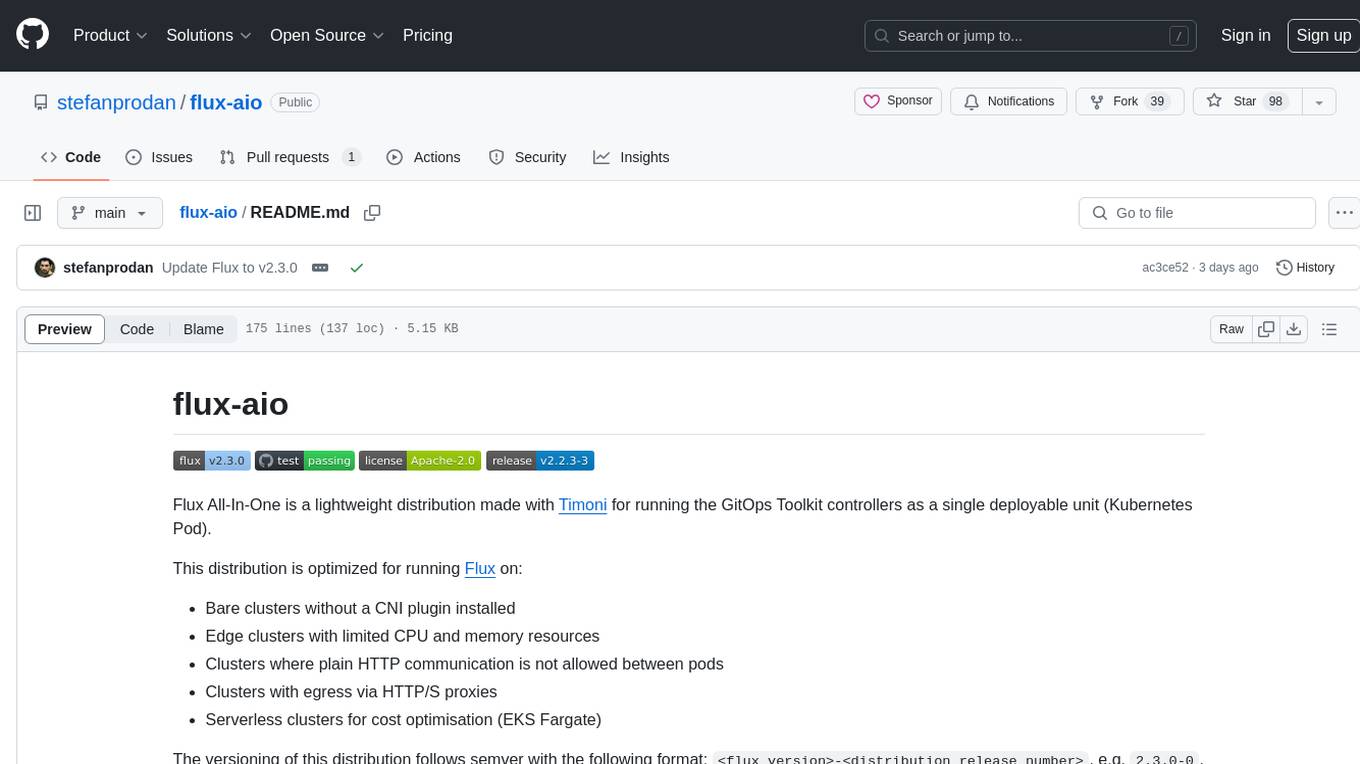
flux-aio
Flux All-In-One is a lightweight distribution optimized for running the GitOps Toolkit controllers as a single deployable unit on Kubernetes clusters. It is designed for bare clusters, edge clusters, clusters with restricted communication, clusters with egress via proxies, and serverless clusters. The distribution follows semver versioning and provides documentation for specifications, installation, upgrade, OCI sync configuration, Git sync configuration, and multi-tenancy configuration. Users can deploy Flux using Timoni CLI and a Timoni Bundle file, fine-tune installation options, sync from public Git repositories, bootstrap repositories, and uninstall Flux without affecting reconciled workloads.
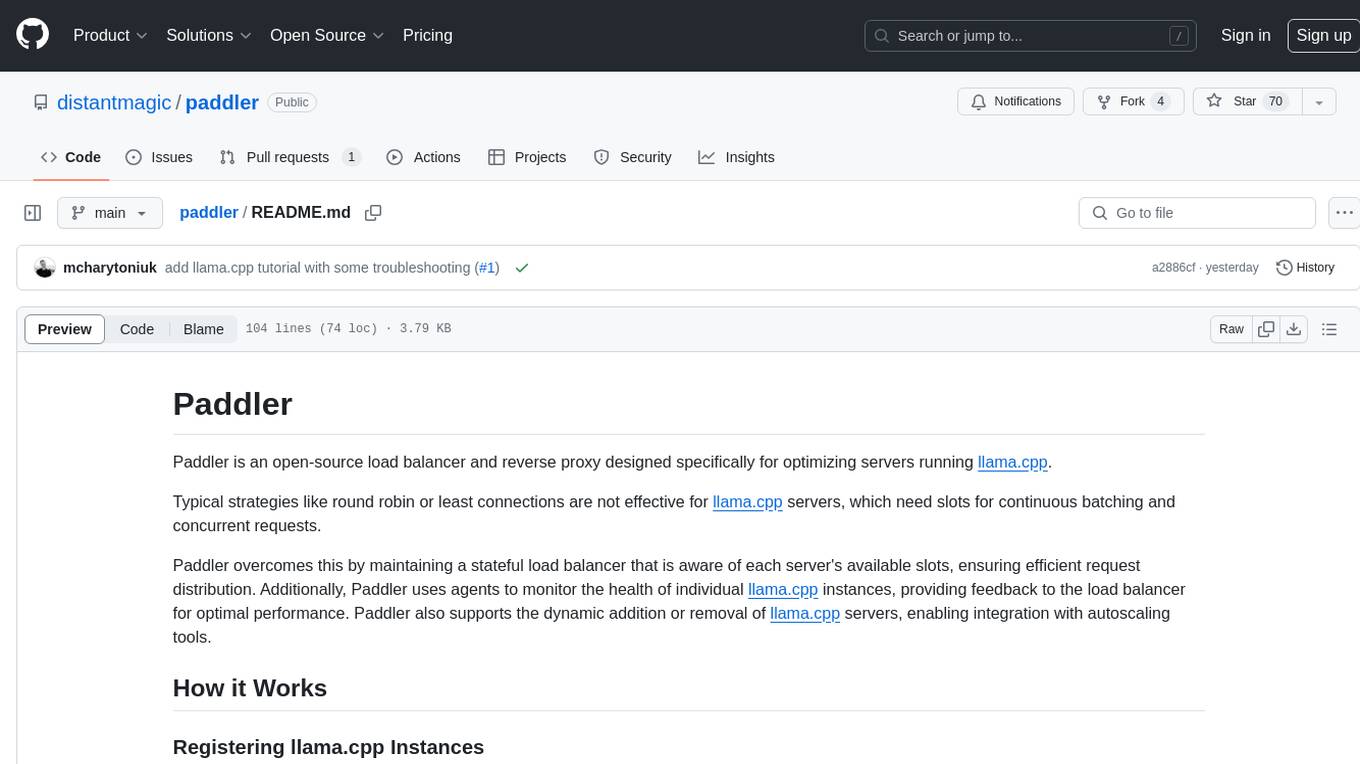
paddler
Paddler is an open-source load balancer and reverse proxy designed specifically for optimizing servers running llama.cpp. It overcomes typical load balancing challenges by maintaining a stateful load balancer that is aware of each server's available slots, ensuring efficient request distribution. Paddler also supports dynamic addition or removal of servers, enabling integration with autoscaling tools.
DaoCloud-docs
DaoCloud Enterprise 5.0 Documentation provides detailed information on using DaoCloud, a Certified Kubernetes Service Provider. The documentation covers current and legacy versions, workflow control using GitOps, and instructions for opening a PR and previewing changes locally. It also includes naming conventions, writing tips, references, and acknowledgments to contributors. Users can find guidelines on writing, contributing, and translating pages, along with using tools like MkDocs, Docker, and Poetry for managing the documentation.
ztncui-aio
This repository contains a Docker image with ZeroTier One and ztncui to set up a standalone ZeroTier network controller with a web user interface. It provides features like Golang auto-mkworld for generating a planet file, supports local persistent storage configuration, and includes a public file server. Users can build the Docker image, set up the container with specific environment variables, and manage the ZeroTier network controller through the web interface.
devops-gpt
DevOpsGPT is a revolutionary tool designed to streamline your workflow and empower you to build systems and automate tasks with ease. Tired of spending hours on repetitive DevOps tasks? DevOpsGPT is here to help! Whether you're setting up infrastructure, speeding up deployments, or tackling any other DevOps challenge, our app can make your life easier and more productive. With DevOpsGPT, you can expect faster task completion, simplified workflows, and increased efficiency. Ready to experience the DevOpsGPT difference? Visit our website, sign in or create an account, start exploring the features, and share your feedback to help us improve. DevOpsGPT will become an essential tool in your DevOps toolkit.
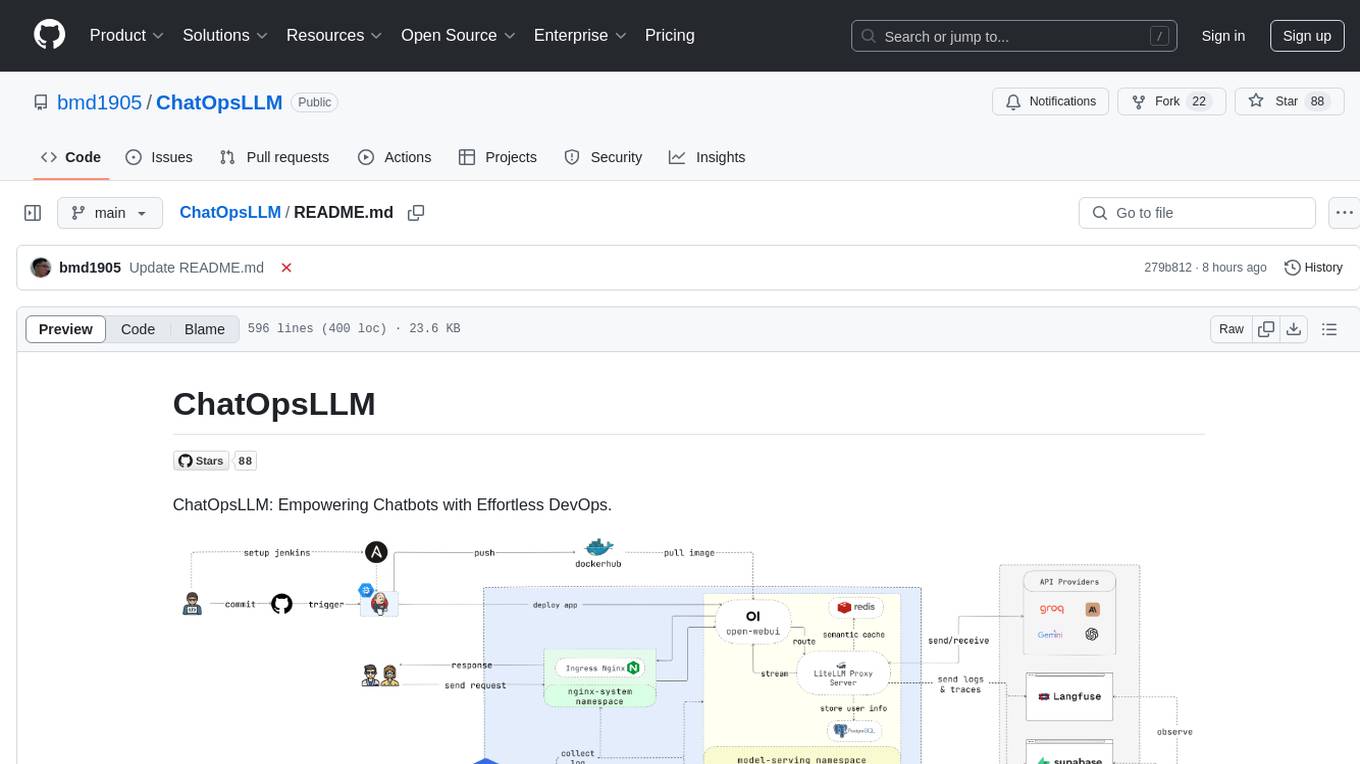
ChatOpsLLM
ChatOpsLLM is a project designed to empower chatbots with effortless DevOps capabilities. It provides an intuitive interface and streamlined workflows for managing and scaling language models. The project incorporates robust MLOps practices, including CI/CD pipelines with Jenkins and Ansible, monitoring with Prometheus and Grafana, and centralized logging with the ELK stack. Developers can find detailed documentation and instructions on the project's website.
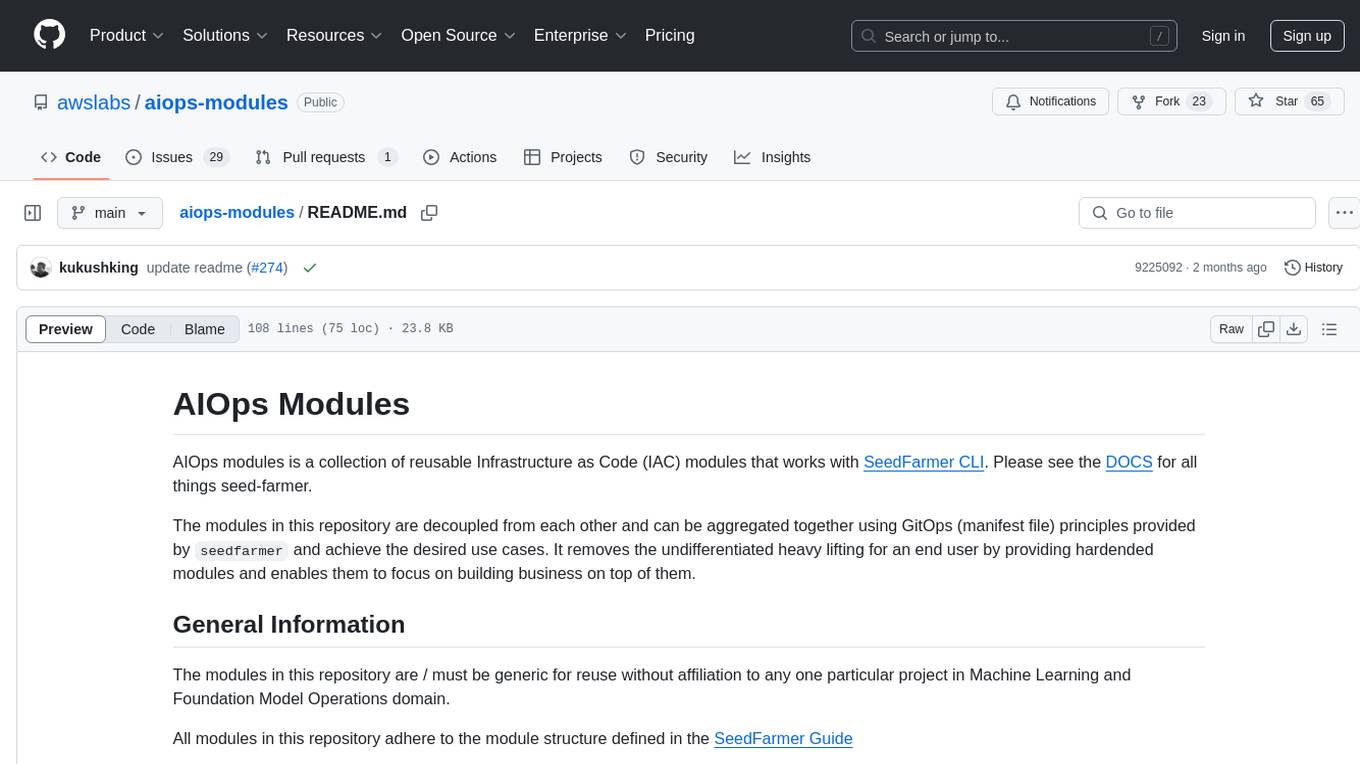
aiops-modules
AIOps Modules is a collection of reusable Infrastructure as Code (IAC) modules that work with SeedFarmer CLI. The modules are decoupled and can be aggregated using GitOps principles to achieve desired use cases, removing heavy lifting for end users. They must be generic for reuse in Machine Learning and Foundation Model Operations domain, adhering to SeedFarmer Guide structure. The repository includes deployment steps, project manifests, and various modules for SageMaker, Mlflow, FMOps/LLMOps, MWAA, Step Functions, EKS, and example use cases. It also supports Industry Data Framework (IDF) and Autonomous Driving Data Framework (ADDF) Modules.
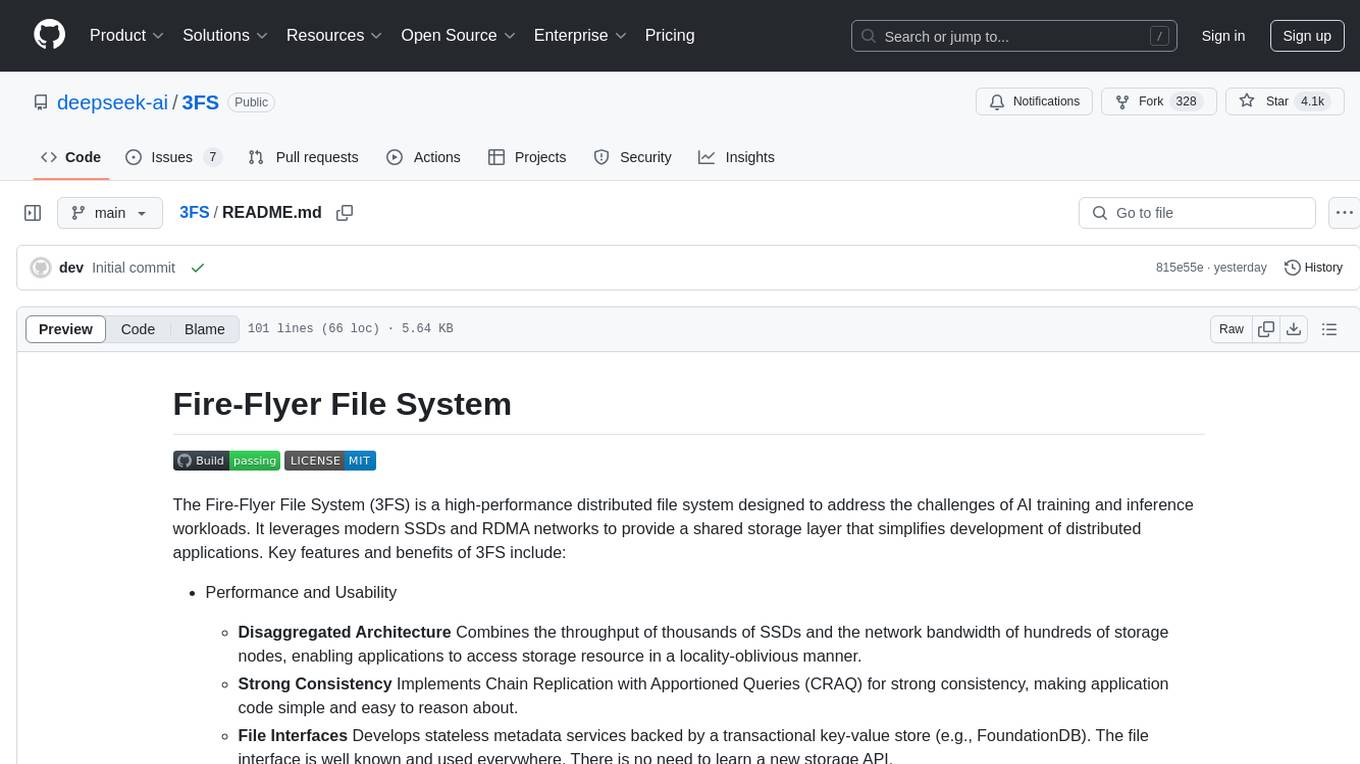
3FS
The Fire-Flyer File System (3FS) is a high-performance distributed file system designed for AI training and inference workloads. It leverages modern SSDs and RDMA networks to provide a shared storage layer that simplifies development of distributed applications. Key features include performance, disaggregated architecture, strong consistency, file interfaces, data preparation, dataloaders, checkpointing, and KVCache for inference. The system is well-documented with design notes, setup guide, USRBIO API reference, and P specifications. Performance metrics include peak throughput, GraySort benchmark results, and KVCache optimization. The source code is available on GitHub for cloning and installation of dependencies. Users can build 3FS and run test clusters following the provided instructions. Issues can be reported on the GitHub repository.


