
End-to-End-Data-Pipeline
📈 A scalable, production-ready data pipeline for real-time streaming & batch processing, integrating Kafka, Spark, Airflow, AWS, Kubernetes, and MLflow. Supports end-to-end data ingestion, transformation, storage, monitoring, and AI/ML serving with CI/CD automation using Terraform & GitHub Actions.
Stars: 82
End-to-End-Data-Pipeline is a comprehensive tool for building and managing data pipelines from data ingestion to data visualization. It provides a seamless workflow for processing, transforming, and analyzing data at scale. The tool supports various data sources and formats, making it versatile for different data processing needs. With End-to-End-Data-Pipeline, users can easily automate data workflows, monitor pipeline performance, and collaborate on data projects efficiently.
README:
This repository contains a fully integrated, production-ready data pipeline that supports both batch and streaming data processing using open-source technologies. It is designed to be easily configured and deployed by any business or individual with minimal modifications.
The pipeline incorporates:
-
Data Ingestion:
- Batch Sources: SQL databases (MySQL, PostgreSQL), Data Lakes (MinIO as an S3-compatible store), files (CSV, JSON, XML)
- Streaming Sources: Kafka for event logs, IoT sensor data, and social media streams
-
Data Processing & Transformation:
- Batch Processing: Apache Spark for large-scale ETL jobs, integrated with Great Expectations for data quality checks
- Streaming Processing: Spark Structured Streaming for real-time data processing and anomaly detection
-
Data Storage:
- Raw Data: Stored in MinIO (S3-compatible storage)
- Processed Data: Loaded into PostgreSQL for analytics and reporting
-
Data Quality, Monitoring & Governance:
- Data Quality: Great Expectations validates incoming data
- Data Governance: Apache Atlas / OpenMetadata integration (lineage registration)
- Monitoring & Logging: Prometheus and Grafana for system monitoring and alerting
-
Data Serving & AI/ML Integration:
- ML Pipelines: MLflow for model tracking and feature store integration
- BI & Dashboarding: Grafana dashboards provide real-time insights
-
CI/CD & Deployment:
- CI/CD Pipelines: GitHub Actions or Jenkins for continuous integration and deployment
- Container Orchestration: Kubernetes with Argo CD for GitOps deployment
Read this README and follow the step-by-step guide to set up the pipeline on your local machine or cloud environment. Customize the pipeline components, configurations, and example applications to suit your data processing needs.
- Architecture Overview
- Directory Structure
- Components & Technologies
- Setup Instructions
- Configuration & Customization
- Example Applications
- Troubleshooting & Further Considerations
- Contributing
- License
- Final Notes
The architecture of the end-to-end data pipeline is designed to handle both batch and streaming data processing. Below is a high-level overview of the components and their interactions:
graph TB
    subgraph "Data Sources"
        BS[Batch Sources<br/>MySQL, Files, CSV/JSON/XML]
        SS[Streaming Sources<br/>Kafka Events, IoT, Social Media]
    end

    subgraph "Ingestion & Orchestration"
        AIR[Apache Airflow<br/>DAG Orchestration]
        KAF[Apache Kafka<br/>Event Streaming]
    end

    subgraph "Processing Layer"
        SPB[Spark Batch<br/>Large-scale ETL]
        SPS[Spark Streaming<br/>Real-time Processing]
        GE[Great Expectations<br/>Data Quality]
    end

    subgraph "Storage Layer"
        MIN[MinIO<br/>S3-Compatible Storage]
        PG[PostgreSQL<br/>Analytics Database]
        S3[AWS S3<br/>Cloud Storage]
        MDB[MongoDB<br/>NoSQL Store]
        IDB[InfluxDB<br/>Time-series DB]
    end

    subgraph "Monitoring & Governance"
        PROM[Prometheus<br/>Metrics Collection]
        GRAF[Grafana<br/>Dashboards]
        ATL[Apache Atlas<br/>Data Lineage]
    end

    subgraph "ML & Serving"
        MLF[MLflow<br/>Model Tracking]
        FST[Feast<br/>Feature Store]
        BI[BI Tools<br/>Tableau/PowerBI/Looker]
    end

    BS --> AIR
    SS --> KAF
    AIR --> SPB
    KAF --> SPS
    SPB --> GE
    SPS --> GE
    GE --> MIN
    GE --> PG
    MIN --> S3
    PG --> MDB
    PG --> IDB
    SPB --> PROM
    SPS --> PROM
    PROM --> GRAF
    SPB --> ATL
    SPS --> ATL
    PG --> MLF
    PG --> FST
    PG --> BI
MIN --> MLFBasically, data will be streamed with Kafka, processed with Spark, and stored in a data warehouse using PostgreSQL. The pipeline also integrates MinIO as an object storage solution and uses Airflow to orchestrate the end-to-end data flow. Great Expectations enforces data quality checks, while Prometheus and Grafana provide monitoring and alerting capabilities. MLflow and Feast are used for machine learning model tracking and feature store integration.
[!CAUTION] Note: The diagram(s) may not reflect ALL components in the repository, but it provides a good overview of the main components and their interactions. For instance, I added BI tools like Tableau, Power BI, and Looker to the repo for data visualization and reporting.
sequenceDiagram
    participant BS as Batch Source<br/>(MySQL/Files)
    participant AF as Airflow DAG
    participant GE as Great Expectations
    participant MN as MinIO
    participant SP as Spark Batch
    participant PG as PostgreSQL
    participant MG as MongoDB
    participant PR as Prometheus

    BS->>AF: Trigger Batch Job
    AF->>BS: Extract Data
    AF->>GE: Validate Data Quality
    GE-->>AF: Validation Results
    AF->>MN: Upload Raw Data
    AF->>SP: Submit Spark Job
    SP->>MN: Read Raw Data
    SP->>SP: Transform & Enrich
    SP->>PG: Write Processed Data
    SP->>MG: Write NoSQL Data
    SP->>PR: Send Metrics
AF->>PR: Job Status MetricssequenceDiagram
participant KP as Kafka Producer
participant KT as Kafka Topic
participant SS as Spark Streaming
participant AD as Anomaly Detection
participant PG as PostgreSQL
participant MN as MinIO
participant GF as Grafana
KP->>KT: Publish Events
KT->>SS: Consume Stream
SS->>AD: Process Events
AD->>AD: Detect Anomalies
AD->>PG: Store Results
AD->>MN: Archive Data
SS->>GF: Real-time Metrics
GF->>GF: Update Dashboardgraph LR
subgraph "Data Quality Pipeline"
DI[Data Ingestion] --> GE[Great Expectations]
GE --> VR{Validation<br/>Result}
VR -->|Pass| DP[Data Processing]
VR -->|Fail| AL[Alert & Log]
AL --> DR[Data Rejection]
DP --> DQ[Quality Metrics]
end
subgraph "Data Governance"
DP --> ATL[Apache Atlas]
ATL --> LIN[Lineage Tracking]
ATL --> CAT[Data Catalog]
ATL --> POL[Policies & Compliance]
end
DQ --> PROM[Prometheus]
PROM --> GRAF[Grafana Dashboard]graph LR
subgraph "Development"
DEV[Developer] --> GIT[Git Push]
end
subgraph "CI/CD Pipeline"
GIT --> GHA[GitHub Actions]
GHA --> TEST[Run Tests]
TEST --> BUILD[Build Docker Images]
BUILD --> SCAN[Security Scan]
SCAN --> PUSH[Push to Registry]
end
subgraph "Deployment"
PUSH --> ARGO[Argo CD]
ARGO --> K8S[Kubernetes Cluster]
K8S --> HELM[Helm Charts]
HELM --> PODS[Deploy Pods]
end
subgraph "Infrastructure"
TERRA[Terraform] --> CLOUD[Cloud Resources]
CLOUD --> K8S
end
PODS --> MON[Monitoring]graph TB
subgraph Batch["Batch Processing"]
BS[Batch Source<br/>MySQL, Files, User Interaction]
AD[Airflow Batch DAG<br/>- Extracts data from MySQL<br/>- Validates with Great Expectations<br/>- Uploads raw data to MinIO]
SB[Spark Batch Job<br/>- Reads raw CSV from MinIO<br/>- Transforms, cleans, enriches<br/>- Writes to PostgreSQL & MinIO]
PDS[Processed Data Store<br/>PostgreSQL, MongoDB, AWS S3]
CI[Cache & Indexing<br/>Elasticsearch, Redis]
BS -->|Extract/Validate| AD
AD -->|spark-submit| SB
SB -->|Load/Analyze| PDS
PDS -->|Query/Analyze| CI
end
subgraph Stream["Streaming Processing"]
SS[Streaming Source<br/>Kafka]
SSJ[Spark Streaming Job<br/>- Consumes Kafka messages<br/>- Filters and detects anomalies<br/>- Persists to PostgreSQL & MinIO]
SS --> SSJ
end
subgraph Monitor["Monitoring & Governance"]
MG[Monitoring & Data Governance<br/>- Prometheus & Grafana<br/>- Apache Atlas / OpenMetadata]
end
subgraph ML["AI/ML Serving"]
MLS[AI/ML Serving<br/>- Feature Store Feast<br/>- MLflow Model Tracking<br/>- Model training & serving<br/>- BI Dashboards]
end
subgraph CICD["CI/CD & Infrastructure"]
CIP[CI/CD Pipelines<br/>GitHub Actions / Jenkins<br/>Terraform for Cloud Deploy]
K8S[Kubernetes Cluster<br/>Argo CD for GitOps<br/>Helm Charts for Deployment]
end
SSJ --> PDS
MG -.monitors.-> Batch
MG -.monitors.-> Stream
ML -.uses.-> PDS
CIP --> K8S
K8S -.orchestrates.-> Batch
K8S -.orchestrates.-> StreamA more detailed flow diagram that includes backend and frontend integration is available in the assets/ directory. This diagram illustrates how the data pipeline components interact with each other and with external systems, including data sources, storage, processing, visualization, and monitoring.
Although the frontend & backend integration is not included in this repository (since it's supposed to only contain the pipeline), you can easily integrate it with your existing frontend application or create a new one using popular frameworks like React, Angular, or Vue.js.
graph TB
    subgraph "Docker Compose Stack"
        subgraph "Data Sources"
            MYSQL[MySQL<br/>Port: 3306]
            KAFKA[Kafka<br/>Port: 9092]
            ZK[Zookeeper<br/>Port: 2181]
        end

        subgraph "Processing"
            AIR[Airflow<br/>Webserver:8080<br/>Scheduler]
            SPARK[Spark<br/>Master/Worker]
        end

        subgraph "Storage"
            MINIO[MinIO<br/>API: 9000<br/>Console: 9001]
            PG[PostgreSQL<br/>Port: 5432]
        end

        subgraph "Monitoring"
            PROM[Prometheus<br/>Port: 9090]
            GRAF[Grafana<br/>Port: 3000]
        end

        KAFKA --> ZK
        AIR --> MYSQL
        AIR --> PG
        AIR --> SPARK
        SPARK --> MINIO
        SPARK --> PG
        SPARK --> KAFKA
        PROM --> AIR
        PROM --> SPARK
        GRAF --> PROM
endflowchart LR
subgraph "Feature Engineering"
RAW[Raw Data] --> FE[Feature<br/>Extraction]
FE --> FS[Feature Store<br/>Feast]
end
subgraph "Model Training"
FS --> TRAIN[Training<br/>Pipeline]
TRAIN --> VAL[Validation]
VAL --> MLF[MLflow<br/>Registry]
end
subgraph "Model Serving"
MLF --> DEPLOY[Model<br/>Deployment]
DEPLOY --> API[Prediction<br/>API]
API --> APP[Applications]
end
subgraph "Monitoring"
API --> METRICS[Performance<br/>Metrics]
METRICS --> DRIFT[Drift<br/>Detection]
DRIFT --> RETRAIN[Retrigger<br/>Training]
end
RETRAIN --> TRAINend-to-end-pipeline/
├── .devcontainer/ # VS Code Dev Container settings
├── docker-compose.yaml # Docker orchestration for all services
├── docker-compose.ci.yaml # Docker Compose for CI/CD pipelines
├── End_to_End_Data_Pipeline.ipynb # Jupyter notebook for pipeline overview
├── requirements.txt # Python dependencies for scripts
├── .gitignore # Standard Git ignore file
├── README.md # Comprehensive documentation (this file)
├── airflow/
│ ├── Dockerfile # Custom Airflow image with dependencies
│ ├── requirements.txt # Python dependencies for Airflow
│ └── dags/
│ ├── batch_ingestion_dag.py # Batch pipeline DAG
│ └── streaming_monitoring_dag.py # Streaming monitoring DAG
├── spark/
│ ├── Dockerfile # Custom Spark image with Kafka and S3 support
│ ├── spark_batch_job.py # Spark batch ETL job
│ └── spark_streaming_job.py # Spark streaming job
├── kafka/
│ └── producer.py # Kafka producer for simulating event streams
├── storage/
│ ├── aws_s3_influxdb.py # S3-InfluxDB integration stub
│ ├── hadoop_batch_processing.py # Hadoop batch processing stub
│ └── mongodb_streaming.py # MongoDB streaming integration stub
├── great_expectations/
│ ├── great_expectations.yaml # GE configuration
│ └── expectations/
│ └── raw_data_validation.py # GE suite for data quality
├── governance/
│ └── atlas_stub.py # Dataset lineage registration with Atlas/OpenMetadata
├── monitoring/
│ ├── monitoring.py # Python script to set up Prometheus & Grafana
│ └── prometheus.yml # Prometheus configuration file
├── ml/
│ ├── feature_store_stub.py # Feature Store integration stub
│ └── mlflow_tracking.py # MLflow model tracking
├── kubernetes/
│ ├── argo-app.yaml # Argo CD application manifest
│ └── deployment.yaml # Kubernetes deployment manifest
├── terraform/ # Terraform scripts for cloud deployment
└── scripts/
└── init_db.sql # SQL script to initialize MySQL and demo data
-
Ingestion & Orchestration:
- Apache Airflow – Schedules batch and streaming jobs.
- Kafka – Ingests streaming events.
- Spark – Processes batch and streaming data.
-
Storage & Processing:
- MinIO – S3-compatible data lake.
- PostgreSQL – Stores transformed and processed data.
- Great Expectations – Enforces data quality.
- AWS S3 – Cloud storage integration.
- InfluxDB – Time-series data storage.
- MongoDB – NoSQL database integration.
- Hadoop – Big data processing integration.
-
Monitoring & Governance:
- Prometheus – Metrics collection.
- Grafana – Dashboard visualization.
- Apache Atlas/OpenMetadata – Data lineage and governance.
-
ML & Data Serving:
- Docker and Docker Compose must be installed.
- Ensure that Python 3.9+ is installed locally if you want to run scripts outside of Docker.
- Open ports required:
- Airflow: 8080
- MySQL: 3306
- PostgreSQL: 5432
- MinIO: 9000 (and console on 9001)
- Kafka: 9092
- Prometheus: 9090
- Grafana: 3000
-
Clone the Repository
git clone https://github.com/hoangsonww/End-to-End-Data-Pipeline.git cd End-to-End-Data-Pipeline -
Start the Pipeline Stack
Use Docker Compose to launch all components:
docker-compose up --build
This command will:
- Build custom Docker images for Airflow and Spark.
- Start MySQL, PostgreSQL, Kafka (with Zookeeper), MinIO, Prometheus, Grafana, and Airflow webserver.
- Initialize the MySQL database with demo data (via
scripts/init_db.sql).
-
Access the Services
-
Airflow UI: http://localhost:8080
Set up connections:-
mysql_default→ Host:mysql, DB:source_db, User:user, Password:pass -
postgres_default→ Host:postgres, DB:processed_db, User:user, Password:pass
-
-
MinIO Console: http://localhost:9001 (User:
minio, Password:minio123) -
Kafka: Accessible on port
9092 - Prometheus: http://localhost:9090
-
Grafana: http://localhost:3000 (Default login:
admin/admin)
-
Airflow UI: http://localhost:8080
-
Run Batch Pipeline
- In the Airflow UI, enable the
batch_ingestion_dagto run the end-to-end batch pipeline. - This DAG extracts data from MySQL, validates it, uploads raw data to MinIO, triggers a Spark job for transformation, and loads data into PostgreSQL.
- In the Airflow UI, enable the
-
Run Streaming Pipeline
- Open a terminal and start the Kafka producer:
docker-compose exec kafka python /opt/spark_jobs/../kafka/producer.py - In another terminal, run the Spark streaming job:
docker-compose exec spark spark-submit --master local[2] /opt/spark_jobs/spark_streaming_job.py - The streaming job consumes events from Kafka, performs real-time anomaly detection, and writes results to PostgreSQL and MinIO.
- Open a terminal and start the Kafka producer:
-
Monitoring & Governance
-
Prometheus & Grafana:
Use themonitoring.pyscript (or access Grafana) to view real-time metrics and dashboards. -
Data Lineage:
Thegovernance/atlas_stub.pyscript registers lineage between datasets (can be extended for full Apache Atlas integration).
-
Prometheus & Grafana:
-
ML & Feature Store
- Use
ml/mlflow_tracking.pyto simulate model training and tracking. - Use
ml/feature_store_stub.pyto integrate with a feature store like Feast.
- Use
-
CI/CD & Deployment
- Use the
docker-compose.ci.yamlfile to set up CI/CD pipelines. - Use the
kubernetes/directory for Kubernetes deployment manifests. - Use the
terraform/directory for cloud deployment scripts. - Use the
.github/workflows/directory for GitHub Actions CI/CD workflows.
- Use the
Congratulations! You have successfully set up the end-to-end data pipeline with batch and streaming processing. However, this is a very general pipeline that needs to be customized for your specific use case.
[!IMPORTANT] Note: Be sure to visit the files and scripts in the repository and change the credentials, configurations, and logic to match your environment and use case. Feel free to extend the pipeline with additional components, services, or integrations as needed.
-
Docker Compose:
All services are defined indocker-compose.yaml. Adjust resource limits, environment variables, and service dependencies as needed. -
Airflow:
Customize DAGs in theairflow/dags/directory. Use the provided PythonOperators to integrate custom processing logic. -
Spark Jobs:
Edit transformation logic inspark/spark_batch_job.pyandspark/spark_streaming_job.pyto match your data and processing requirements. -
Kafka Producer:
Modifykafka/producer.pyto simulate different types of events or adjust the batch size and frequency using environment variables. -
Monitoring:
Updatemonitoring/monitoring.pyandprometheus.ymlto scrape additional metrics or customize dashboards. Place Grafana dashboard JSON files in themonitoring/grafana_dashboards/directory. -
Governance & ML:
Replace stub implementations ingovernance/atlas_stub.pyandml/with real integrations as needed. -
CI/CD & Deployment:
Customize CI/CD workflows in.github/workflows/and deployment manifests inkubernetes/andterraform/for your cloud environment. -
Storage:
Data storage options are in the
storage/directory with AWS S3, InfluxDB, MongoDB, and Hadoop stubs. Replace these with real integrations or credentials as needed.
%%{init: {"theme": "default", "themeVariables": { "primaryColor": "#f9f9f9", "fontSize": "14px", "lineColor": "#000000", "textColor": "#000000", "background": "#ffffff"}}}%%
mindmap
  root((Data Pipeline<br/>Use Cases))
    E-Commerce
      Real-Time Recommendations
        Clickstream Processing
        User Behavior Analysis
        Personalized Content
      Fraud Detection
        Transaction Monitoring
        Pattern Recognition
        Risk Scoring
    Finance
      Risk Analysis
        Credit Assessment
        Portfolio Analytics
        Market Risk
      Trade Surveillance
        Market Data Processing
        Compliance Monitoring
        Anomaly Detection
    Healthcare
      Patient Monitoring
        IoT Sensor Data
        Real-time Alerts
        Predictive Analytics
      Clinical Trials
        Data Integration
        Outcome Prediction
        Drug Efficacy Analysis
    IoT/Manufacturing
      Predictive Maintenance
        Sensor Analytics
        Failure Prediction
        Maintenance Scheduling
      Supply Chain
        Inventory Optimization
        Logistics Tracking
        Demand Forecasting
    Media
      Sentiment Analysis
        Social Media Streams
        Brand Monitoring
        Trend Detection
      Ad Fraud Detection
        Click Pattern Analysis
        Bot Detection
Campaign Analytics- Real-Time Recommendations: Process clickstream data to generate personalized product recommendations.
- Fraud Detection: Detect unusual purchasing patterns or multiple high-value transactions in real-time.
- Risk Analysis: Aggregate transaction data to assess customer credit risk.
- Trade Surveillance: Monitor market data and employee trades for insider trading signals.
- Patient Monitoring: Process sensor data from medical devices to alert healthcare providers of critical conditions.
- Clinical Trial Analysis: Analyze historical trial data for predictive analytics in treatment outcomes.
- Predictive Maintenance: Monitor sensor data from machinery to predict failures before they occur.
- Supply Chain Optimization: Aggregate data across manufacturing processes to optimize production and logistics.
- Sentiment Analysis: Analyze social media feeds in real-time to gauge public sentiment on new releases.
- Ad Fraud Detection: Identify and block fraudulent clicks on digital advertisements.
Feel free to use this pipeline as a starting point for your data processing needs. Extend it with additional components, services, or integrations to build a robust, end-to-end data platform.
-
Service Not Starting:
Check Docker logs (docker-compose logs) to troubleshoot errors with MySQL, Kafka, Airflow, or Spark. -
Airflow Connection Issues:
Verify that connection settings (host, user, password) in the Airflow UI match those indocker-compose.yaml. -
Data Quality Errors:
Inspect Great Expectations logs in the Airflow DAG runs to adjust expectations and clean data. -
Resource Constraints:
For production use, consider scaling out services (e.g., running Spark on a dedicated cluster, using managed Kafka).
Contributions, issues, and feature requests are welcome!
- Fork the Project
- Create your Feature Branch (
git checkout -b feature/AmazingFeature) - Commit your Changes (
git commit -m 'Add some AmazingFeature') - Push to the Branch (
git push origin feature/AmazingFeature) - Open a Pull Request
- We will review your changes and merge them into the main branch upon approval.
This project is licensed under the MIT License.
[!NOTE] This end-to-end data pipeline is designed for rapid deployment and customization. With minor configuration changes, it can be adapted to many business cases—from real-time analytics and fraud detection to predictive maintenance and advanced ML model training. Enjoy building a data-driven future with this pipeline!
Thanks for reading! If you found this repository helpful, please star it and share it with others. For questions, feedback, or suggestions, feel free to reach out to me on GitHub.
For Tasks:
Click tags to check more tools for each tasksFor Jobs:
Alternative AI tools for End-to-End-Data-Pipeline
Similar Open Source Tools

End-to-End-Data-Pipeline
End-to-End-Data-Pipeline is a comprehensive tool for building and managing data pipelines from data ingestion to data visualization. It provides a seamless workflow for processing, transforming, and analyzing data at scale. The tool supports various data sources and formats, making it versatile for different data processing needs. With End-to-End-Data-Pipeline, users can easily automate data workflows, monitor pipeline performance, and collaborate on data projects efficiently.
xorq
Xorq (formerly LETSQL) is a data processing library built on top of Ibis and DataFusion to write multi-engine data workflows. It provides a flexible and powerful tool for processing and analyzing data from various sources, enabling users to create complex data pipelines and perform advanced data transformations.
arconia
Arconia is a powerful open-source tool for managing and visualizing data in a user-friendly way. It provides a seamless experience for data analysts and scientists to explore, clean, and analyze datasets efficiently. With its intuitive interface and robust features, Arconia simplifies the process of data manipulation and visualization, making it an essential tool for anyone working with data.
data-juicer
Data-Juicer is a one-stop data processing system to make data higher-quality, juicier, and more digestible for LLMs. It is a systematic & reusable library of 80+ core OPs, 20+ reusable config recipes, and 20+ feature-rich dedicated toolkits, designed to function independently of specific LLM datasets and processing pipelines. Data-Juicer allows detailed data analyses with an automated report generation feature for a deeper understanding of your dataset. Coupled with multi-dimension automatic evaluation capabilities, it supports a timely feedback loop at multiple stages in the LLM development process. Data-Juicer offers tens of pre-built data processing recipes for pre-training, fine-tuning, en, zh, and more scenarios. It provides a speedy data processing pipeline requiring less memory and CPU usage, optimized for maximum productivity. Data-Juicer is flexible & extensible, accommodating most types of data formats and allowing flexible combinations of OPs. It is designed for simplicity, with comprehensive documentation, easy start guides and demo configs, and intuitive configuration with simple adding/removing OPs from existing configs.
redb-open
reDB Node is a distributed, policy-driven data mesh platform that enables True Data Portability across various databases, warehouses, clouds, and environments. It unifies data access, data mobility, and schema transformation into one open platform. Built for developers, architects, and AI systems, reDB addresses the challenges of fragmented data ecosystems in modern enterprises by providing multi-database interoperability, automated schema versioning, zero-downtime migration, real-time developer data environments with obfuscation, quantum-resistant encryption, and policy-based access control. The project aims to build a foundation for future-proof data infrastructure.

airweave
Airweave is an open-core tool that simplifies the process of making data searchable by unifying apps, APIs, and databases into a vector database with minimal configuration. It offers over 120 integrations, simplicity in syncing data from diverse sources, extensibility through 'sources', 'destinations', and 'embedders', and an async-first approach for large-scale data synchronization. With features like no-code setup, white-labeled multi-tenant support, chunk generators, automated sync, versioning & hashing, multi-source support, and scalability, Airweave provides a comprehensive solution for building applications that require semantic search.
ag2
Ag2 is a lightweight and efficient tool for generating automated reports from data sources. It simplifies the process of creating reports by allowing users to define templates and automate the data extraction and formatting. With Ag2, users can easily generate reports in various formats such as PDF, Excel, and CSV, saving time and effort in manual report generation tasks.
Daft
Daft is a lightweight and efficient tool for data analysis and visualization. It provides a user-friendly interface for exploring and manipulating datasets, making it ideal for both beginners and experienced data analysts. With Daft, you can easily import data from various sources, clean and preprocess it, perform statistical analysis, create insightful visualizations, and export your results in multiple formats. Whether you are a student, researcher, or business professional, Daft simplifies the process of analyzing data and deriving meaningful insights.
context7
Context7 is a powerful tool for analyzing and visualizing data in various formats. It provides a user-friendly interface for exploring datasets, generating insights, and creating interactive visualizations. With advanced features such as data filtering, aggregation, and customization, Context7 is suitable for both beginners and experienced data analysts. The tool supports a wide range of data sources and formats, making it versatile for different use cases. Whether you are working on exploratory data analysis, data visualization, or data storytelling, Context7 can help you uncover valuable insights and communicate your findings effectively.
unstract
Unstract is a no-code platform that enables users to launch APIs and ETL pipelines to structure unstructured documents. With Unstract, users can go beyond co-pilots by enabling machine-to-machine automation. Unstract's Prompt Studio provides a simple, no-code approach to creating prompts for LLMs, vector databases, embedding models, and text extractors. Users can then configure Prompt Studio projects as API deployments or ETL pipelines to automate critical business processes that involve complex documents. Unstract supports a wide range of LLM providers, vector databases, embeddings, text extractors, ETL sources, and ETL destinations, providing users with the flexibility to choose the best tools for their needs.
flyto-core
Flyto-core is a powerful Python library for geospatial analysis and visualization. It provides a wide range of tools for working with geographic data, including support for various file formats, spatial operations, and interactive mapping. With Flyto-core, users can easily load, manipulate, and visualize spatial data to gain insights and make informed decisions. Whether you are a GIS professional, a data scientist, or a developer, Flyto-core offers a versatile and user-friendly solution for geospatial tasks.
agent-pod
Agent POD is a project focused on capturing and storing personal digital data in a user-controlled environment, with the goal of enabling agents to interact with the data. It explores questions related to structuring information, creating an efficient data capture system, integrating with protocols like SOLID, and enabling data storage for groups. The project aims to transition from traditional data-storing apps to a system where personal data is owned and controlled by the user, facilitating the creation of 'solid-first' apps.
HyperAgent
HyperAgent is a powerful tool for automating repetitive tasks in web scraping and data extraction. It provides a user-friendly interface to create custom web scraping scripts without the need for extensive coding knowledge. With HyperAgent, users can easily extract data from websites, transform it into structured formats, and save it for further analysis. The tool supports various data formats and offers scheduling options for automated data extraction at regular intervals. HyperAgent is suitable for individuals and businesses looking to streamline their data collection processes and improve efficiency in extracting information from the web.
spiceai
Spice is a portable runtime written in Rust that offers developers a unified SQL interface to materialize, accelerate, and query data from any database, data warehouse, or data lake. It connects, fuses, and delivers data to applications, machine-learning models, and AI-backends, functioning as an application-specific, tier-optimized Database CDN. Built with industry-leading technologies such as Apache DataFusion, Apache Arrow, Apache Arrow Flight, SQLite, and DuckDB. Spice makes it fast and easy to query data from one or more sources using SQL, co-locating a managed dataset with applications or machine learning models, and accelerating it with Arrow in-memory, SQLite/DuckDB, or attached PostgreSQL for fast, high-concurrency, low-latency queries.
NadirClaw
NadirClaw is a powerful open-source tool designed for web scraping and data extraction. It provides a user-friendly interface for extracting data from websites with ease. With NadirClaw, users can easily scrape text, images, and other content from web pages for various purposes such as data analysis, research, and automation. The tool offers flexibility and customization options to cater to different scraping needs, making it a versatile solution for extracting data from the web. Whether you are a data scientist, researcher, or developer, NadirClaw can streamline your data extraction process and help you gather valuable insights from online sources.
Aimer_WT
Aimer_WT is a web scraping tool designed to extract data from websites efficiently and accurately. It provides a user-friendly interface for users to specify the data they want to scrape and offers various customization options. With Aimer_WT, users can easily automate the process of collecting data from multiple web pages, saving time and effort. The tool is suitable for both beginners and experienced users who need to gather data for research, analysis, or other purposes. Aimer_WT supports various data formats and allows users to export the extracted data for further processing.
For similar tasks
inferable
Inferable is an open source platform that helps users build reliable LLM-powered agentic automations at scale. It offers a managed agent runtime, durable tool calling, zero network configuration, multiple language support, and is fully open source under the MIT license. Users can define functions, register them with Inferable, and create runs that utilize these functions to automate tasks. The platform supports Node.js/TypeScript, Go, .NET, and React, and provides SDKs, core services, and bootstrap templates for various languages.
CEO
CEO is an intuitive and modular AI agent framework designed for task automation. It provides a flexible environment for building agents with specific abilities and personalities, allowing users to assign tasks and interact with the agents to automate various processes. The framework supports multi-agent collaboration scenarios and offers functionalities like instantiating agents, granting abilities, assigning queries, and executing tasks. Users can customize agent personalities and define specific abilities using decorators, making it easy to create complex automation workflows.
evi-run
evi-run is a powerful, production-ready multi-agent AI system built on Python using the OpenAI Agents SDK. It offers instant deployment, ultimate flexibility, built-in analytics, Telegram integration, and scalable architecture. The system features memory management, knowledge integration, task scheduling, multi-agent orchestration, custom agent creation, deep research, web intelligence, document processing, image generation, DEX analytics, and Solana token swap. It supports flexible usage modes like private, free, and pay mode, with upcoming features including NSFW mode, task scheduler, and automatic limit orders. The technology stack includes Python 3.11, OpenAI Agents SDK, Telegram Bot API, PostgreSQL, Redis, and Docker & Docker Compose for deployment.
Open-WebUI-Functions
Open-WebUI-Functions is a collection of Python-based functions that extend Open WebUI with custom pipelines, filters, and integrations. Users can interact with AI models, process data efficiently, and customize the Open WebUI experience. It includes features like custom pipelines, data processing filters, Azure AI support, N8N workflow integration, flexible configuration, secure API key management, and support for both streaming and non-streaming processing. The functions require an active Open WebUI instance, may need external AI services like Azure AI, and admin access for installation. Security features include automatic encryption of sensitive information like API keys. Pipelines include Azure AI Foundry, N8N, Infomaniak, and Google Gemini. Filters like Time Token Tracker measure response time and token usage. Integrations with Azure AI, N8N, Infomaniak, and Google are supported. Contributions are welcome, and the project is licensed under Apache License 2.0.
astron-rpa
AstronRPA is an enterprise-grade Robotic Process Automation (RPA) desktop application that supports low-code/no-code development. It enables users to rapidly build workflows and automate desktop software and web pages. The tool offers comprehensive automation support for various applications, highly component-based design, enterprise-grade security and collaboration features, developer-friendly experience, native agent empowerment, and multi-channel trigger integration. It follows a frontend-backend separation architecture with components for system operations, browser automation, GUI automation, AI integration, and more. The tool is deployed via Docker and designed for complex RPA scenarios.

End-to-End-Data-Pipeline
End-to-End-Data-Pipeline is a comprehensive tool for building and managing data pipelines from data ingestion to data visualization. It provides a seamless workflow for processing, transforming, and analyzing data at scale. The tool supports various data sources and formats, making it versatile for different data processing needs. With End-to-End-Data-Pipeline, users can easily automate data workflows, monitor pipeline performance, and collaborate on data projects efficiently.
llm-memorization
The 'llm-memorization' project is a tool designed to index, archive, and search conversations with a local LLM using a SQLite database enriched with automatically extracted keywords. It aims to provide personalized context at the start of a conversation by adding memory information to the initial prompt. The tool automates queries from local LLM conversational management libraries, offers a hybrid search function, enhances prompts based on posed questions, and provides an all-in-one graphical user interface for data visualization. It supports both French and English conversations and prompts for bilingual use.
For similar jobs
vscode-dbt-power-user
The vscode-dbt-power-user is an open-source extension that enhances the functionality of Visual Studio Code to seamlessly work with dbt™. It provides features such as auto-complete for dbt™ code, previewing query results, column lineage visualization, generating dbt™ models, documentation generation, deferring model builds, running parent/child models and tests with a click, compiled query preview and explanation, project health check, SQL validation, BigQuery cost estimation, and other features like dbt™ logs viewer. The extension is fully compatible with dev containers, code spaces, and remote extensions, supporting dbt™ versions above 1.0.
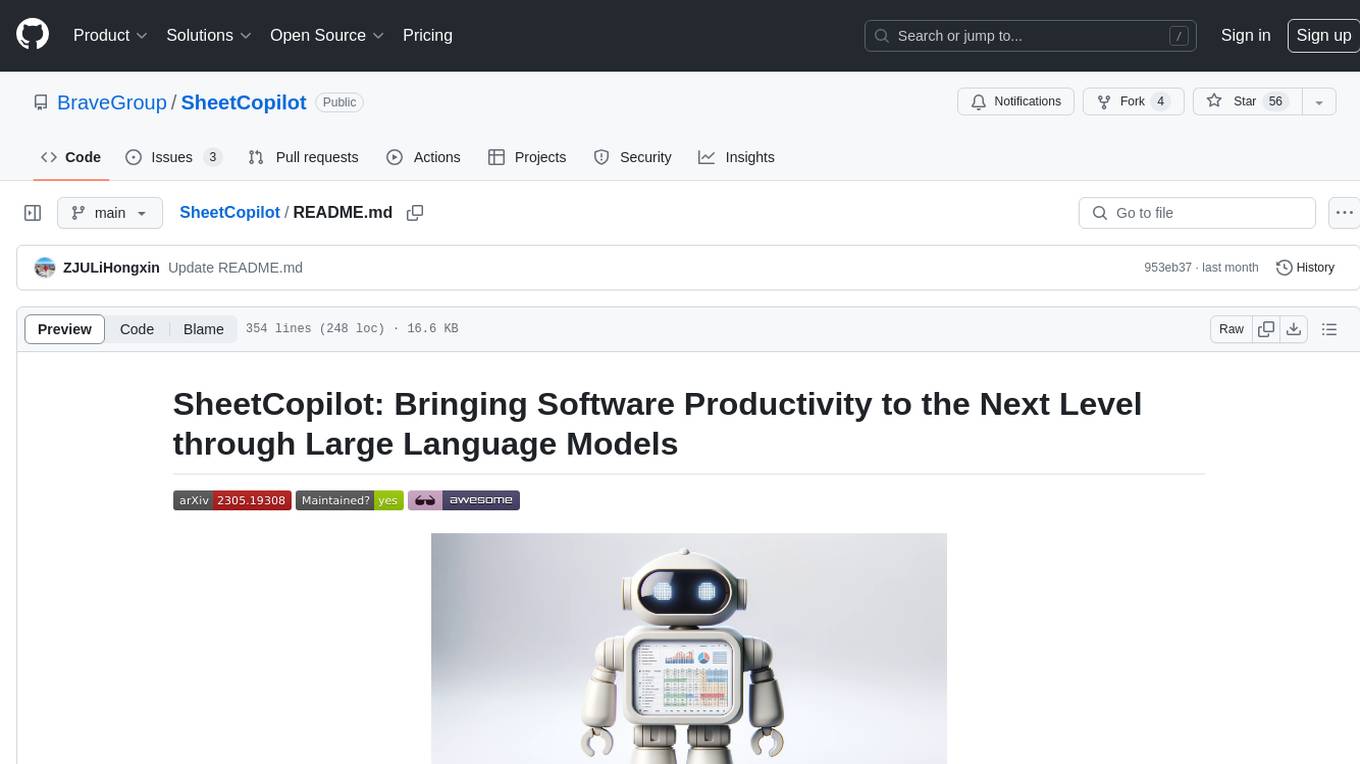
SheetCopilot
SheetCopilot is an assistant agent that manipulates spreadsheets by following user commands. It leverages Large Language Models (LLMs) to interact with spreadsheets like a human expert, enabling non-expert users to complete tasks on complex software such as Google Sheets and Excel via a language interface. The tool observes spreadsheet states, polishes generated solutions based on external action documents and error feedback, and aims to improve success rate and efficiency. SheetCopilot offers a dataset with diverse task categories and operations, supporting operations like entry & manipulation, management, formatting, charts, and pivot tables. Users can interact with SheetCopilot in Excel or Google Sheets, executing tasks like calculating revenue, creating pivot tables, and plotting charts. The tool's evaluation includes performance comparisons with leading LLMs and VBA-based methods on specific datasets, showcasing its capabilities in controlling various aspects of a spreadsheet.
wren-engine
Wren Engine is a semantic engine designed to serve as the backbone of the semantic layer for LLMs. It simplifies the user experience by translating complex data structures into a business-friendly format, enabling end-users to interact with data using familiar terminology. The engine powers the semantic layer with advanced capabilities to define and manage modeling definitions, metadata, schema, data relationships, and logic behind calculations and aggregations through an analytics-as-code design approach. By leveraging Wren Engine, organizations can ensure a developer-friendly semantic layer that reflects nuanced data relationships and dynamics, facilitating more informed decision-making and strategic insights.
mslearn-knowledge-mining
The mslearn-knowledge-mining repository contains lab files for Azure AI Knowledge Mining modules. It provides resources for learning and implementing knowledge mining techniques using Azure AI services. The repository is designed to help users explore and understand how to leverage AI for knowledge mining purposes within the Azure ecosystem.
extension-gen-ai
The Looker GenAI Extension provides code examples and resources for building a Looker Extension that integrates with Vertex AI Large Language Models (LLMs). Users can leverage the power of LLMs to enhance data exploration and analysis within Looker. The extension offers generative explore functionality to ask natural language questions about data and generative insights on dashboards to analyze data by asking questions. It leverages components like BQML Remote Models, BQML Remote UDF with Vertex AI, and Custom Fine Tune Model for different integration options. Deployment involves setting up infrastructure with Terraform and deploying the Looker Extension by creating a Looker project, copying extension files, configuring BigQuery connection, connecting to Git, and testing the extension. Users can save example prompts and configure user settings for the extension. Development of the Looker Extension environment includes installing dependencies, starting the development server, and building for production.
postgres-new
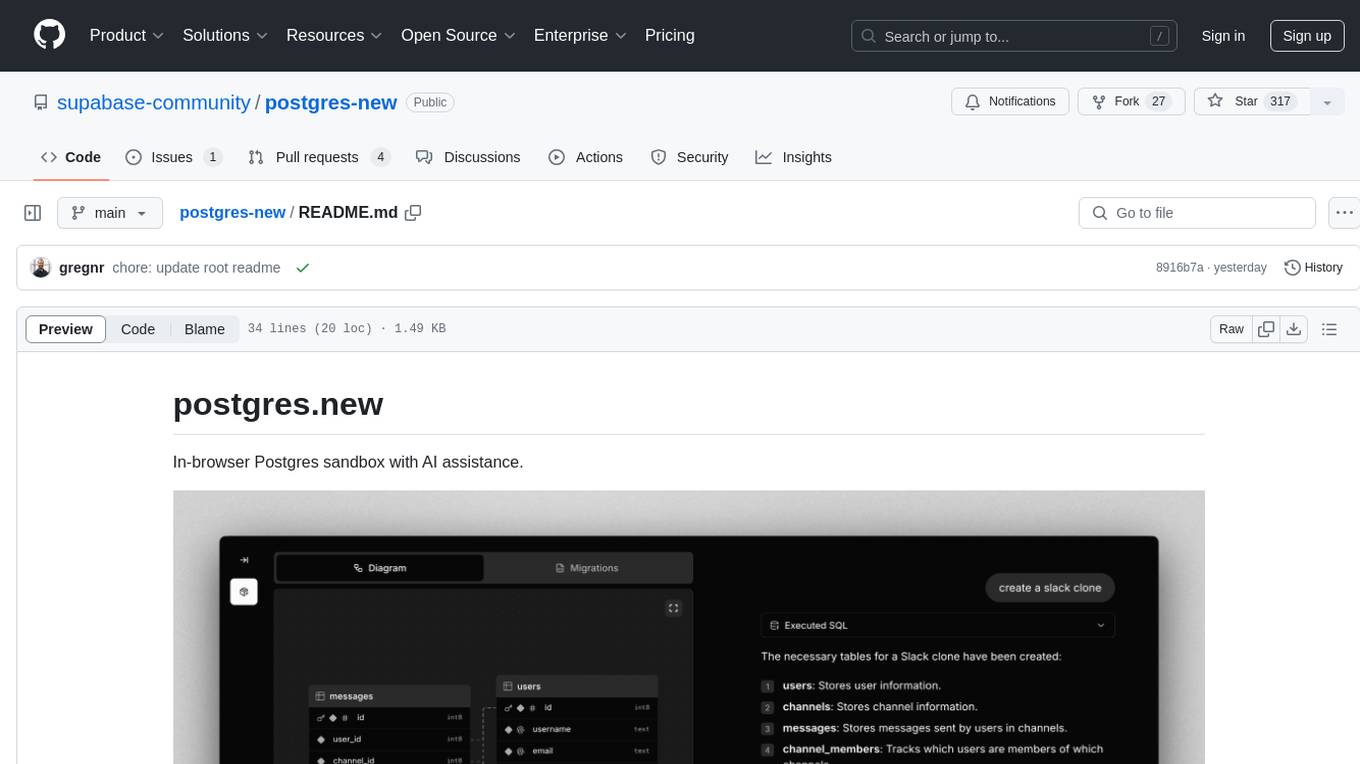
Postgres.new is an in-browser Postgres sandbox with AI assistance that allows users to spin up unlimited Postgres databases directly in the browser. Each database comes with a large language model (LLM) enabling features like drag-and-drop CSV import, report generation, chart creation, and database diagram building. The tool utilizes PGlite, a WASM version of Postgres, to run databases in the browser and store data in IndexedDB for persistence. The monorepo includes a frontend built with Next.js and a backend serving S3-backed PGlite databases over the PG wire protocol using pg-gateway.
text-to-sql-bedrock-workshop
This repository focuses on utilizing generative AI to bridge the gap between natural language questions and SQL queries, aiming to improve data consumption in enterprise data warehouses. It addresses challenges in SQL query generation, such as foreign key relationships and table joins, and highlights the importance of accuracy metrics like Execution Accuracy (EX) and Exact Set Match Accuracy (EM). The workshop content covers advanced prompt engineering, Retrieval Augmented Generation (RAG), fine-tuning models, and security measures against prompt and SQL injections.
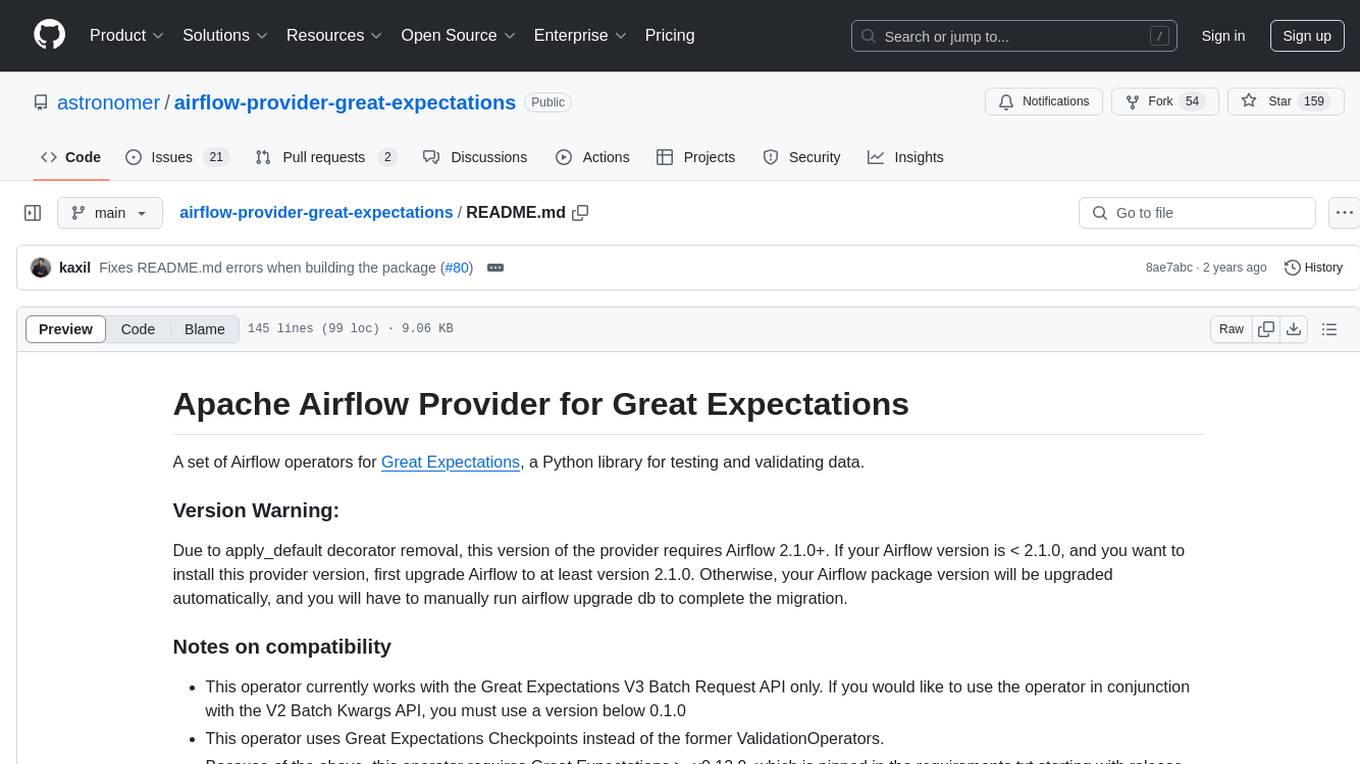
airflow-provider-great-expectations
The 'airflow-provider-great-expectations' repository contains a set of Airflow operators for Great Expectations, a Python library used for testing and validating data. The operators enable users to run Great Expectations validations and checks within Apache Airflow workflows. The package requires Airflow 2.1.0+ and Great Expectations >=v0.13.9. It provides functionalities to work with Great Expectations V3 Batch Request API, Checkpoints, and allows passing kwargs to Checkpoints at runtime. The repository includes modules for a base operator and examples of DAGs with sample tasks demonstrating the operator's functionality.


