
xorq
LETSQL is a deferred compute system focused on smart composition of AI pipelines. Optimize performance with cross-engine caching and static planning. Easily go from research to production with portable UDFs.
Stars: 93
Xorq (formerly LETSQL) is a data processing library built on top of Ibis and DataFusion to write multi-engine data workflows. It provides a flexible and powerful tool for processing and analyzing data from various sources, enabling users to create complex data pipelines and perform advanced data transformations.
README:


Data processing library built on top of Ibis and DataFusion to write multi-engine data workflows.
[!NOTE]
We are changing the name from LETSQL to xorq.
[!CAUTION] This library does not currently have a stable release. Both the API and implementation are subject to change, and future updates may not be backward compatible.
LETSQL is available as xorq on PyPI:
pip install xorqimport urllib.request
import xorq as xq
urllib.request.urlretrieve("https://raw.githubusercontent.com/mwaskom/seaborn-data/master/iris.csv", "iris.csv")
con = xq.connect()
iris_table = con.read_csv("iris.csv", table_name="iris")
res = (
iris_table.filter([iris_table.sepal_length > 5])
.group_by("species")
.agg(iris_table.sepal_width.sum())
.execute()
)for more examples on how to use letsql, check the examples directory,
note that in order to run some of the scripts in there, you need to install the library with examples extra:
pip install 'xorq[examples]'Contributions are welcome and highly appreciated. To get started, check out the contributing guidelines.
If you have any issues with this repository, please don't hesitate to raise them. It is actively maintained, and we will do our best to help you.
This project heavily relies on Ibis and DataFusion.
If you've found this repository helpful, why not give it a star? It's an easy way to show your appreciation and support for the project. Plus, it helps others discover it too!
This repository is licensed under the Apache License
For Tasks:
Click tags to check more tools for each tasksFor Jobs:
Alternative AI tools for xorq
Similar Open Source Tools
xorq
Xorq (formerly LETSQL) is a data processing library built on top of Ibis and DataFusion to write multi-engine data workflows. It provides a flexible and powerful tool for processing and analyzing data from various sources, enabling users to create complex data pipelines and perform advanced data transformations.
arconia
Arconia is a powerful open-source tool for managing and visualizing data in a user-friendly way. It provides a seamless experience for data analysts and scientists to explore, clean, and analyze datasets efficiently. With its intuitive interface and robust features, Arconia simplifies the process of data manipulation and visualization, making it an essential tool for anyone working with data.
datatune
Datatune is a data analysis tool designed to help users explore and analyze datasets efficiently. It provides a user-friendly interface for importing, cleaning, visualizing, and modeling data. With Datatune, users can easily perform tasks such as data preprocessing, feature engineering, model selection, and evaluation. The tool offers a variety of statistical and machine learning algorithms to support data analysis tasks. Whether you are a data scientist, analyst, or researcher, Datatune can streamline your data analysis workflow and help you derive valuable insights from your data.
axolotl
Axolotl is a lightweight and efficient tool for managing and analyzing large datasets. It provides a user-friendly interface for data manipulation, visualization, and statistical analysis. With Axolotl, users can easily import, clean, and explore data to gain valuable insights and make informed decisions. The tool supports various data formats and offers a wide range of functions for data processing and modeling. Whether you are a data scientist, researcher, or business analyst, Axolotl can help streamline your data workflows and enhance your data analysis capabilities.
context7
Context7 is a powerful tool for analyzing and visualizing data in various formats. It provides a user-friendly interface for exploring datasets, generating insights, and creating interactive visualizations. With advanced features such as data filtering, aggregation, and customization, Context7 is suitable for both beginners and experienced data analysts. The tool supports a wide range of data sources and formats, making it versatile for different use cases. Whether you are working on exploratory data analysis, data visualization, or data storytelling, Context7 can help you uncover valuable insights and communicate your findings effectively.
ROGRAG
ROGRAG is a powerful open-source tool designed for data analysis and visualization. It provides a user-friendly interface for exploring and manipulating datasets, making it ideal for researchers, data scientists, and analysts. With ROGRAG, users can easily import, clean, analyze, and visualize data to gain valuable insights and make informed decisions. The tool supports a wide range of data formats and offers a variety of statistical and visualization tools to help users uncover patterns, trends, and relationships in their data. Whether you are working on exploratory data analysis, statistical modeling, or data visualization, ROGRAG is a versatile tool that can streamline your workflow and enhance your data analysis capabilities.
data-juicer
Data-Juicer is a one-stop data processing system to make data higher-quality, juicier, and more digestible for LLMs. It is a systematic & reusable library of 80+ core OPs, 20+ reusable config recipes, and 20+ feature-rich dedicated toolkits, designed to function independently of specific LLM datasets and processing pipelines. Data-Juicer allows detailed data analyses with an automated report generation feature for a deeper understanding of your dataset. Coupled with multi-dimension automatic evaluation capabilities, it supports a timely feedback loop at multiple stages in the LLM development process. Data-Juicer offers tens of pre-built data processing recipes for pre-training, fine-tuning, en, zh, and more scenarios. It provides a speedy data processing pipeline requiring less memory and CPU usage, optimized for maximum productivity. Data-Juicer is flexible & extensible, accommodating most types of data formats and allowing flexible combinations of OPs. It is designed for simplicity, with comprehensive documentation, easy start guides and demo configs, and intuitive configuration with simple adding/removing OPs from existing configs.
ag2
Ag2 is a lightweight and efficient tool for generating automated reports from data sources. It simplifies the process of creating reports by allowing users to define templates and automate the data extraction and formatting. With Ag2, users can easily generate reports in various formats such as PDF, Excel, and CSV, saving time and effort in manual report generation tasks.
HyperAgent
HyperAgent is a powerful tool for automating repetitive tasks in web scraping and data extraction. It provides a user-friendly interface to create custom web scraping scripts without the need for extensive coding knowledge. With HyperAgent, users can easily extract data from websites, transform it into structured formats, and save it for further analysis. The tool supports various data formats and offers scheduling options for automated data extraction at regular intervals. HyperAgent is suitable for individuals and businesses looking to streamline their data collection processes and improve efficiency in extracting information from the web.
simple-data-analysis
Simple data analysis (SDA) is an easy-to-use and high-performance TypeScript library for data analysis. It can be used with tabular and geospatial data. The library is maintained by Nael Shiab, a computational journalist and senior data producer for CBC News. SDA is based on DuckDB, a fast in-process analytical database, and it sends SQL queries to be executed by DuckDB. The library provides methods inspired by Pandas (Python) and the Tidyverse (R), and it also supports writing custom SQL queries and processing data with JavaScript. Additionally, SDA offers methods for leveraging large language models (LLMs) for data cleaning, extraction, categorization, and natural language interaction, as well as for embeddings and semantic search.
agent-pod
Agent POD is a project focused on capturing and storing personal digital data in a user-controlled environment, with the goal of enabling agents to interact with the data. It explores questions related to structuring information, creating an efficient data capture system, integrating with protocols like SOLID, and enabling data storage for groups. The project aims to transition from traditional data-storing apps to a system where personal data is owned and controlled by the user, facilitating the creation of 'solid-first' apps.

upgini
Upgini is an intelligent data search engine with a Python library that helps users find and add relevant features to their ML pipeline from various public, community, and premium external data sources. It automates the optimization of connected data sources by generating an optimal set of machine learning features using large language models, GraphNNs, and recurrent neural networks. The tool aims to simplify feature search and enrichment for external data to make it a standard approach in machine learning pipelines. It democratizes access to data sources for the data science community.
clewdr
Clewdr is a collaborative platform for data analysis and visualization. It allows users to upload datasets, perform various data analysis tasks, and create interactive visualizations. The platform supports multiple users working on the same project simultaneously, enabling real-time collaboration and sharing of insights. Clewdr is designed to streamline the data analysis process and facilitate communication among team members. With its user-friendly interface and powerful features, Clewdr is suitable for data scientists, analysts, researchers, and anyone working with data to gain valuable insights and make informed decisions.
redb-open
reDB Node is a distributed, policy-driven data mesh platform that enables True Data Portability across various databases, warehouses, clouds, and environments. It unifies data access, data mobility, and schema transformation into one open platform. Built for developers, architects, and AI systems, reDB addresses the challenges of fragmented data ecosystems in modern enterprises by providing multi-database interoperability, automated schema versioning, zero-downtime migration, real-time developer data environments with obfuscation, quantum-resistant encryption, and policy-based access control. The project aims to build a foundation for future-proof data infrastructure.
DB-GPT
DB-GPT is an open source AI native data app development framework with AWEL(Agentic Workflow Expression Language) and agents. It aims to build infrastructure in the field of large models, through the development of multiple technical capabilities such as multi-model management (SMMF), Text2SQL effect optimization, RAG framework and optimization, Multi-Agents framework collaboration, AWEL (agent workflow orchestration), etc. Which makes large model applications with data simpler and more convenient.
unstructured
The `unstructured` library provides open-source components for ingesting and pre-processing images and text documents, such as PDFs, HTML, Word docs, and many more. The use cases of `unstructured` revolve around streamlining and optimizing the data processing workflow for LLMs. `unstructured` modular functions and connectors form a cohesive system that simplifies data ingestion and pre-processing, making it adaptable to different platforms and efficient in transforming unstructured data into structured outputs.
For similar tasks
Azure-Analytics-and-AI-Engagement
The Azure-Analytics-and-AI-Engagement repository provides packaged Industry Scenario DREAM Demos with ARM templates (Containing a demo web application, Power BI reports, Synapse resources, AML Notebooks etc.) that can be deployed in a customer’s subscription using the CAPE tool within a matter of few hours. Partners can also deploy DREAM Demos in their own subscriptions using DPoC.
sorrentum
Sorrentum is an open-source project that aims to combine open-source development, startups, and brilliant students to build machine learning, AI, and Web3 / DeFi protocols geared towards finance and economics. The project provides opportunities for internships, research assistantships, and development grants, as well as the chance to work on cutting-edge problems, learn about startups, write academic papers, and get internships and full-time positions at companies working on Sorrentum applications.
tidb
TiDB is an open-source distributed SQL database that supports Hybrid Transactional and Analytical Processing (HTAP) workloads. It is MySQL compatible and features horizontal scalability, strong consistency, and high availability.

zep-python
Zep is an open-source platform for building and deploying large language model (LLM) applications. It provides a suite of tools and services that make it easy to integrate LLMs into your applications, including chat history memory, embedding, vector search, and data enrichment. Zep is designed to be scalable, reliable, and easy to use, making it a great choice for developers who want to build LLM-powered applications quickly and easily.
telemetry-airflow
This repository codifies the Airflow cluster that is deployed at workflow.telemetry.mozilla.org (behind SSO) and commonly referred to as "WTMO" or simply "Airflow". Some links relevant to users and developers of WTMO: * The `dags` directory in this repository contains some custom DAG definitions * Many of the DAGs registered with WTMO don't live in this repository, but are instead generated from ETL task definitions in bigquery-etl * The Data SRE team maintains a WTMO Developer Guide (behind SSO)
mojo
Mojo is a new programming language that bridges the gap between research and production by combining Python syntax and ecosystem with systems programming and metaprogramming features. Mojo is still young, but it is designed to become a superset of Python over time.
pandas-ai
PandasAI is a Python library that makes it easy to ask questions to your data in natural language. It helps you to explore, clean, and analyze your data using generative AI.
databend
Databend is an open-source cloud data warehouse that serves as a cost-effective alternative to Snowflake. With its focus on fast query execution and data ingestion, it's designed for complex analysis of the world's largest datasets.
For similar jobs
databerry
Chaindesk is a no-code platform that allows users to easily set up a semantic search system for personal data without technical knowledge. It supports loading data from various sources such as raw text, web pages, files (Word, Excel, PowerPoint, PDF, Markdown, Plain Text), and upcoming support for web sites, Notion, and Airtable. The platform offers a user-friendly interface for managing datastores, querying data via a secure API endpoint, and auto-generating ChatGPT Plugins for each datastore. Chaindesk utilizes a Vector Database (Qdrant), Openai's text-embedding-ada-002 for embeddings, and has a chunk size of 1024 tokens. The technology stack includes Next.js, Joy UI, LangchainJS, PostgreSQL, Prisma, and Qdrant, inspired by the ChatGPT Retrieval Plugin.
OAD
OAD is a powerful open-source tool for analyzing and visualizing data. It provides a user-friendly interface for exploring datasets, generating insights, and creating interactive visualizations. With OAD, users can easily import data from various sources, clean and preprocess data, perform statistical analysis, and create customizable visualizations to communicate findings effectively. Whether you are a data scientist, analyst, or researcher, OAD can help you streamline your data analysis workflow and uncover valuable insights from your data.
sqlcoder
Defog's SQLCoder is a family of state-of-the-art large language models (LLMs) designed for converting natural language questions into SQL queries. It outperforms popular open-source models like gpt-4 and gpt-4-turbo on SQL generation tasks. SQLCoder has been trained on more than 20,000 human-curated questions based on 10 different schemas, and the model weights are licensed under CC BY-SA 4.0. Users can interact with SQLCoder through the 'transformers' library and run queries using the 'sqlcoder launch' command in the terminal. The tool has been tested on NVIDIA GPUs with more than 16GB VRAM and Apple Silicon devices with some limitations. SQLCoder offers a demo on their website and supports quantized versions of the model for consumer GPUs with sufficient memory.
TableLLM
TableLLM is a large language model designed for efficient tabular data manipulation tasks in real office scenarios. It can generate code solutions or direct text answers for tasks like insert, delete, update, query, merge, and chart operations on tables embedded in spreadsheets or documents. The model has been fine-tuned based on CodeLlama-7B and 13B, offering two scales: TableLLM-7B and TableLLM-13B. Evaluation results show its performance on benchmarks like WikiSQL, Spider, and self-created table operation benchmark. Users can use TableLLM for code and text generation tasks on tabular data.
mlcraft
Synmetrix (prev. MLCraft) is an open source data engineering platform and semantic layer for centralized metrics management. It provides a complete framework for modeling, integrating, transforming, aggregating, and distributing metrics data at scale. Key features include data modeling and transformations, semantic layer for unified data model, scheduled reports and alerts, versioning, role-based access control, data exploration, caching, and collaboration on metrics modeling. Synmetrix leverages Cube (Cube.js) for flexible data models that consolidate metrics from various sources, enabling downstream distribution via a SQL API for integration into BI tools, reporting, dashboards, and data science. Use cases include data democratization, business intelligence, embedded analytics, and enhancing accuracy in data handling and queries. The tool speeds up data-driven workflows from metrics definition to consumption by combining data engineering best practices with self-service analytics capabilities.
data-scientist-roadmap2024
The Data Scientist Roadmap2024 provides a comprehensive guide to mastering essential tools for data science success. It includes programming languages, machine learning libraries, cloud platforms, and concepts categorized by difficulty. The roadmap covers a wide range of topics from programming languages to machine learning techniques, data visualization tools, and DevOps/MLOps tools. It also includes web development frameworks and specific concepts like supervised and unsupervised learning, NLP, deep learning, reinforcement learning, and statistics. Additionally, it delves into DevOps tools like Airflow and MLFlow, data visualization tools like Tableau and Matplotlib, and other topics such as ETL processes, optimization algorithms, and financial modeling.
VMind
VMind is an open-source solution for intelligent visualization, providing an intelligent chart component based on LLM by VisActor. It allows users to create chart narrative works with natural language interaction, edit charts through dialogue, and export narratives as videos or GIFs. The tool is easy to use, scalable, supports various chart types, and offers one-click export functionality. Users can customize chart styles, specify themes, and aggregate data using LLM models. VMind aims to enhance efficiency in creating data visualization works through dialogue-based editing and natural language interaction.
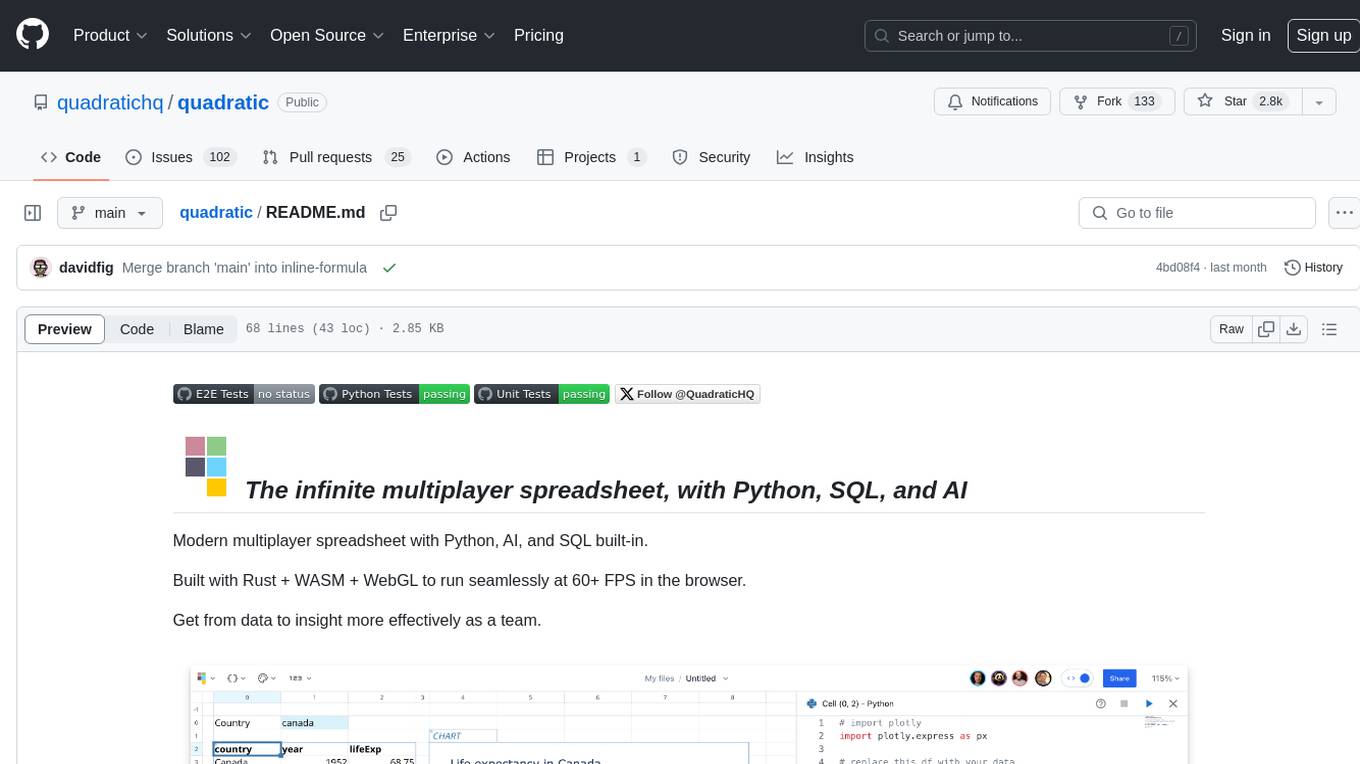
quadratic
Quadratic is a modern multiplayer spreadsheet application that integrates Python, AI, and SQL functionalities. It aims to streamline team collaboration and data analysis by enabling users to pull data from various sources and utilize popular data science tools. The application supports building dashboards, creating internal tools, mixing data from different sources, exploring data for insights, visualizing Python workflows, and facilitating collaboration between technical and non-technical team members. Quadratic is built with Rust + WASM + WebGL to ensure seamless performance in the browser, and it offers features like WebGL Grid, local file management, Python and Pandas support, Excel formula support, multiplayer capabilities, charts and graphs, and team support. The tool is currently in Beta with ongoing development for additional features like JS support, SQL database support, and AI auto-complete.