
LLM-Geo
None
Stars: 298
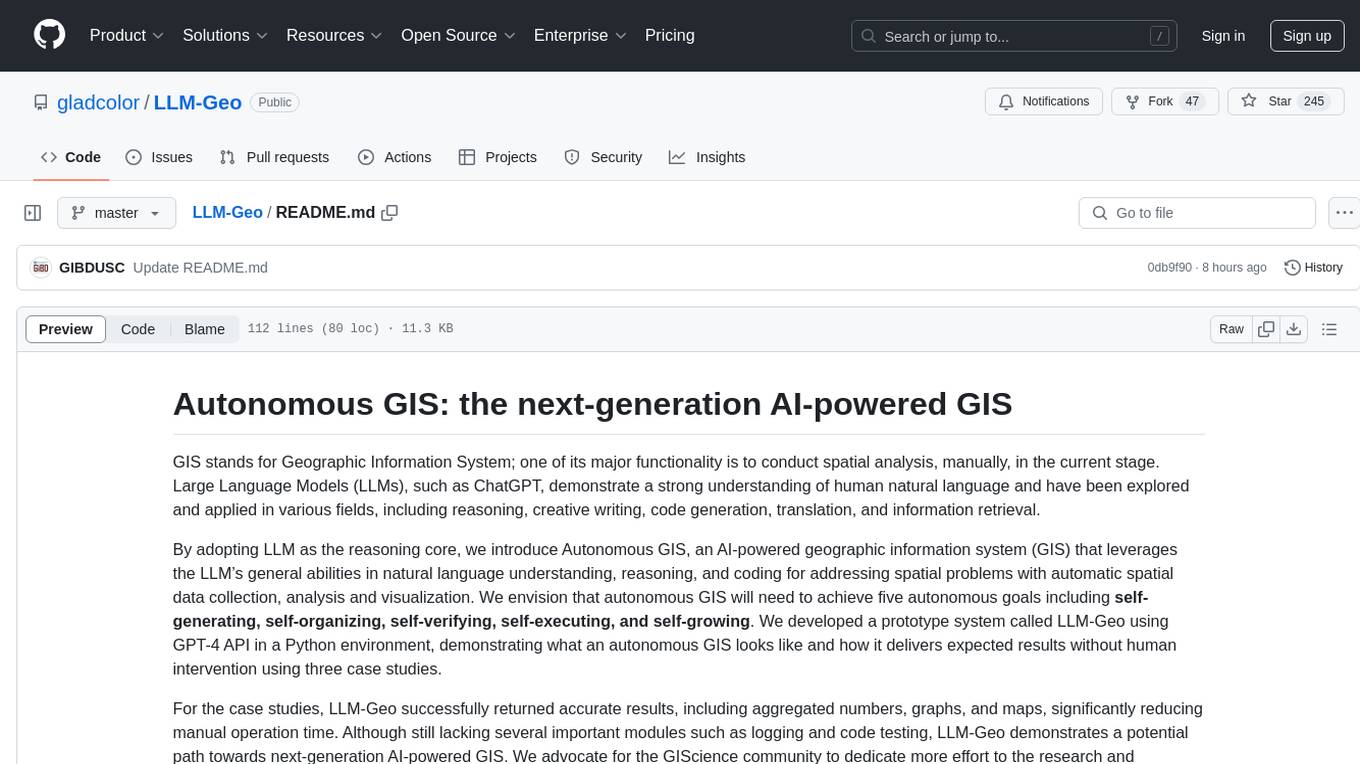
LLM-Geo is an AI-powered geographic information system (GIS) that leverages Large Language Models (LLMs) for automatic spatial data collection, analysis, and visualization. By adopting LLM as the reasoning core, it addresses spatial problems with self-generating, self-organizing, self-verifying, self-executing, and self-growing capabilities. The tool aims to make spatial analysis easier, faster, and more accessible by reducing manual operation time and delivering accurate results through case studies. It uses GPT-4 API in a Python environment and advocates for further research and development in autonomous GIS.
README:
GIS stands for Geographic Information System; one of its major functionality is to conduct spatial analysis, manually, in the current stage. Large Language Models (LLMs), such as ChatGPT, demonstrate a strong understanding of human natural language and have been explored and applied in various fields, including reasoning, creative writing, code generation, translation, and information retrieval.
By adopting LLM as the reasoning core, we introduce Autonomous GIS, an AI-powered geographic information system (GIS) that leverages the LLM’s general abilities in natural language understanding, reasoning, and coding for addressing spatial problems with automatic spatial data collection, analysis and visualization. We envision that autonomous GIS will need to achieve five autonomous goals, including self-generating, self-organizing, self-verifying, self-executing, and self-growing. We developed a prototype system called LLM-Geo using GPT-4 API in a Python environment, demonstrating what an autonomous GIS looks like and how it delivers expected results without human intervention using three case studies.
For the case studies, LLM-Geo successfully returned accurate results, including aggregated numbers, graphs, and maps, significantly reducing manual operation time. Although still lacking several important modules, such as logging and code testing, LLM-Geo demonstrates a potential path toward next-generation AI-powered GIS. We advocate for the GIScience community to dedicate more effort to the research and development of autonomous GIS, making spatial analysis easier, faster, and more accessible to a broader audience.
Check out the published paper here: Autonomous GIS: the next-generation AI-powered GIS. Recommended citation format: Li Z., Ning H., 2023. Autonomous GIS: the next-generation AI-powered GIS. Interntional Journal of Digital Earth. https://doi.org/10.1080/17538947.2023.2278895
Note: We are still developing LLM-Geo, and the ideas presented in the paper may change due to the rapid development of AI. For instance, the token limitation appears to have been overcome by Claude (released on 2023-05-11). We hope LLM-Geo can inspire GIScience professionals to further investigate on autonomous GIS.
Clone or download the repository, rename your_config.ini as config.ini. Then, put your OpenAI API key in the config.ini file. Please use GPT-4, the lower versions such as 3.5 do no have enough reasoning ability to generate correct solution graph and operation code. Till Dec. 26, "o1" models do not have the full features of "gpt-4o" models, such as "system prompt", so LLM-Geo uses "gpt-4o".
If you have difficulties installing GeoPandas in Windows, refer to this post.
- Download all files, put your question to the
TASKvariable in LLM-Geo4.ipynb. - Set the
task_namein the notebook. Space is not allowed. LLM-Geo will create the fold using thetask_nameto save results. - Run all cells.
- LLM-Geo will use the backed LLM (GPT-4 now) to review and debug the generated program. GPT-4's debugging ability is still weak. The default maximum attempt count is set to 10; modify this value is needed.
- Note that the solution based on graph, code review, and debug will cost a lot of tokens. We provide a Jupyter notebook (Direct_request_LLM.ipynb) to directly request solutions from LLM. This is a much more quick way to get solutions for simple tasks/questions, but its robustness may be slightly lower.
These case studies are designed to show the concepts of autonomous GIS. Please use GPT-4; the lower version of GPT will fail to generate the correct code and results. Note every time GPT-4 generates different outputs, your results may look different. Per our test, the generated program may not succeed every time, but there is about an 80% chance to run successfully. If you input the generated prompts to the ChatGPT-4 chat box rather than API, the success rate will be much higher. We will improve the overall workflow of LLM-Geo, currently we do not push the entire historical conversation (i.e., sufficient information) to the GPT-4 API.
Video demonstrations for the case studies
Case 1: https://youtu.be/ot9oA_6Llys
Case 2: https://youtu.be/ut4XkMcqgvQ
Case 3: https://youtu.be/4q0a9xKk8Ug
This spatial problem is to find out the population living with hazardous wastes and map their distribution. The study area is North Carolina, United States (US). We input the task (question) to LLM-Geo as:
Task:
1) Find out the total population that lives within a tract that contains hazardous waste facilities. The study area is North Carolina, US.
2) Generate a map to show the spatial distribution of the population at the tract level and highlight the borders of tracts that have hazardous waste facilities.

Data locations:
1. NC hazardous waste facility ESRI shape file location: https://github.com/gladcolor/LLM- Geo/raw/master/overlay_analysis/Hazardous_Waste_Sites.zip
2. NC tract boundary shapefile location: https://github.com/gladcolor/LLM-Geo/raw/master/overlay_analysis/tract_shp_37.zip. The tract id column is 'Tract'.
3. NC tract population CSV file location: https://github.com/gladcolor/LLM-Geo/raw/master/overlay_analysis/NC_tract_population.csv. The population is stored in the 'TotalPopulation' column. The tract ID column is 'GEOID'
The results are: (a) Solution graph, (b) assembly program (Python codes), and (c) returned population count and generated map.

NOTE: Please ignore this case since the involved API has been shut down.
This task is to investigate the mobility changes during COVID-19 pandemic in France 2020. First, we asked LLM-Geo to retrieve mobility data from the ODT Explorer using REST API, and then compute and visualize the monthly change rate compared to January 2020. We input the task (question) to LLM-Geo as follows:
Task:
1) Show the monthly change rates of population mobility for each administrative regions in a France map. Each month is a sub-map in a map matrix. The base of the change rate is January 2020.
2) Draw a line chart to show the monthly change rate trends of all administrative regions.

Data locations:
1. ESRI shapefile for France administrative regions: https://github.com/gladcolor/LLM-Geo/raw/master/REST_API/France.zip. The 'GID_1' column is the administrative region code, 'NAME_1' column is the administrative region name.
2. REST API URL with parameters for mobility data access: http://gis.cas.sc.edu/GeoAnalytics/REST?operation=get_daily_movement_for_all_places&source=twitter&scale=world_first_level_admin&begin=01/01/2020&end=12/31/2020. The response is in CSV format. There are three columns in the response: place, date (format:2020-01-07), and intra_movement. 'place' column is the administrative region code, France administrative regions start with 'FRA'.
The results are: (a) Solution graph, (b) map matrix showing the spatial distribution of mobility change rate, (c) line chart showing the trend of the mobility change rate, (d) assembly program.

Note: The ODT explorer API needs to be woken up before being used. Simple open this URL: http://gis.cas.sc.edu/GeoAnalytics/od.html in your browser, then fresh the webpage until you see the flows counts like bellow:

The spatial problem for this case is to investigate the spatial distribution of the COVID-19 death rate (ratio of COVID-19 deaths to cases) and the association between the death rate and the proportion of senior residents (age >=65) at the US county level. The death rate is derived from the accumulated COVID-19 data as of December 31, 2020, available from New York Times (2023), based on state and local health agency reports. The population data is extracted from the 2020 ACS five-year estimates (US Census Bureau 2022). The task asks for a map to show the county level death rate distribution and a scatter plot to show the correlation and trend line of the death rate with the senior resident rate. We input the task (question) to LLM-Geo as:
Task:
1) Draw a map to show the death rate (death/case) of COVID-19 among the contiguous US counties. Use the accumulated COVID-19 data of 2020.12.31 to compute the death rate. Use scheme ='quantiles' when plotting the map.  Set map projection to 'Conus Albers'. Set map size to 15*10 inches.
2) Draw a scatter plot to show the correlation and trend line of the death rate with the senior resident rate, including the r-square and p-value. Set data point transparency to 50%, regression line as red.  Set figure size to 15*10 inches.

Data locations:
1) COVID-19 data case in 2020 (county-level): https://github.com/nytimes/covid-19-data/raw/master/us-counties-2020.csv. This data is for daily accumulated COVID cases and deaths for each county in the US. There are 5 columns: date (format: 2021-02-01), county, state, fips, cases, deaths.
2) Contiguous US county boundary (ESRI shapefile): https://github.com/gladcolor/spatial_data/raw/master/contiguous_counties.zip. The county FIPS column is 'GEOID'.
3) Census data (ACS2020): https://raw.githubusercontent.com/gladcolor/spatial_data/master/Demography/ACS2020_5year_county.csv. The needed columns are: 'FIPS', 'Total Population', 'Total Population: 65 to 74 Years', 'Total Population: 75 to 84 Years', 'Total Population: 85 Years and Over'.
The results are: (a) Solution graph, (b) county level death rate map of the contiguous US, (c) scatter plot showing the association between COVID-19 death rate and the senior resident rate at the county level, (d) assembly program.

Understand the architecture of LLM-Geo might help you customize it or develop you own autonomous GIS agents; here is a brief introduction of the architecture.
- An autonomous GIS agent framework for geospatial data retrieval https://github.com/gladcolor/LLM-Find https://github.com/Teakinboyewa/AutonomousGIS_GeodataRetrieverAgent
- Test the integration of LLM-Geo with QGIS. https://github.com/Teakinboyewa/AutonomousGIS_GeodataRetrieverAgent
- Test with more case studies(Working on it).
- Improve the prompt generation.
- Implement an autonomous data understanding module (Done).
- Implement an autonomous data visualization module. (Working on another cartograph agent)
- Develop a web-based front-end user interface (Working on it).
- Integrate and evaluate the open source LLM Meta Llama 3 (8B and 70B) as an alternative reasoning core in LLM-Geo.
- You may need the geopandas package to load vector files. Please install it in advance.
- There are two implementations: Jupyter Notebook and the QGIS plugin. Please try them out!
- Our team is still developing LLM-Geo and has added the data overview module so that users do not need to specify the names of the needed fields in the data or task description. Please go to the develop branch to test our experimental features!
For Tasks:
Click tags to check more tools for each tasksFor Jobs:
Alternative AI tools for LLM-Geo
Similar Open Source Tools

LLM-Geo
LLM-Geo is an AI-powered geographic information system (GIS) that leverages Large Language Models (LLMs) for automatic spatial data collection, analysis, and visualization. By adopting LLM as the reasoning core, it addresses spatial problems with self-generating, self-organizing, self-verifying, self-executing, and self-growing capabilities. The tool aims to make spatial analysis easier, faster, and more accessible by reducing manual operation time and delivering accurate results through case studies. It uses GPT-4 API in a Python environment and advocates for further research and development in autonomous GIS.
long-context-attention
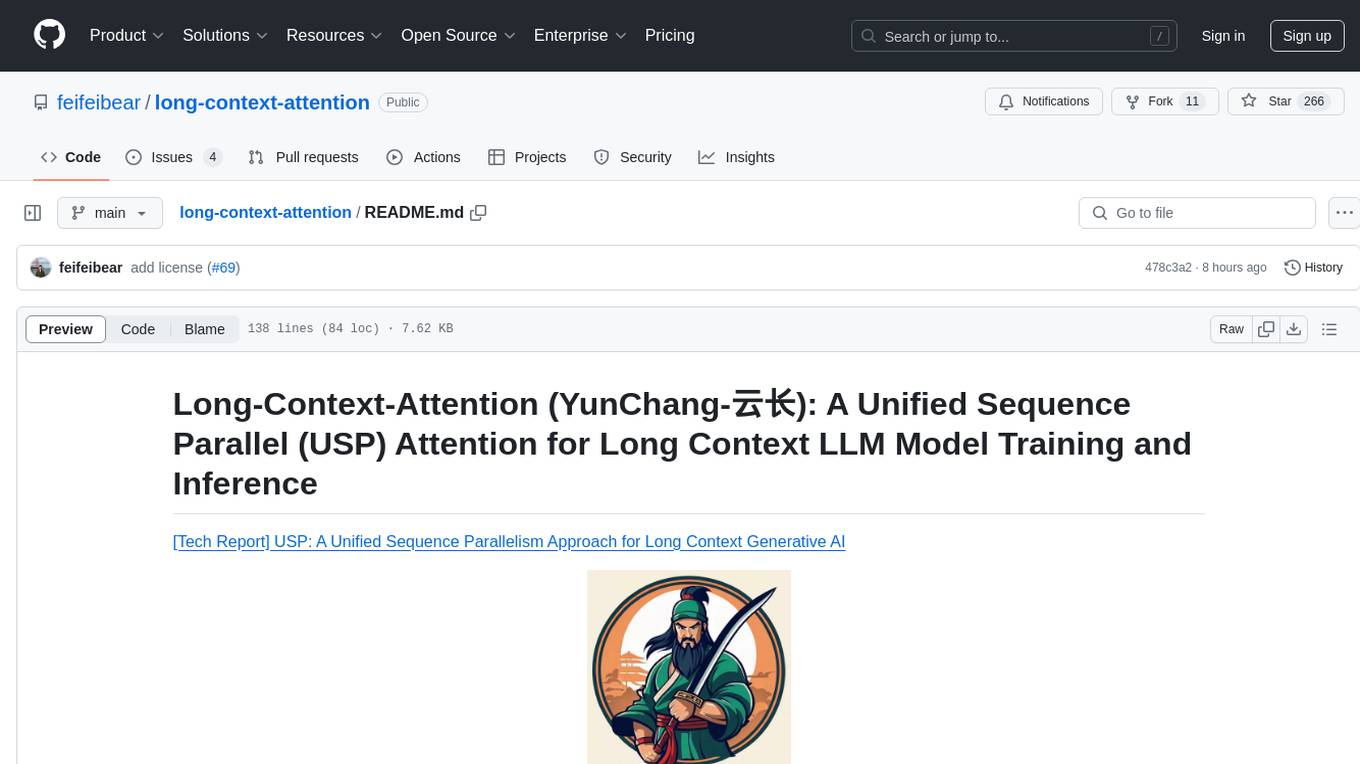
Long-Context-Attention (YunChang) is a unified sequence parallel approach that combines the strengths of DeepSpeed-Ulysses-Attention and Ring-Attention to provide a versatile and high-performance solution for long context LLM model training and inference. It addresses the limitations of both methods by offering no limitation on the number of heads, compatibility with advanced parallel strategies, and enhanced performance benchmarks. The tool is verified in Megatron-LM and offers best practices for 4D parallelism, making it suitable for various attention mechanisms and parallel computing advancements.
llama3_interpretability_sae
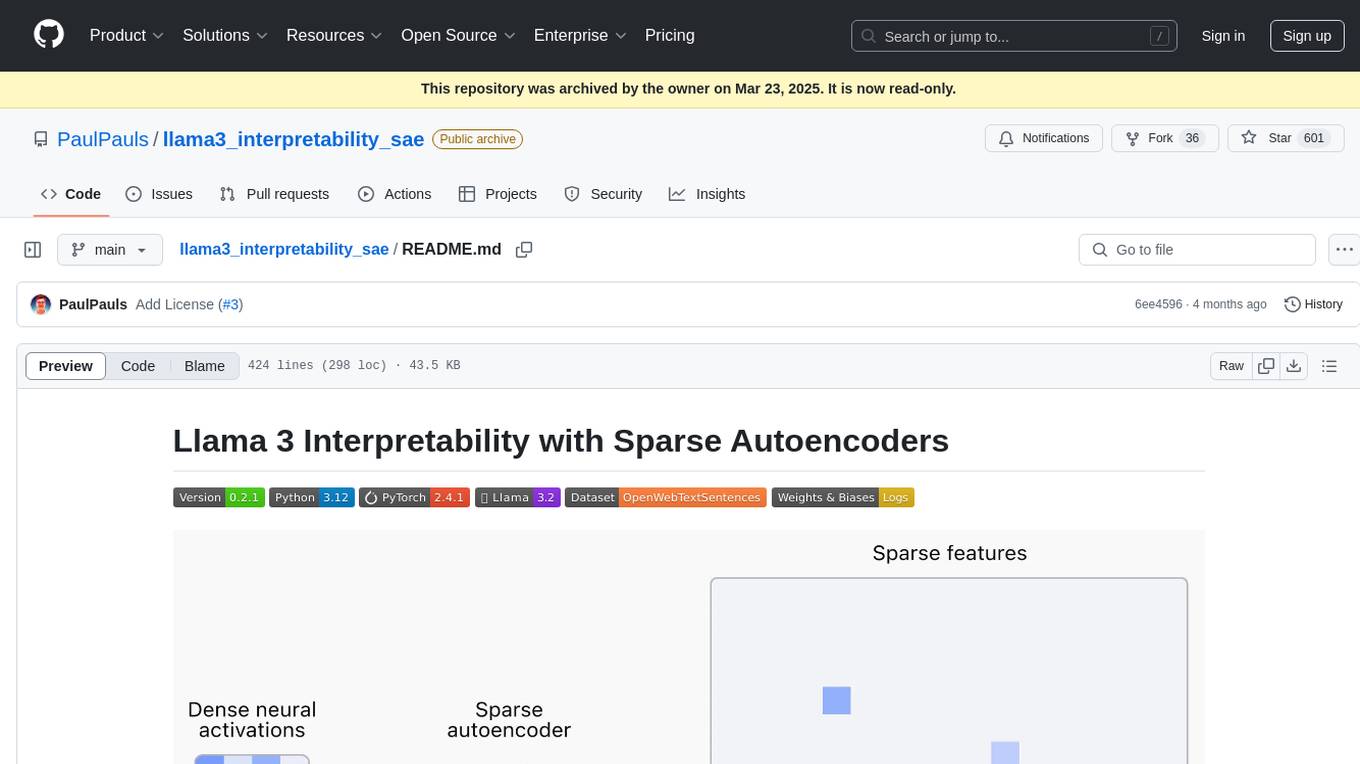
This project focuses on implementing Sparse Autoencoders (SAEs) for mechanistic interpretability in Large Language Models (LLMs) like Llama 3.2-3B. The SAEs aim to untangle superimposed representations in LLMs into separate, interpretable features for each neuron activation. The project provides an end-to-end pipeline for capturing training data, training the SAEs, analyzing learned features, and verifying results experimentally. It includes comprehensive logging, visualization, and checkpointing of SAE training, interpretability analysis tools, and a pure PyTorch implementation of Llama 3.1/3.2 chat and text completion. The project is designed for scalability, efficiency, and maintainability.
LongRoPE
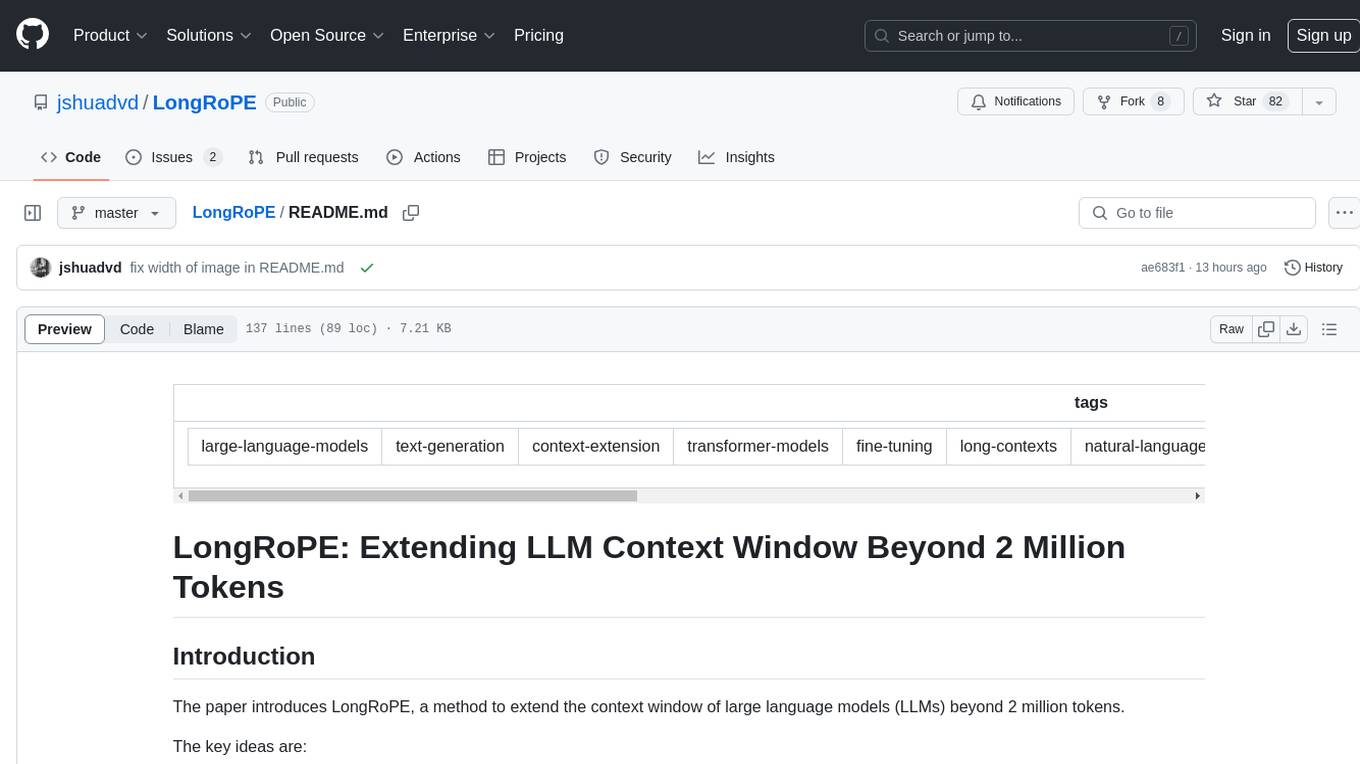
LongRoPE is a method to extend the context window of large language models (LLMs) beyond 2 million tokens. It identifies and exploits non-uniformities in positional embeddings to enable 8x context extension without fine-tuning. The method utilizes a progressive extension strategy with 256k fine-tuning to reach a 2048k context. It adjusts embeddings for shorter contexts to maintain performance within the original window size. LongRoPE has been shown to be effective in maintaining performance across various tasks from 4k to 2048k context lengths.
LLM-RGB
LLM-RGB is a repository containing a collection of detailed test cases designed to evaluate the reasoning and generation capabilities of Language Learning Models (LLMs) in complex scenarios. The benchmark assesses LLMs' performance in understanding context, complying with instructions, and handling challenges like long context lengths, multi-step reasoning, and specific response formats. Each test case evaluates an LLM's output based on context length difficulty, reasoning depth difficulty, and instruction compliance difficulty, with a final score calculated for each test case. The repository provides a score table, evaluation details, and quick start guide for running evaluations using promptfoo testing tools.

matchem-llm
A public repository collecting links to state-of-the-art training sets, QA, benchmarks and other evaluations for various ML and LLM applications in materials science and chemistry. It includes datasets related to chemistry, materials, multimodal data, and knowledge graphs in the field. The repository aims to provide resources for training and evaluating machine learning models in the materials science and chemistry domains.
LLM-Viewer
LLM-Viewer is a tool for visualizing Language and Learning Models (LLMs) and analyzing performance on different hardware platforms. It enables network-wise analysis, considering factors such as peak memory consumption and total inference time cost. With LLM-Viewer, users can gain valuable insights into LLM inference and performance optimization. The tool can be used in a web browser or as a command line interface (CLI) for easy configuration and visualization. The ongoing project aims to enhance features like showing tensor shapes, expanding hardware platform compatibility, and supporting more LLMs with manual model graph configuration.
marlin
Marlin is a highly optimized FP16xINT4 matmul kernel designed for large language model (LLM) inference, offering close to ideal speedups up to batchsizes of 16-32 tokens. It is suitable for larger-scale serving, speculative decoding, and advanced multi-inference schemes like CoT-Majority. Marlin achieves optimal performance by utilizing various techniques and optimizations to fully leverage GPU resources, ensuring efficient computation and memory management.
Nucleoid
Nucleoid is a declarative (logic) runtime environment that manages both data and logic under the same runtime. It uses a declarative programming paradigm, which allows developers to focus on the business logic of the application, while the runtime manages the technical details. This allows for faster development and reduces the amount of code that needs to be written. Additionally, the sharding feature can help to distribute the load across multiple instances, which can further improve the performance of the system.
kaapana
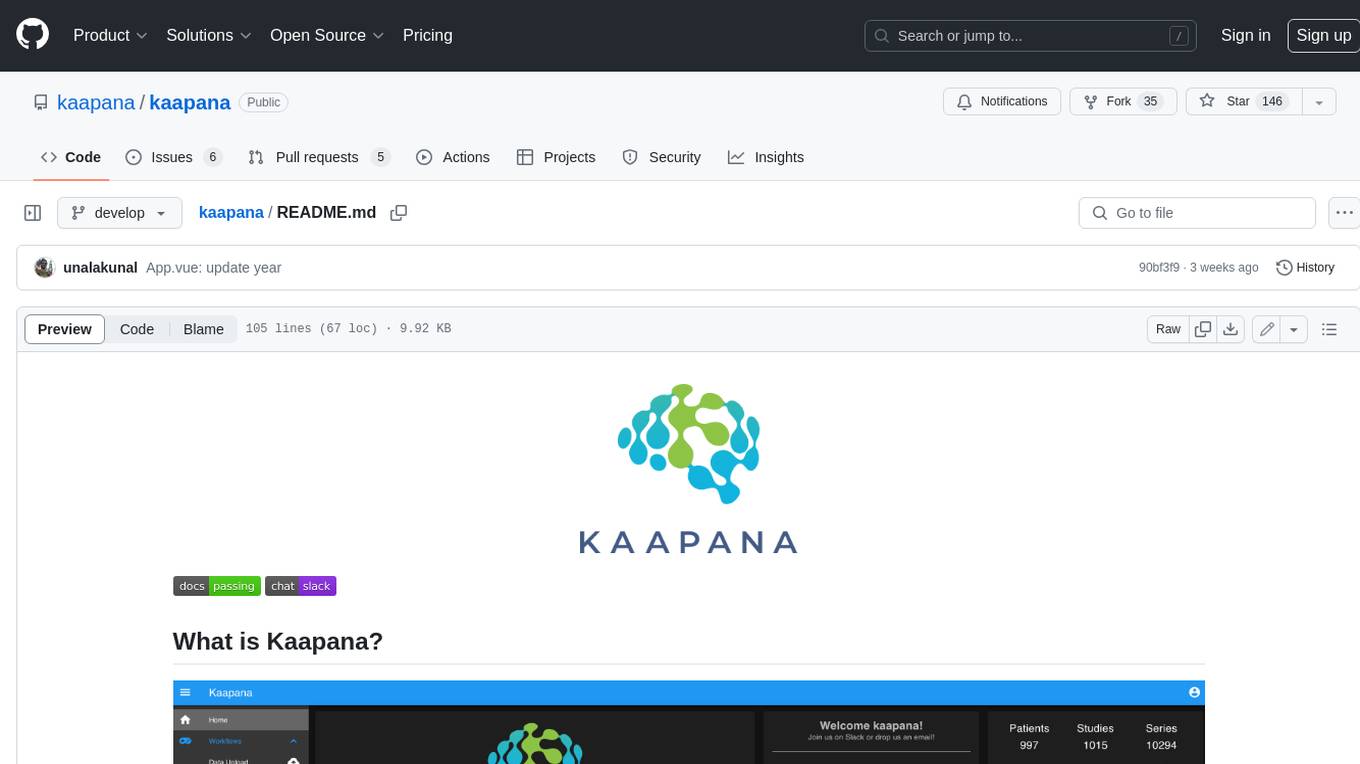
Kaapana is an open-source toolkit for state-of-the-art platform provisioning in the field of medical data analysis. The applications comprise AI-based workflows and federated learning scenarios with a focus on radiological and radiotherapeutic imaging. Obtaining large amounts of medical data necessary for developing and training modern machine learning methods is an extremely challenging effort that often fails in a multi-center setting, e.g. due to technical, organizational and legal hurdles. A federated approach where the data remains under the authority of the individual institutions and is only processed on-site is, in contrast, a promising approach ideally suited to overcome these difficulties. Following this federated concept, the goal of Kaapana is to provide a framework and a set of tools for sharing data processing algorithms, for standardized workflow design and execution as well as for performing distributed method development. This will facilitate data analysis in a compliant way enabling researchers and clinicians to perform large-scale multi-center studies. By adhering to established standards and by adopting widely used open technologies for private cloud development and containerized data processing, Kaapana integrates seamlessly with the existing clinical IT infrastructure, such as the Picture Archiving and Communication System (PACS), and ensures modularity and easy extensibility.
IKBT
IKBT is a Python-based system for generating closed-form solutions to the manipulator inverse kinematics problem using behavior trees for action selection. Solutions are fully symbolic and are output as LaTex, Python, and C++. The tool automates closed-form kinematics solving by organizing solution algorithms in a behavior tree, incorporating frequently used knowledge, generating a dependency graph of joint variables, and providing features for automatic documentation and code generation. It is implemented in Python with minimal dependencies outside of the standard Python distribution.
param
PARAM Benchmarks is a repository of communication and compute micro-benchmarks as well as full workloads for evaluating training and inference platforms. It complements commonly used benchmarks by focusing on AI training with PyTorch based collective benchmarks, GEMM, embedding lookup, linear layer, and DLRM communication patterns. The tool bridges the gap between stand-alone C++ benchmarks and PyTorch/Tensorflow based application benchmarks, providing deep insights into system architecture and framework-level overheads.
llvm-aie
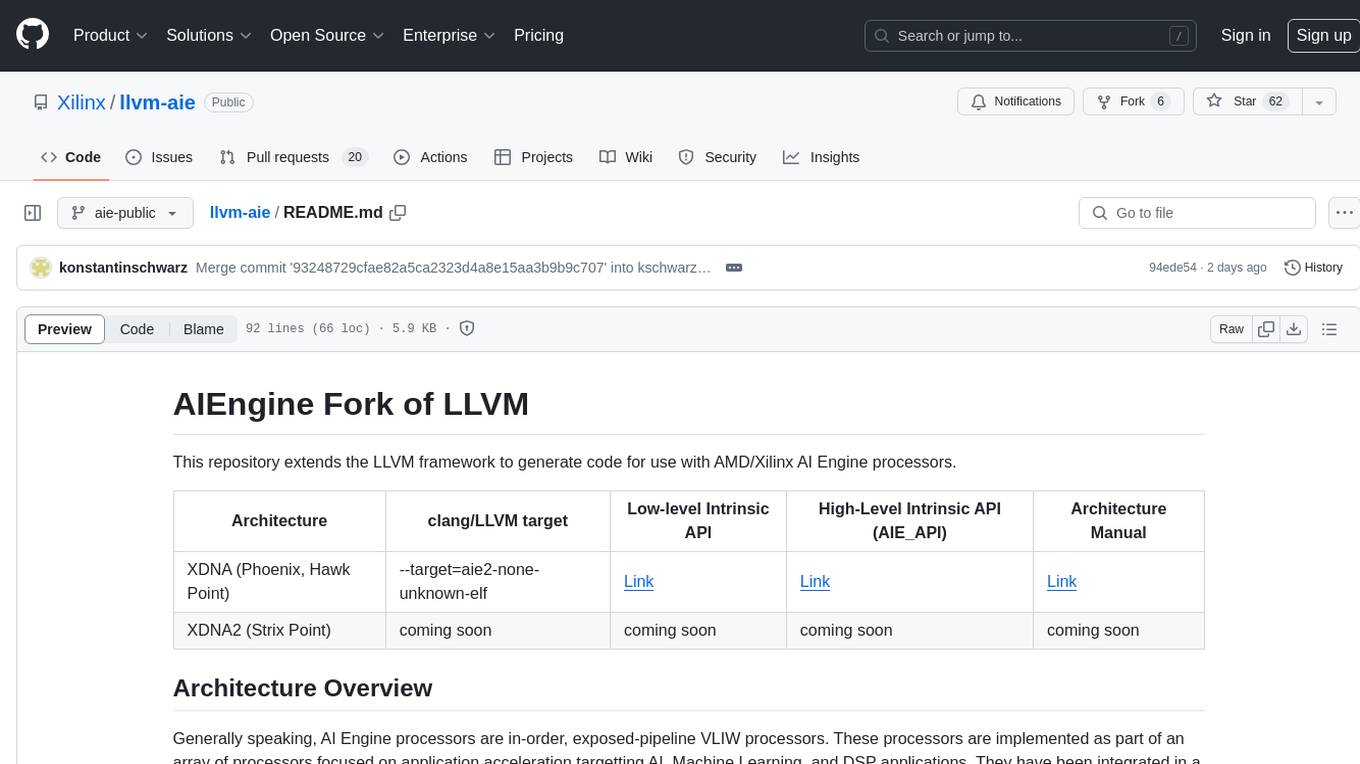
This repository extends the LLVM framework to generate code for use with AMD/Xilinx AI Engine processors. AI Engine processors are in-order, exposed-pipeline VLIW processors focused on application acceleration for AI, Machine Learning, and DSP applications. The repository adds LLVM support for specific features like non-power of 2 pointers, operand latencies, resource conflicts, negative operand latencies, slot assignment, relocations, code alignment restrictions, and register allocation. It includes support for Clang, LLD, binutils, Compiler-RT, and LLVM-LIBC.

Me-LLaMA
Me LLaMA introduces a suite of open-source medical Large Language Models (LLMs), including Me LLaMA 13B/70B and their chat-enhanced versions. Developed through innovative continual pre-training and instruction tuning, these models leverage a vast medical corpus comprising PubMed papers, medical guidelines, and general domain data. Me LLaMA sets new benchmarks on medical reasoning tasks, making it a significant asset for medical NLP applications and research. The models are intended for computational linguistics and medical research, not for clinical decision-making without validation and regulatory approval.
DevOpsGPT
DevOpsGPT is an AI-driven software development automation solution that combines Large Language Models (LLM) with DevOps tools to convert natural language requirements into working software. It improves development efficiency by eliminating the need for tedious requirement documentation, shortens development cycles, reduces communication costs, and ensures high-quality deliverables. The Enterprise Edition offers features like existing project analysis, professional model selection, and support for more DevOps platforms. The tool automates requirement development, generates interface documentation, provides pseudocode based on existing projects, facilitates code refinement, enables continuous integration, and supports software version release. Users can run DevOpsGPT with source code or Docker, and the tool comes with limitations in precise documentation generation and understanding existing project code. The product roadmap includes accurate requirement decomposition, rapid import of development requirements, and integration of more software engineering and professional tools for efficient software development tasks under AI planning and execution.
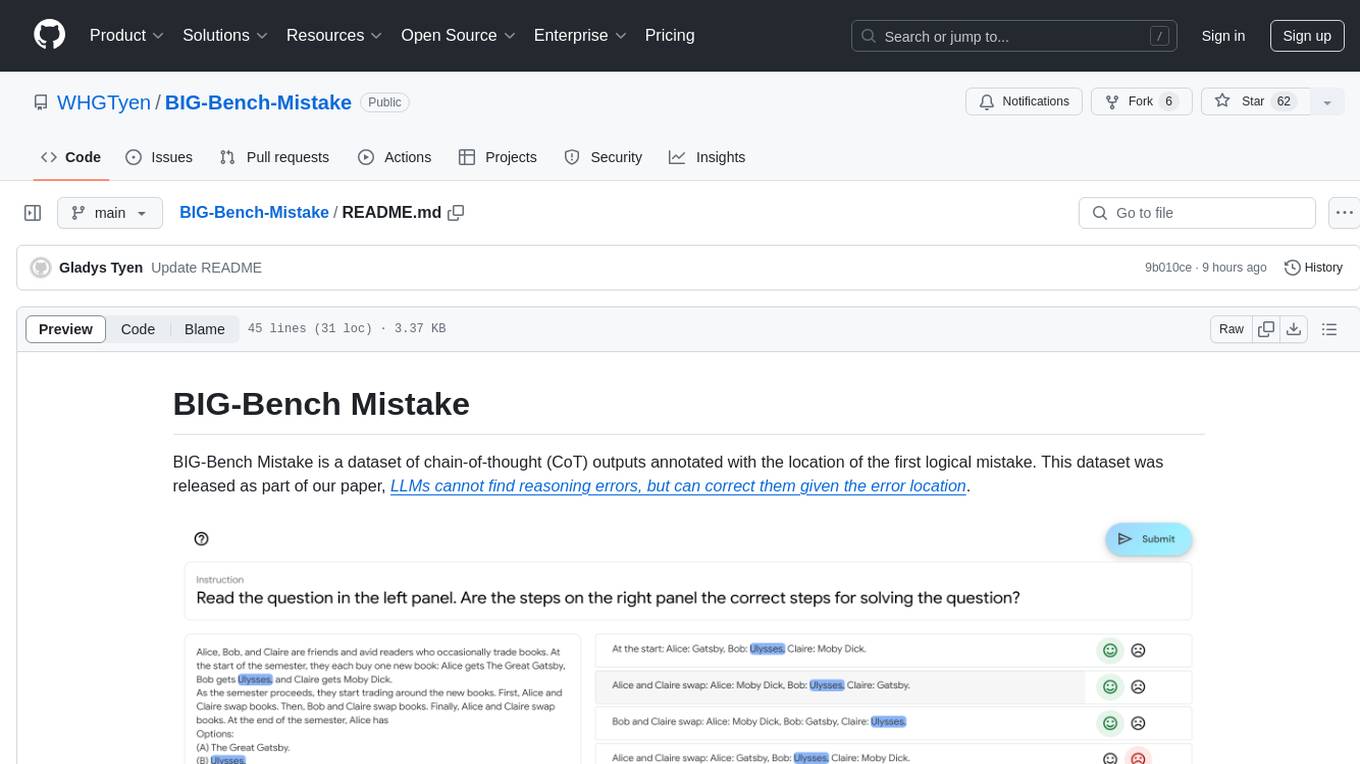
BIG-Bench-Mistake
BIG-Bench Mistake is a dataset of chain-of-thought (CoT) outputs annotated with the location of the first logical mistake. It was released as part of a research paper focusing on benchmarking LLMs in terms of their mistake-finding ability. The dataset includes CoT traces for tasks like Word Sorting, Tracking Shuffled Objects, Logical Deduction, Multistep Arithmetic, and Dyck Languages. Human annotators were recruited to identify mistake steps in these tasks, with automated annotation for Dyck Languages. Each JSONL file contains input questions, steps in the chain of thoughts, model's answer, correct answer, and the index of the first logical mistake.
For similar tasks

LLM-Geo
LLM-Geo is an AI-powered geographic information system (GIS) that leverages Large Language Models (LLMs) for automatic spatial data collection, analysis, and visualization. By adopting LLM as the reasoning core, it addresses spatial problems with self-generating, self-organizing, self-verifying, self-executing, and self-growing capabilities. The tool aims to make spatial analysis easier, faster, and more accessible by reducing manual operation time and delivering accurate results through case studies. It uses GPT-4 API in a Python environment and advocates for further research and development in autonomous GIS.
For similar jobs
sweep
Sweep is an AI junior developer that turns bugs and feature requests into code changes. It automatically handles developer experience improvements like adding type hints and improving test coverage.
teams-ai
The Teams AI Library is a software development kit (SDK) that helps developers create bots that can interact with Teams and Microsoft 365 applications. It is built on top of the Bot Framework SDK and simplifies the process of developing bots that interact with Teams' artificial intelligence capabilities. The SDK is available for JavaScript/TypeScript, .NET, and Python.

ai-guide
This guide is dedicated to Large Language Models (LLMs) that you can run on your home computer. It assumes your PC is a lower-end, non-gaming setup.
classifai
Supercharge WordPress Content Workflows and Engagement with Artificial Intelligence. Tap into leading cloud-based services like OpenAI, Microsoft Azure AI, Google Gemini and IBM Watson to augment your WordPress-powered websites. Publish content faster while improving SEO performance and increasing audience engagement. ClassifAI integrates Artificial Intelligence and Machine Learning technologies to lighten your workload and eliminate tedious tasks, giving you more time to create original content that matters.
chatbot-ui
Chatbot UI is an open-source AI chat app that allows users to create and deploy their own AI chatbots. It is easy to use and can be customized to fit any need. Chatbot UI is perfect for businesses, developers, and anyone who wants to create a chatbot.
BricksLLM
BricksLLM is a cloud native AI gateway written in Go. Currently, it provides native support for OpenAI, Anthropic, Azure OpenAI and vLLM. BricksLLM aims to provide enterprise level infrastructure that can power any LLM production use cases. Here are some use cases for BricksLLM: * Set LLM usage limits for users on different pricing tiers * Track LLM usage on a per user and per organization basis * Block or redact requests containing PIIs * Improve LLM reliability with failovers, retries and caching * Distribute API keys with rate limits and cost limits for internal development/production use cases * Distribute API keys with rate limits and cost limits for students
uAgents
uAgents is a Python library developed by Fetch.ai that allows for the creation of autonomous AI agents. These agents can perform various tasks on a schedule or take action on various events. uAgents are easy to create and manage, and they are connected to a fast-growing network of other uAgents. They are also secure, with cryptographically secured messages and wallets.
griptape
Griptape is a modular Python framework for building AI-powered applications that securely connect to your enterprise data and APIs. It offers developers the ability to maintain control and flexibility at every step. Griptape's core components include Structures (Agents, Pipelines, and Workflows), Tasks, Tools, Memory (Conversation Memory, Task Memory, and Meta Memory), Drivers (Prompt and Embedding Drivers, Vector Store Drivers, Image Generation Drivers, Image Query Drivers, SQL Drivers, Web Scraper Drivers, and Conversation Memory Drivers), Engines (Query Engines, Extraction Engines, Summary Engines, Image Generation Engines, and Image Query Engines), and additional components (Rulesets, Loaders, Artifacts, Chunkers, and Tokenizers). Griptape enables developers to create AI-powered applications with ease and efficiency.
