
inspectus
LLM Analytics
Stars: 600
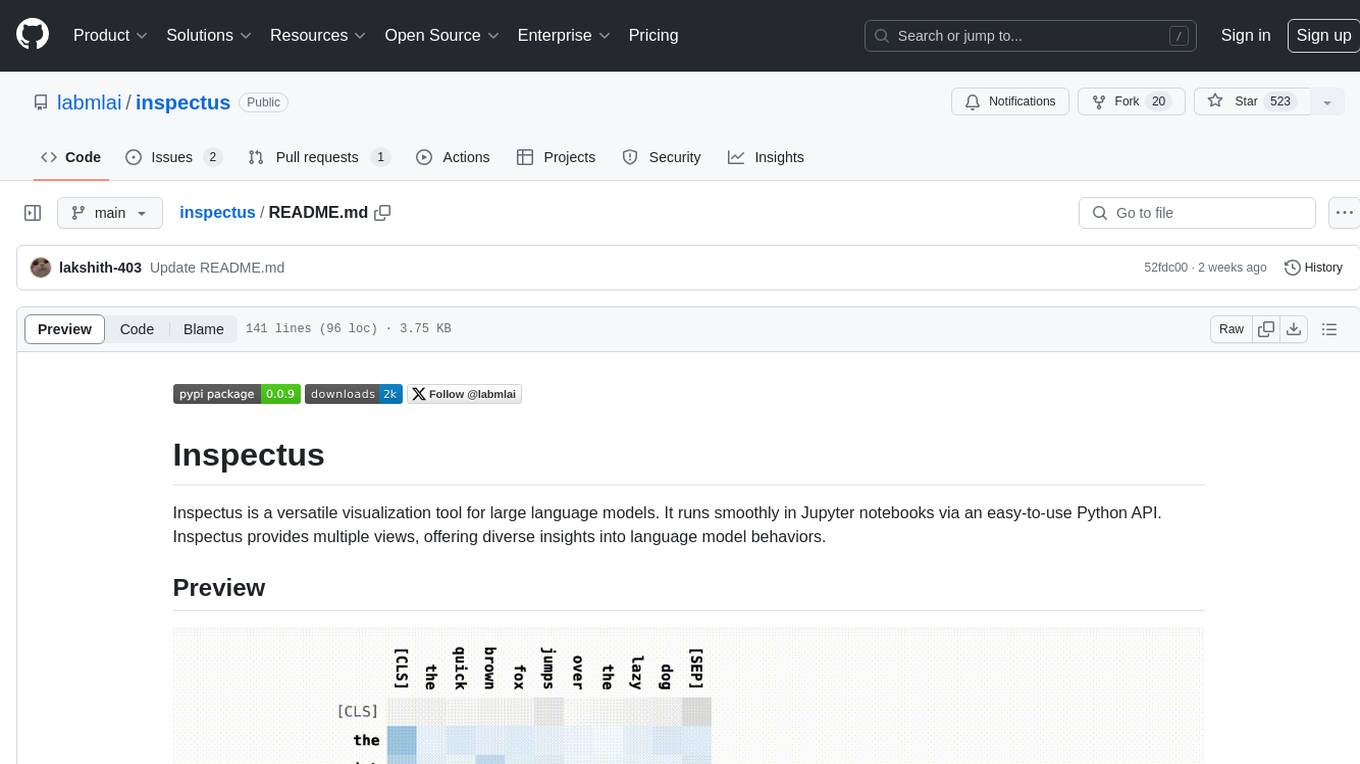
Inspectus is a versatile visualization tool for large language models. It provides multiple views, including Attention Matrix, Query Token Heatmap, Key Token Heatmap, and Dimension Heatmap, to offer insights into language model behaviors. Users can interact with the tool in Jupyter notebooks through an easy-to-use Python API. Inspectus allows users to visualize attention scores between tokens, analyze how tokens focus on each other during processing, and explore the relationships between query and key tokens. The tool supports the visualization of attention maps from Huggingface transformers and custom attention maps, making it a valuable resource for researchers and developers working with language models.
README:
Inspectus is a versatile visualization tool for machine learning. It runs smoothly in Jupyter notebooks via an easy-to-use Python API.
- Installation
- Attention Visualization
- Token Visualization
- Distribution Plot
- Setting up for Development
- Citing
pip install inspectusInspectus provides visualization tools for attention mechanisms in deep learning models. It provides a set of comprehensive views, making it easier to understand how these models work.
Click a token to select it and deselect others. Clicking again will select all again. To change the state of only one token, do shift+click
Attention Matrix: Visualizes the attention scores between tokens, highlighting how each token focuses on others during processing.
Query Token Heatmap: Shows the sum of attention scores between each query and selected key tokens
Key Token Heatmap: Shows the sum of attention scores between each key and selected query tokens
Dimension Heatmap: Shows the sum of attention scores for each item in dimensions (Layers and Heads) normalized over the dimension.
Import the library
import inspectusSimple usage
# attn: Attention map; a 2-4D tensor or attention maps from Huggingface transformers
inspectus.attention(attn, tokens)
For different query and key tokens
inspectus.attention(attns, query_tokens, key_tokens)For detailed API documentation, please refer to the official documentation.
from transformers import AutoTokenizer, GPT2LMHeadModel, AutoConfig
import torch
import inspectus

# Initialize the tokenizer and model
context_length = 128
tokenizer = AutoTokenizer.from_pretrained("huggingface-course/code-search-net-tokenizer")

config = AutoConfig.from_pretrained(
    "gpt2",
    vocab_size=len(tokenizer),
    n_ctx=context_length,
    bos_token_id=tokenizer.bos_token_id,
    eos_token_id=tokenizer.eos_token_id,
)

model = GPT2LMHeadModel(config)

# Tokenize the input text
text= 'The quick brown fox jumps over the lazy dog'
tokenized = tokenizer(
    text,
    return_tensors='pt',
    return_offsets_mapping=True
)
input_ids = tokenized['input_ids']

tokens = [text[s: e] for s, e in tokenized['offset_mapping'][0]]

with torch.no_grad():
    res = model(input_ids=input_ids.to(model.device), output_attentions=True)

# Visualize the attention maps using the Inspectus library
inspectus.attention(res['attentions'], tokens)
Check out the notebook here: Huggingface Tutorial
import numpy as np
import inspectus

# 2D attention representing attention values between Query and Key tokens
attn = np.random.rand(3, 3)

# Visualize the attention values using the Inspectus library
# The first argument is the attention matrix
# The second argument is the list of query tokens
# The third argument is the list of key tokens
inspectus.attention(arr, ['a', 'b', 'c'], ['d', 'e', 'f'])
Check out the notebook here: Custom attention map tutorial
This tool is used to visualize some metric related to tokens. This supports multiple metrics and the metric used for the visualization can be selected using the dropdown. Along with metrics, any aditional information can be added to tokens.
import inspectus

inspectus.tokens(['hello', 'world'], np.random.rand(2))The distribution plot is a plot that shows the distribution of a series of data. At each step, the distribution of the data is calculated and maximum of 5 bands are drawn from 9 basis points. (0, 6.68, 15.87, 30.85, 50.00, 69.15, 84.13, 93.32, 100.00)
import inspectus

inspectus.distribution({'x': [x for x in range(0, 100)]})
To focus on parts of the plot and zoom in, the minimap can be used. To select a single plot, use the legend on the top right.
For comprehensive usage guide please check the notebook here: Distribution Plot Tutorial
This plot can be used to identify the existence of outliers in the data. Following notebooks demonstrate how to use the distribution plot to identify outliers in the MNIST training loss.
If you use Inspectus for academic research, please cite the library using the following BibTeX entry.
@misc{inspectus,
 author = {Varuna Jayasiri, Lakshith Nishshanke},
 title = {inspectus: A visualization and analytics tool for large language models},
 year = {2024},
 url = {https://github.com/labmlai/inspectus},
}
For Tasks:
Click tags to check more tools for each tasksFor Jobs:
Alternative AI tools for inspectus
Similar Open Source Tools

inspectus
Inspectus is a versatile visualization tool for large language models. It provides multiple views, including Attention Matrix, Query Token Heatmap, Key Token Heatmap, and Dimension Heatmap, to offer insights into language model behaviors. Users can interact with the tool in Jupyter notebooks through an easy-to-use Python API. Inspectus allows users to visualize attention scores between tokens, analyze how tokens focus on each other during processing, and explore the relationships between query and key tokens. The tool supports the visualization of attention maps from Huggingface transformers and custom attention maps, making it a valuable resource for researchers and developers working with language models.
VMind
VMind is an open-source solution for intelligent visualization, providing an intelligent chart component based on LLM by VisActor. It allows users to create chart narrative works with natural language interaction, edit charts through dialogue, and export narratives as videos or GIFs. The tool is easy to use, scalable, supports various chart types, and offers one-click export functionality. Users can customize chart styles, specify themes, and aggregate data using LLM models. VMind aims to enhance efficiency in creating data visualization works through dialogue-based editing and natural language interaction.
embodied-agents
Embodied Agents is a toolkit for integrating large multi-modal models into existing robot stacks with just a few lines of code. It provides consistency, reliability, scalability, and is configurable to any observation and action space. The toolkit is designed to reduce complexities involved in setting up inference endpoints, converting between different model formats, and collecting/storing datasets. It aims to facilitate data collection and sharing among roboticists by providing Python-first abstractions that are modular, extensible, and applicable to a wide range of tasks. The toolkit supports asynchronous and remote thread-safe agent execution for maximal responsiveness and scalability, and is compatible with various APIs like HuggingFace Spaces, Datasets, Gymnasium Spaces, Ollama, and OpenAI. It also offers automatic dataset recording and optional uploads to the HuggingFace hub.
Biomni
Biomni is a general-purpose biomedical AI agent designed to autonomously execute a wide range of research tasks across diverse biomedical subfields. By integrating cutting-edge large language model (LLM) reasoning with retrieval-augmented planning and code-based execution, Biomni helps scientists dramatically enhance research productivity and generate testable hypotheses.
MemoryLLM
MemoryLLM is a large language model designed for self-updating capabilities. It offers pretrained models with different memory capacities and features, such as chat models. The repository provides training code, evaluation scripts, and datasets for custom experiments. MemoryLLM aims to enhance knowledge retention and performance on various natural language processing tasks.
beyondllm
Beyond LLM offers an all-in-one toolkit for experimentation, evaluation, and deployment of Retrieval-Augmented Generation (RAG) systems. It simplifies the process with automated integration, customizable evaluation metrics, and support for various Large Language Models (LLMs) tailored to specific needs. The aim is to reduce LLM hallucination risks and enhance reliability.
oasis
OASIS is a scalable, open-source social media simulator that integrates large language models with rule-based agents to realistically mimic the behavior of up to one million users on platforms like Twitter and Reddit. It facilitates the study of complex social phenomena such as information spread, group polarization, and herd behavior, offering a versatile tool for exploring diverse social dynamics and user interactions in digital environments. With features like scalability, dynamic environments, diverse action spaces, and integrated recommendation systems, OASIS provides a comprehensive platform for simulating social media interactions at a large scale.
llmgraph
llmgraph is a tool that enables users to create knowledge graphs in GraphML, GEXF, and HTML formats by extracting world knowledge from large language models (LLMs) like ChatGPT. It supports various entity types and relationships, offers cache support for efficient graph growth, and provides insights into LLM costs. Users can customize the model used and interact with different LLM providers. The tool allows users to generate interactive graphs based on a specified entity type and Wikipedia link, making it a valuable resource for knowledge graph creation and exploration.
Pixel-Reasoner
Pixel Reasoner is a framework that introduces reasoning in the pixel-space for Vision-Language Models (VLMs), enabling them to directly inspect, interrogate, and infer from visual evidences. This enhances reasoning fidelity for visual tasks by equipping VLMs with visual reasoning operations like zoom-in and select-frame. The framework addresses challenges like model's imbalanced competence and reluctance to adopt pixel-space operations through a two-phase training approach involving instruction tuning and curiosity-driven reinforcement learning. With these visual operations, VLMs can interact with complex visual inputs such as images or videos to gather necessary information, leading to improved performance across visual reasoning benchmarks.
llama_index
LlamaIndex is a data framework for building LLM applications. It provides tools for ingesting, structuring, and querying data, as well as integrating with LLMs and other tools. LlamaIndex is designed to be easy to use for both beginner and advanced users, and it provides a comprehensive set of features for building LLM applications.
codellm-devkit
Codellm-devkit (CLDK) is a Python library that serves as a multilingual program analysis framework bridging traditional static analysis tools and Large Language Models (LLMs) specialized for code (CodeLLMs). It simplifies the process of analyzing codebases across multiple programming languages, enabling the extraction of meaningful insights and facilitating LLM-based code analysis. The library provides a unified interface for integrating outputs from various analysis tools and preparing them for effective use by CodeLLMs. Codellm-devkit aims to enable the development and experimentation of robust analysis pipelines that combine traditional program analysis tools and CodeLLMs, reducing friction in multi-language code analysis and ensuring compatibility across different tools and LLM platforms. It is designed to seamlessly integrate with popular analysis tools like WALA, Tree-sitter, LLVM, and CodeQL, acting as a crucial intermediary layer for efficient communication between these tools and CodeLLMs. The project is continuously evolving to include new tools and frameworks, maintaining its versatility for code analysis and LLM integration.
topicGPT
TopicGPT is a repository containing scripts and prompts for the paper 'TopicGPT: Topic Modeling by Prompting Large Language Models' (NAACL'24). The 'topicgpt_python' package offers functions to generate high-level and specific topics, refine topics, assign topics to input text, and correct generated topics. It supports various APIs like OpenAI, VertexAI, Azure, Gemini, and vLLM for inference. Users can prepare data in JSONL format, run the pipeline using provided scripts, and evaluate topic alignment with ground-truth labels.
WordLlama
WordLlama is a fast, lightweight NLP toolkit optimized for CPU hardware. It recycles components from large language models to create efficient word representations. It offers features like Matryoshka Representations, low resource requirements, binarization, and numpy-only inference. The tool is suitable for tasks like semantic matching, fuzzy deduplication, ranking, and clustering, making it a good option for NLP-lite tasks and exploratory analysis.
graphiti
Graphiti is a framework for building and querying temporally-aware knowledge graphs, tailored for AI agents in dynamic environments. It continuously integrates user interactions, structured and unstructured data, and external information into a coherent, queryable graph. The framework supports incremental data updates, efficient retrieval, and precise historical queries without complete graph recomputation, making it suitable for developing interactive, context-aware AI applications.
aigverse
aigverse is a Python infrastructure framework that bridges the gap between logic synthesis and AI/ML applications. It allows efficient representation and manipulation of logic circuits, making it easier to integrate logic synthesis and optimization tasks into machine learning pipelines. Built upon EPFL Logic Synthesis Libraries, particularly mockturtle, aigverse provides a high-level Python interface to state-of-the-art algorithms for And-Inverter Graph (AIG) manipulation and logic synthesis, widely used in formal verification, hardware design, and optimization tasks.
qa-mdt
This repository provides an implementation of QA-MDT, integrating state-of-the-art models for music generation. It offers a Quality-Aware Masked Diffusion Transformer for enhanced music generation. The code is based on various repositories like AudioLDM, PixArt-alpha, MDT, AudioMAE, and Open-Sora. The implementation allows for training and fine-tuning the model with different strategies and datasets. The repository also includes instructions for preparing datasets in LMDB format and provides a script for creating a toy LMDB dataset. The model can be used for music generation tasks, with a focus on quality injection to enhance the musicality of generated music.
For similar tasks

inspectus
Inspectus is a versatile visualization tool for large language models. It provides multiple views, including Attention Matrix, Query Token Heatmap, Key Token Heatmap, and Dimension Heatmap, to offer insights into language model behaviors. Users can interact with the tool in Jupyter notebooks through an easy-to-use Python API. Inspectus allows users to visualize attention scores between tokens, analyze how tokens focus on each other during processing, and explore the relationships between query and key tokens. The tool supports the visualization of attention maps from Huggingface transformers and custom attention maps, making it a valuable resource for researchers and developers working with language models.
For similar jobs
weave
Weave is a toolkit for developing Generative AI applications, built by Weights & Biases. With Weave, you can log and debug language model inputs, outputs, and traces; build rigorous, apples-to-apples evaluations for language model use cases; and organize all the information generated across the LLM workflow, from experimentation to evaluations to production. Weave aims to bring rigor, best-practices, and composability to the inherently experimental process of developing Generative AI software, without introducing cognitive overhead.
LLMStack
LLMStack is a no-code platform for building generative AI agents, workflows, and chatbots. It allows users to connect their own data, internal tools, and GPT-powered models without any coding experience. LLMStack can be deployed to the cloud or on-premise and can be accessed via HTTP API or triggered from Slack or Discord.
VisionCraft
The VisionCraft API is a free API for using over 100 different AI models. From images to sound.
kaito
Kaito is an operator that automates the AI/ML inference model deployment in a Kubernetes cluster. It manages large model files using container images, avoids tuning deployment parameters to fit GPU hardware by providing preset configurations, auto-provisions GPU nodes based on model requirements, and hosts large model images in the public Microsoft Container Registry (MCR) if the license allows. Using Kaito, the workflow of onboarding large AI inference models in Kubernetes is largely simplified.
PyRIT
PyRIT is an open access automation framework designed to empower security professionals and ML engineers to red team foundation models and their applications. It automates AI Red Teaming tasks to allow operators to focus on more complicated and time-consuming tasks and can also identify security harms such as misuse (e.g., malware generation, jailbreaking), and privacy harms (e.g., identity theft). The goal is to allow researchers to have a baseline of how well their model and entire inference pipeline is doing against different harm categories and to be able to compare that baseline to future iterations of their model. This allows them to have empirical data on how well their model is doing today, and detect any degradation of performance based on future improvements.
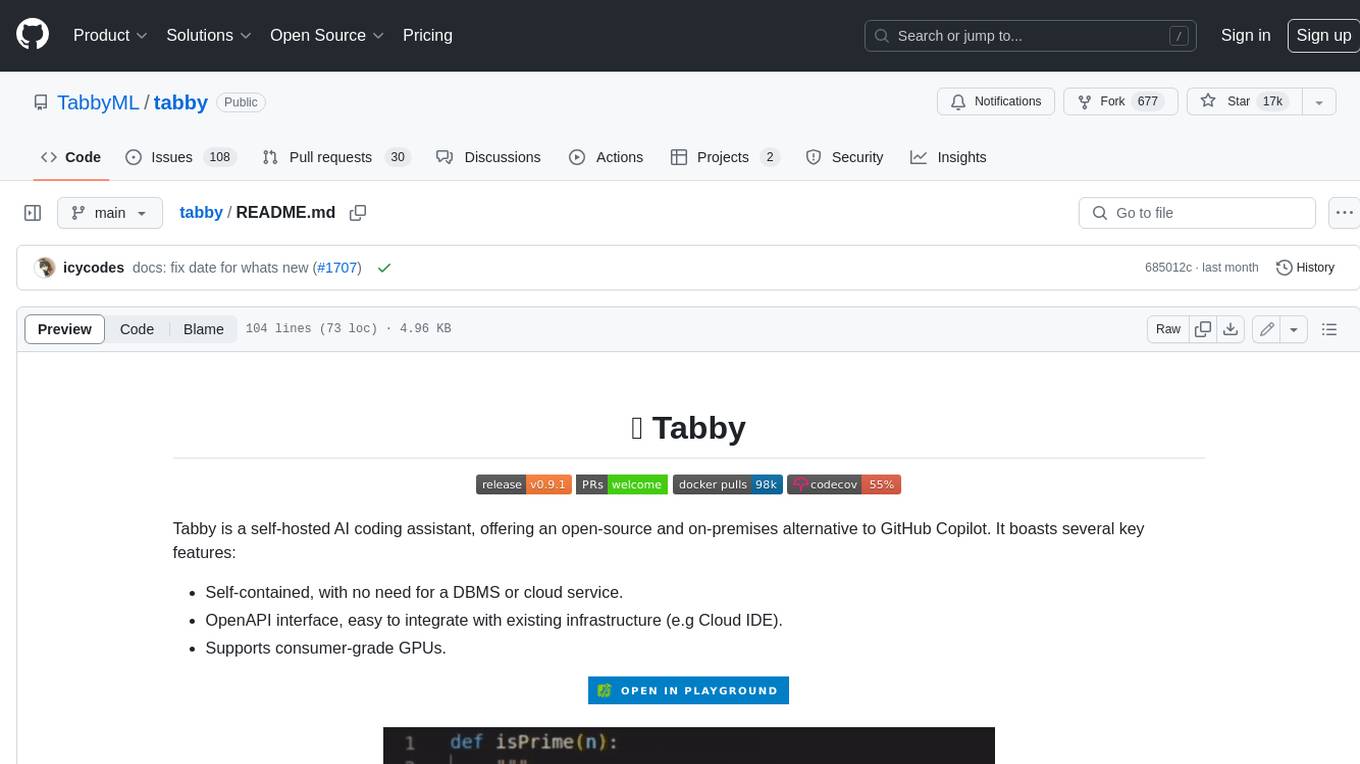
tabby
Tabby is a self-hosted AI coding assistant, offering an open-source and on-premises alternative to GitHub Copilot. It boasts several key features: * Self-contained, with no need for a DBMS or cloud service. * OpenAPI interface, easy to integrate with existing infrastructure (e.g Cloud IDE). * Supports consumer-grade GPUs.
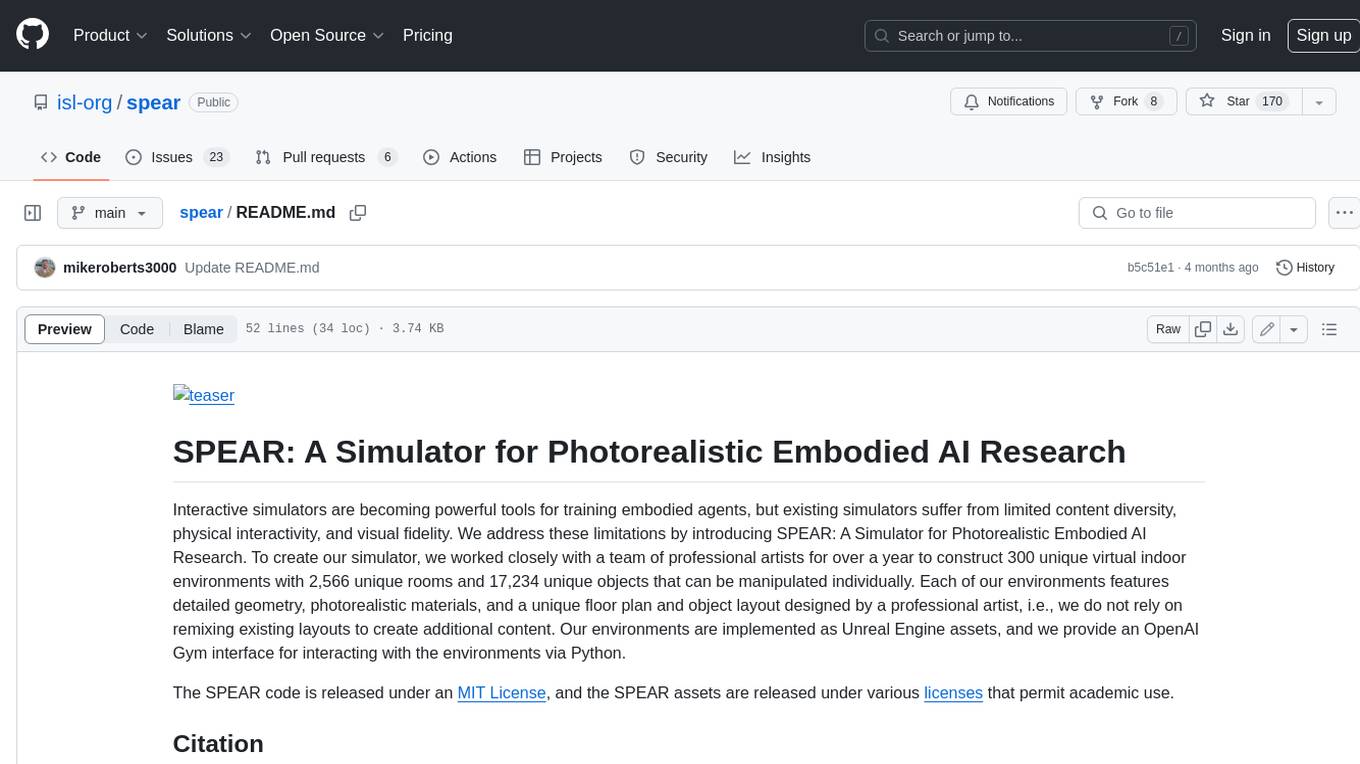
spear
SPEAR (Simulator for Photorealistic Embodied AI Research) is a powerful tool for training embodied agents. It features 300 unique virtual indoor environments with 2,566 unique rooms and 17,234 unique objects that can be manipulated individually. Each environment is designed by a professional artist and features detailed geometry, photorealistic materials, and a unique floor plan and object layout. SPEAR is implemented as Unreal Engine assets and provides an OpenAI Gym interface for interacting with the environments via Python.
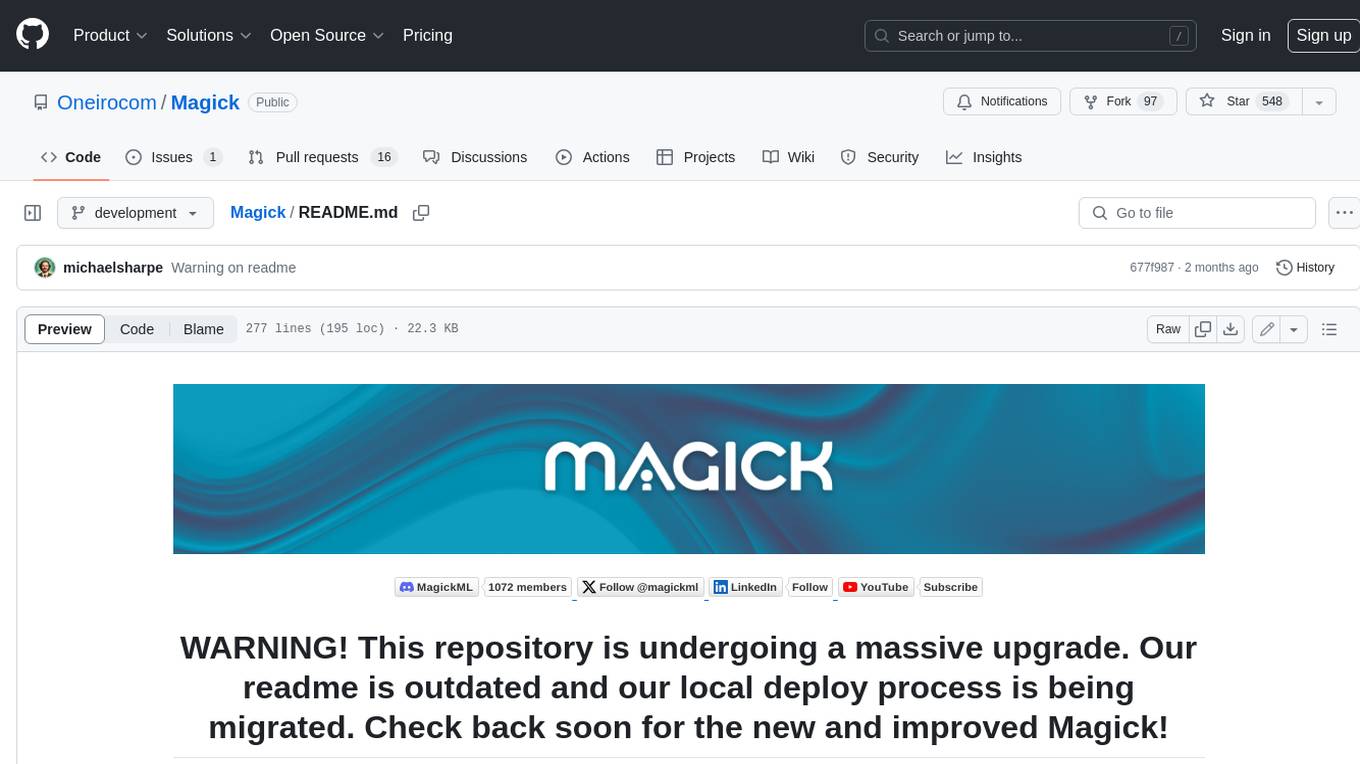
Magick
Magick is a groundbreaking visual AIDE (Artificial Intelligence Development Environment) for no-code data pipelines and multimodal agents. Magick can connect to other services and comes with nodes and templates well-suited for intelligent agents, chatbots, complex reasoning systems and realistic characters.


