
ruby_llm-monitoring
Monitor your LLM usage within your Rails application.
Stars: 52
RubyLLM::Monitoring is a tool designed to monitor the LLM (Live-Link Monitoring) usage within a Rails application. It provides a dashboard to display metrics such as Throughput, Cost, Response Time, and Error Rate. Users can customize the displayed metrics and add their own custom metrics. The tool also supports setting up alerts based on predefined conditions, such as monitoring cost and errors. Authentication and authorization are left to the user, allowing for flexibility in securing the monitoring dashboard. Overall, RubyLLM::Monitoring aims to provide a comprehensive solution for monitoring and analyzing the performance of a Rails application.
README:
Monitor your LLM usage within your Rails application.
[!NOTE] This engine relies on RubyLLM. Make sure you have it installed and configured.
Add this line to your application's Gemfile:
gem "ruby_llm-monitoring"And then execute:
$ bundleTo copy and migrate RubyLLM::Monitoring's migrations, run:
$ rails ruby_llm_monitoring:install:migrations db:migrateAnd then mount the engine in your config/routes.rb:
Rails.application.routes.draw do
  # ...

  mount RubyLLM::Monitoring::Engine, at: "/monitoring"
end
Now you should be able to browse to /monitoring and monitor your LLM usage.


RubyLLM::Monitoring leaves authentication and authorization to the user. If no authentication is enforced, /monitoring will be available to everyone.
To enforce authentication, you can use route constraints, or set up a HTTP Basic auth middleware.
For example, if you're using devise, you can do this:
# config/routes.rb
authenticate :user do
  mount RubyLLM::Monitoring::Engine, at: "/monitoring"
end
See more examples here.
However, if you're using Rails' default authentication generator, or an authentication solution that doesn't provide constraints, you need to roll out your own solution:
# config/routes.rb
constraints ->(request) { Constraints::Auth.authenticated?(request) } do
  mount RubyLLM::Monitoring::Engine, at: "/monitoring"
end

# lib/constraints/auth.rb
class Constraints::Auth
  def self.authenticated?(request)
    cookies = ActionDispatch::Cookies::CookieJar.build(request, request.cookies)

    Session.find_by id: cookies.signed[:session_id]
  end
end
You can also set up a HTTP Basic auth middleware in the engine:
# config/initializers/ruby_llm-monitoring.rb
RubyLLM::Monitoring::Engine.middleware.use(Rack::Auth::Basic) do |username, password|
  ActiveSupport::SecurityUtils.secure_compare(Rails.application.credentials.ruby_llm_monitoring_username, username) &
    ActiveSupport::SecurityUtils.secure_compare(Rails.application.credentials.ruby_llm_monitoring_password, password)
endThe dashboard displays four metrics by default: Throughput, Cost, Response Time, and Error Rate. You can customize which metrics are shown or add your own custom metrics.
In config/initializers/ruby_llm_monitoring.rb, you can configure which metrics are displayed:
RubyLLM::Monitoring.metrics = [
  RubyLLM::Monitoring::Metrics::Throughput,
  RubyLLM::Monitoring::Metrics::Cost,
  RubyLLM::Monitoring::Metrics::ResponseTime,
  RubyLLM::Monitoring::Metrics::ErrorCount
]
To remove a metric, simply omit it from the array:
RubyLLM::Monitoring.metrics = [
  RubyLLM::Monitoring::Metrics::Throughput,
  RubyLLM::Monitoring::Metrics::Cost,
  RubyLLM::Monitoring::Metrics::ResponseTime
]Create custom metrics by inheriting from RubyLLM::Monitoring::Metrics::Base:
class CostByFeature < RubyLLM::Monitoring::Metrics::Base
  title "Cost by Feature"
  unit "money"

  private

  def metric_data
    # Extract metadata from JSON payload and group by feature
    scope.group("json_extract(payload, '$.metadata.feature')").sum(:cost)
  end

  def build_series(aggregated_data)
    aggregated_data
      .group_by { |(_, feature), _| [feature || "unknown"] }
      .transform_values { |entries|
        entries.map { |(timestamp, _), value|
          [timestamp.to_i * 1000, value || default_value]
        }
      }
      .map { |keys, data| { name: keys.first, data: data } }
  end
end
The scope is an ActiveRecord relation of Event records grouped by time bucket. Your metric_data method should return aggregated data that will be displayed as a time series chart.
Note: JSON extraction syntax varies by database:
-
SQLite:
json_extract(payload, '$.metadata.feature') -
PostgreSQL:
payload->'metadata'->>'feature' -
MySQL:
payload->>'$.metadata.feature'
This example assumes you're setting metadata using RubyLLM::Instrumentation.with():
RubyLLM::Instrumentation.with(feature: "chat_assistant") do
  RubyLLM.chat.ask("Hello")
end
Then add your custom metric to the configuration:
RubyLLM::Monitoring.metrics = [
  RubyLLM::Monitoring::Metrics::Throughput,
  RubyLLM::Monitoring::Metrics::Cost,
  CostByFeature
]RubyLLM::Monitoring can send alerts when certain conditions are met. Useful for monitoring cost, errors, etc.
In config/initializers/ruby_llm_monitoring.rb, you can set the notification channels and alert rules:
RubyLLM::Monitoring.channels = {
  email: { to: "[email protected]" },
  slack: { webhook_url: ENV["SLACK_WEBHOOK_URL"] },
}

# Default cooldown between repeated alerts (optional, defaults to 5 minutes)
RubyLLM::Monitoring.alert_cooldown = 15.minutes

RubyLLM::Monitoring.alert_rules += [{
  time_range: -> { 1.hour.ago.. },
  rule: ->(events) { events.where.not(exception_class: nil).count > 10 },
  channels: [:slack],
  message: { text: "More than 10 errors in the last hour" }
}, {
  time_range: -> { Time.current.at_beginning_of_month.. },
  rule: ->(events) { events.sum(:cost) >= 500 },
  channels: [:email, :slack],
  message: { text: "More than $500 spent this month" }
}]| Option | Required | Description |
|---|---|---|
time_range |
Yes | Lambda returning a range for filtering events (e.g., -> { 1.hour.ago.. }) |
rule |
Yes | Lambda receiving events scope, returns true to trigger alert |
channels |
Yes | Array of channel names to notify |
message |
Yes | Hash with :text key for the alert message |
cooldown |
No | Override default cooldown for this rule |
RubyLLM::Monitoring.channels = {
  slack: {
    webhook_url: ENV["SLACK_WEBHOOK_URL"]
  }
}RubyLLM::Monitoring.channels = {
email: {
to: "[email protected]",
from: "[email protected]", # optional
subject: "LLM Alert" # optional
}
}Register custom notification channels:
class PagerDutyChannel < RubyLLM::Monitoring::Channels::Base
  def self.deliver(message, config)
    # Your implementation
    # message[:text] contains the alert text
    # config contains channel configuration
  end
end

RubyLLM::Monitoring.channel_registry.register(:pagerduty, PagerDutyChannel)

RubyLLM::Monitoring.channels = {
  pagerduty: { api_key: ENV["PAGERDUTY_API_KEY"] }
}You can open an issue or a PR in GitHub.
The gem is available as open source under the terms of the MIT License.
For Tasks:
Click tags to check more tools for each tasksFor Jobs:
Alternative AI tools for ruby_llm-monitoring
Similar Open Source Tools
ruby_llm-monitoring
RubyLLM::Monitoring is a tool designed to monitor the LLM (Live-Link Monitoring) usage within a Rails application. It provides a dashboard to display metrics such as Throughput, Cost, Response Time, and Error Rate. Users can customize the displayed metrics and add their own custom metrics. The tool also supports setting up alerts based on predefined conditions, such as monitoring cost and errors. Authentication and authorization are left to the user, allowing for flexibility in securing the monitoring dashboard. Overall, RubyLLM::Monitoring aims to provide a comprehensive solution for monitoring and analyzing the performance of a Rails application.
langchainrb
Langchain.rb is a Ruby library that makes it easy to build LLM-powered applications. It provides a unified interface to a variety of LLMs, vector search databases, and other tools, making it easy to build and deploy RAG (Retrieval Augmented Generation) systems and assistants. Langchain.rb is open source and available under the MIT License.
flapi
flAPI is a powerful service that automatically generates read-only APIs for datasets by utilizing SQL templates. Built on top of DuckDB, it offers features like automatic API generation, support for Model Context Protocol (MCP), connecting to multiple data sources, caching, security implementation, and easy deployment. The tool allows users to create APIs without coding and enables the creation of AI tools alongside REST endpoints using SQL templates. It supports unified configuration for REST endpoints and MCP tools/resources, concurrent servers for REST API and MCP server, and automatic tool discovery. The tool also provides DuckLake-backed caching for modern, snapshot-based caching with features like full refresh, incremental sync, retention, compaction, and audit logs.
aiavatarkit
AIAvatarKit is a tool for building AI-based conversational avatars quickly. It supports various platforms like VRChat and cluster, along with real-world devices. The tool is extensible, allowing unlimited capabilities based on user needs. It requires VOICEVOX API, Google or Azure Speech Services API keys, and Python 3.10. Users can start conversations out of the box and enjoy seamless interactions with the avatars.
top_secret
Top Secret is a Ruby gem designed to filter sensitive information from free text before sending it to external services or APIs, such as chatbots and LLMs. It provides default filters for credit cards, emails, phone numbers, social security numbers, people's names, and locations, with the ability to add custom filters. Users can configure the tool to handle sensitive information redaction, scan for sensitive data, batch process messages, and restore filtered text from external services. Top Secret uses Regex and NER filters to detect and redact sensitive information, allowing users to override default filters, disable specific filters, and add custom filters globally. The tool is suitable for applications requiring data privacy and security measures.
instructor
Instructor is a popular Python library for managing structured outputs from large language models (LLMs). It offers a user-friendly API for validation, retries, and streaming responses. With support for various LLM providers and multiple languages, Instructor simplifies working with LLM outputs. The library includes features like response models, retry management, validation, streaming support, and flexible backends. It also provides hooks for logging and monitoring LLM interactions, and supports integration with Anthropic, Cohere, Gemini, Litellm, and Google AI models. Instructor facilitates tasks such as extracting user data from natural language, creating fine-tuned models, managing uploaded files, and monitoring usage of OpenAI models.
monacopilot
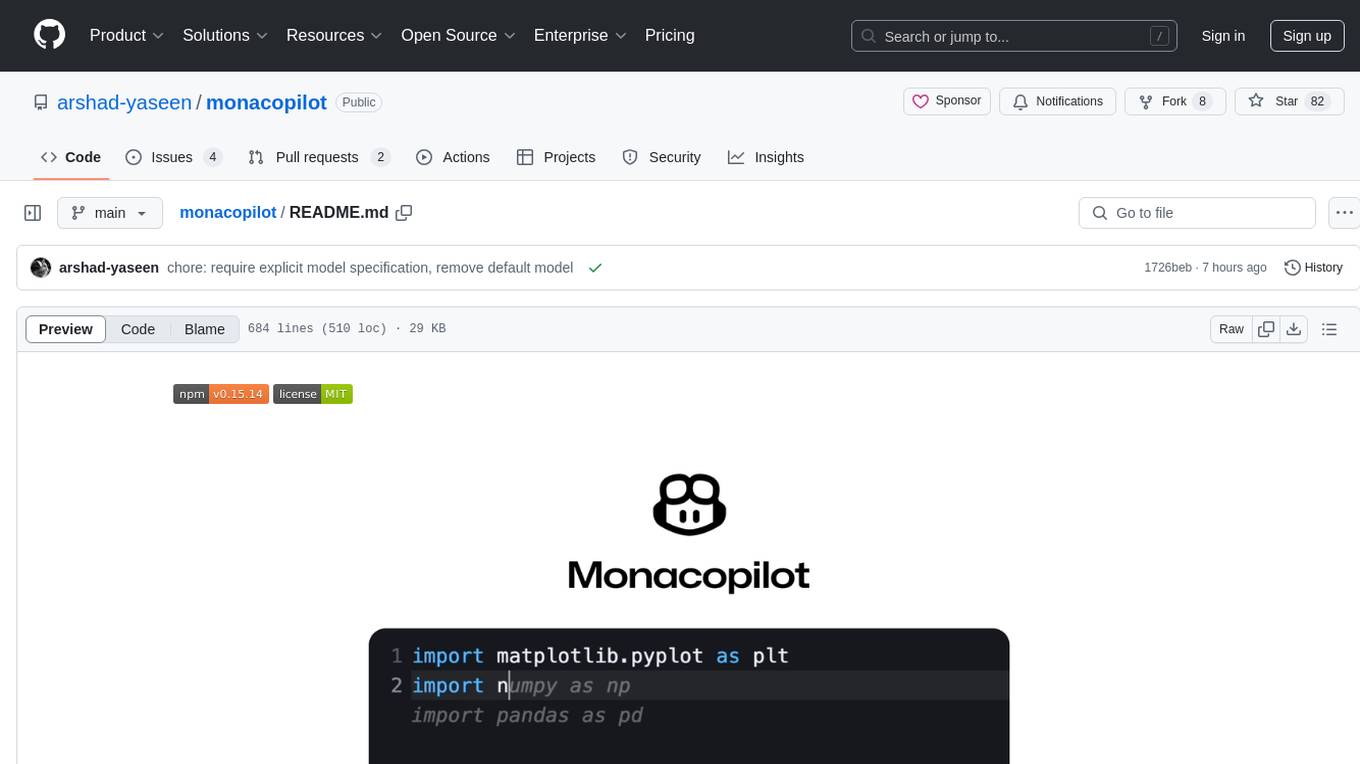
Monacopilot is a powerful and customizable AI auto-completion plugin for the Monaco Editor. It supports multiple AI providers such as Anthropic, OpenAI, Groq, and Google, providing real-time code completions with an efficient caching system. The plugin offers context-aware suggestions, customizable completion behavior, and framework agnostic features. Users can also customize the model support and trigger completions manually. Monacopilot is designed to enhance coding productivity by providing accurate and contextually appropriate completions in daily spoken language.
parrot.nvim
Parrot.nvim is a Neovim plugin that prioritizes a seamless out-of-the-box experience for text generation. It simplifies functionality and focuses solely on text generation, excluding integration of DALLE and Whisper. It supports persistent conversations as markdown files, custom hooks for inline text editing, multiple providers like Anthropic API, perplexity.ai API, OpenAI API, Mistral API, and local/offline serving via ollama. It allows custom agent definitions, flexible API credential support, and repository-specific instructions with a `.parrot.md` file. It does not have autocompletion or hidden requests in the background to analyze files.
ai-gateway
LangDB AI Gateway is an open-source enterprise AI gateway built in Rust. It provides a unified interface to all LLMs using the OpenAI API format, focusing on high performance, enterprise readiness, and data control. The gateway offers features like comprehensive usage analytics, cost tracking, rate limiting, data ownership, and detailed logging. It supports various LLM providers and provides OpenAI-compatible endpoints for chat completions, model listing, embeddings generation, and image generation. Users can configure advanced settings, such as rate limiting, cost control, dynamic model routing, and observability with OpenTelemetry tracing. The gateway can be run with Docker Compose and integrated with MCP tools for server communication.
sparkle
Sparkle is a tool that streamlines the process of building AI-driven features in applications using Large Language Models (LLMs). It guides users through creating and managing agents, defining tools, and interacting with LLM providers like OpenAI. Sparkle allows customization of LLM provider settings, model configurations, and provides a seamless integration with Sparkle Server for exposing agents via an OpenAI-compatible chat API endpoint.
model.nvim
model.nvim is a tool designed for Neovim users who want to utilize AI models for completions or chat within their text editor. It allows users to build prompts programmatically with Lua, customize prompts, experiment with multiple providers, and use both hosted and local models. The tool supports features like provider agnosticism, programmatic prompts in Lua, async and multistep prompts, streaming completions, and chat functionality in 'mchat' filetype buffer. Users can customize prompts, manage responses, and context, and utilize various providers like OpenAI ChatGPT, Google PaLM, llama.cpp, ollama, and more. The tool also supports treesitter highlights and folds for chat buffers.
gitleaks
Gitleaks is a tool for detecting secrets like passwords, API keys, and tokens in git repos, files, and whatever else you wanna throw at it via stdin. It can be installed using Homebrew, Docker, or Go, and is available in binary form for many popular platforms and OS types. Gitleaks can be implemented as a pre-commit hook directly in your repo or as a GitHub action. It offers scanning modes for git repositories, directories, and stdin, and allows creating baselines for ignoring old findings. Gitleaks also provides configuration options for custom secret detection rules and supports features like decoding encoded text and generating reports in various formats.
repomix
Repomix is a powerful tool that packs your entire repository into a single, AI-friendly file. It is designed to format your codebase for easy understanding by AI tools like Large Language Models (LLMs), Claude, ChatGPT, and Gemini. Repomix offers features such as AI optimization, token counting, simplicity in usage, customization options, Git awareness, and security-focused checks using Secretlint. It allows users to pack their entire repository or specific directories/files using glob patterns, and even supports processing remote Git repositories. The tool generates output in plain text, XML, or Markdown formats, with options for including/excluding files, removing comments, and performing security checks. Repomix also provides a global configuration option, custom instructions for AI context, and a security check feature to detect sensitive information in files.
sonarqube-mcp-server
The SonarQube MCP Server is a Model Context Protocol (MCP) server that enables seamless integration with SonarQube Server or Cloud for code quality and security. It supports the analysis of code snippets directly within the agent context. The server provides various tools for analyzing code, managing issues, accessing metrics, and interacting with SonarQube projects. It also supports advanced features like dependency risk analysis, enterprise portfolio management, and system health checks. The server can be configured for different transport modes, proxy settings, and custom certificates. Telemetry data collection can be disabled if needed.
Lumos
Lumos is a Chrome extension powered by a local LLM co-pilot for browsing the web. It allows users to summarize long threads, news articles, and technical documentation. Users can ask questions about reviews and product pages. The tool requires a local Ollama server for LLM inference and embedding database. Lumos supports multimodal models and file attachments for processing text and image content. It also provides options to customize models, hosts, and content parsers. The extension can be easily accessed through keyboard shortcuts and offers tools for automatic invocation based on prompts.
ax
Ax is a Typescript library that allows users to build intelligent agents inspired by agentic workflows and the Stanford DSP paper. It seamlessly integrates with multiple Large Language Models (LLMs) and VectorDBs to create RAG pipelines or collaborative agents capable of solving complex problems. The library offers advanced features such as streaming validation, multi-modal DSP, and automatic prompt tuning using optimizers. Users can easily convert documents of any format to text, perform smart chunking, embedding, and querying, and ensure output validation while streaming. Ax is production-ready, written in Typescript, and has zero dependencies.
For similar tasks
ruby_llm-monitoring
RubyLLM::Monitoring is a tool designed to monitor the LLM (Live-Link Monitoring) usage within a Rails application. It provides a dashboard to display metrics such as Throughput, Cost, Response Time, and Error Rate. Users can customize the displayed metrics and add their own custom metrics. The tool also supports setting up alerts based on predefined conditions, such as monitoring cost and errors. Authentication and authorization are left to the user, allowing for flexibility in securing the monitoring dashboard. Overall, RubyLLM::Monitoring aims to provide a comprehensive solution for monitoring and analyzing the performance of a Rails application.
logfire
Pydantic Logfire is an observability platform that provides simple and powerful dashboard, Python-centric insights, SQL querying, OpenTelemetry integration, and Pydantic validation analytics. It offers unparalleled visibility into Python applications' behavior and allows querying data using standard SQL. Logfire is an opinionated wrapper around OpenTelemetry, supporting traces, metrics, and logs. The Python SDK for logfire is open source, while the server application for recording and displaying data is closed source.
moon
Moon is a monitoring and alerting platform suitable for multiple domains, supporting various application scenarios such as cloud-native, Internet of Things (IoT), and Artificial Intelligence (AI). It simplifies operational work of cloud-native monitoring, boasts strong IoT and AI support capabilities, and meets diverse monitoring needs across industries. Capable of real-time data monitoring, intelligent alerts, and fault response for various fields.
hertzbeat
Hertzbeat is a simple and lightweight tool for monitoring the performance of web applications. It allows users to easily track the response time and availability of their web services in real-time. With Hertzbeat, users can set up custom alerts to be notified of any performance issues, helping them ensure their applications are running smoothly at all times.
For similar jobs
kaito
Kaito is an operator that automates the AI/ML inference model deployment in a Kubernetes cluster. It manages large model files using container images, avoids tuning deployment parameters to fit GPU hardware by providing preset configurations, auto-provisions GPU nodes based on model requirements, and hosts large model images in the public Microsoft Container Registry (MCR) if the license allows. Using Kaito, the workflow of onboarding large AI inference models in Kubernetes is largely simplified.
ai-on-gke
This repository contains assets related to AI/ML workloads on Google Kubernetes Engine (GKE). Run optimized AI/ML workloads with Google Kubernetes Engine (GKE) platform orchestration capabilities. A robust AI/ML platform considers the following layers: Infrastructure orchestration that support GPUs and TPUs for training and serving workloads at scale Flexible integration with distributed computing and data processing frameworks Support for multiple teams on the same infrastructure to maximize utilization of resources
tidb
TiDB is an open-source distributed SQL database that supports Hybrid Transactional and Analytical Processing (HTAP) workloads. It is MySQL compatible and features horizontal scalability, strong consistency, and high availability.
nvidia_gpu_exporter
Nvidia GPU exporter for prometheus, using `nvidia-smi` binary to gather metrics.
tracecat
Tracecat is an open-source automation platform for security teams. It's designed to be simple but powerful, with a focus on AI features and a practitioner-obsessed UI/UX. Tracecat can be used to automate a variety of tasks, including phishing email investigation, evidence collection, and remediation plan generation.
openinference
OpenInference is a set of conventions and plugins that complement OpenTelemetry to enable tracing of AI applications. It provides a way to capture and analyze the performance and behavior of AI models, including their interactions with other components of the application. OpenInference is designed to be language-agnostic and can be used with any OpenTelemetry-compatible backend. It includes a set of instrumentations for popular machine learning SDKs and frameworks, making it easy to add tracing to your AI applications.
BricksLLM
BricksLLM is a cloud native AI gateway written in Go. Currently, it provides native support for OpenAI, Anthropic, Azure OpenAI and vLLM. BricksLLM aims to provide enterprise level infrastructure that can power any LLM production use cases. Here are some use cases for BricksLLM: * Set LLM usage limits for users on different pricing tiers * Track LLM usage on a per user and per organization basis * Block or redact requests containing PIIs * Improve LLM reliability with failovers, retries and caching * Distribute API keys with rate limits and cost limits for internal development/production use cases * Distribute API keys with rate limits and cost limits for students
kong
Kong, or Kong API Gateway, is a cloud-native, platform-agnostic, scalable API Gateway distinguished for its high performance and extensibility via plugins. It also provides advanced AI capabilities with multi-LLM support. By providing functionality for proxying, routing, load balancing, health checking, authentication (and more), Kong serves as the central layer for orchestrating microservices or conventional API traffic with ease. Kong runs natively on Kubernetes thanks to its official Kubernetes Ingress Controller.