
openclaw-dashboard
A beautiful, zero-dependency command center for OpenClaw AI agents
Stars: 90
OpenClaw Dashboard is a beautiful, zero-dependency command center for OpenClaw AI agents. It provides a single local page that collects gateway health, costs, cron status, active sessions, sub-agent runs, model usage, and git log in one place, refreshed automatically without login or external dependencies. It aims to offer an at-a-glance overview layer for users to monitor the health of their OpenClaw setup and make informed decisions quickly without the need to search through log files or run CLI commands.
README:
A beautiful, zero-dependency command center for OpenClaw AI agents.

When you run OpenClaw seriously — multiple agents, dozens of cron jobs, sub-agents spawning sub-agents, several Telegram groups and Whatsapp, Slack, and Discord channels, 10+ models, multiple agents and sub-agents — information gets scattered fast.
The problem: there was no single place to answer the obvious questions:
- Is my gateway actually running right now?
- How much have I spent today, and which model is burning the most?
- Which cron jobs ran, which failed, and when does the next one fire?
- What sessions are active and how much context are they consuming?
- Are my sub-agents doing useful work or spinning in circles?
- What's the cost trend over the last 7 days — am I accelerating?
The only way to answer these was digging through log files, running CLI commands, and mentally stitching together a picture from 5 different sources. That friction adds up.
The solution: a single local page that collects everything in one place — gateway health, costs, cron status, active sessions, sub-agent runs, model usage, git log — refreshed automatically, no login, no cloud, no external dependencies. Open a browser tab, get the full picture in seconds.
It's not trying to replace the OpenClaw CLI or Telegram interface. It's the at-a-glance overview layer that tells you whether everything is healthy and where your money and compute are going — so you can make decisions without hunting for data.
- 🔔 Header Bar — Bot name, online/offline status, auto-refresh countdown, theme picker
-
⚠️ Alerts Banner — Smart alerts for high costs, failed crons, high context usage, gateway offline - 💚 System Health — Gateway status, PID, uptime, memory, compaction mode, active session count
- 💰 Cost Cards — Today's cost, all-time cost, projected monthly, cost breakdown donut chart
- ⏰ Cron Jobs — All scheduled jobs with status, schedule, last/next run, duration, model
- 📡 Active Sessions — Recent sessions with model, type badges (DM/group/cron/subagent), context %, tokens
- 📊 Token Usage & Cost — Per-model breakdown with 7d/30d/all-time tabs, usage bars, totals
- 🤖 Sub-Agent Activity — Sub-agent runs with cost, duration, status + token breakdown (7d/30d tabs)
- 📈 Charts & Trends — Cost trend line, model cost breakdown bars, sub-agent activity — all pure SVG, 7d/30d toggle
- 🧩 Bottom Row — Available models grid, skills list, git log
- 💬 AI Chat — Ask questions about your dashboard in natural language, powered by your OpenClaw gateway
- 🔄 On-Demand Refresh —
server.pyrefreshes data when you open the dashboard (no stale data) - ⏱️ Auto-Refresh — Page auto-refreshes every 60 seconds with countdown timer
- 🎨 6 Built-in Themes — 3 dark (Midnight, Nord, Catppuccin Mocha) + 3 light (GitHub, Solarized, Catppuccin Latte), switchable from the UI
- 🖌️ Glass Morphism UI — Subtle transparency and hover effects
- 📱 Responsive — Adapts to desktop, tablet, and mobile
- 🔒 Local Only — Runs on localhost, no external dependencies
- 🐧 Cross-Platform — macOS and Linux
- ⚡ Zero Dependencies — Pure HTML/CSS/JS frontend, Python stdlib backend
- 💬 AI Chat — Natural language queries about costs, sessions, crons, and config via OpenClaw gateway
curl -fsSL https://raw.githubusercontent.com/mudrii/openclaw-dashboard/main/install.sh | bashThis will:
- Install to
~/.openclaw/dashboard - Create a default config
- Run initial data refresh
- Start
server.pyas a system service - Open http://127.0.0.1:8080
# Clone the repo
git clone https://github.com/mudrii/openclaw-dashboard.git ~/.openclaw/dashboard
cd ~/.openclaw/dashboard

# Create your config
cp examples/config.minimal.json config.json
nano config.json  # Set your bot name

# Start the server (refreshes data on-demand)
python3 server.py &

# Or bind to LAN for access from other devices
python3 server.py --bind 0.0.0.0 &

# Open in browser
open http://127.0.0.1:8080  # macOS
xdg-open http://127.0.0.1:8080 # LinuxClick the 🎨 button in the header to switch themes instantly — no reload or server restart needed. Choice persists via localStorage.
| Theme | Type | Vibe |
|---|---|---|
| 🌙 Midnight | Dark | Original glass morphism (default) |
| 🏔️ Nord | Dark | Arctic blue, calm, great for long sessions |
| 🌸 Catppuccin Mocha | Dark | Warm pastels, easy on eyes |
| ☀️ GitHub Light | Light | Clean, professional, high readability |
| 🌅 Solarized Light | Light | Scientifically optimized contrast |
| 🌻 Catppuccin Latte | Light | Soft pastels |
Add your own themes by editing themes.json. Each theme defines 19 CSS color variables:
{
  "my-theme": {
    "name": "My Theme",
    "type": "dark",
    "icon": "🎯",
    "colors": {
      "bg": "#1a1a2e",
      "surface": "rgba(255,255,255,0.03)",
      "surfaceHover": "rgba(255,255,255,0.045)",
      "border": "rgba(255,255,255,0.06)",
      "accent": "#e94560",
      "accent2": "#0f3460",
      "green": "#4ade80",
      "yellow": "#facc15",
      "red": "#f87171",
      "orange": "#fb923c",
      "purple": "#a78bfa",
      "text": "#e5e5e5",
      "textStrong": "#ffffff",
      "muted": "#737373",
      "dim": "#525252",
      "darker": "#404040",
      "tableBg": "rgba(255,255,255,0.025)",
      "tableHover": "rgba(255,255,255,0.05)",
      "scrollThumb": "rgba(255,255,255,0.1)"
    }
  }
}server.py ← HTTP server + /api/refresh + /api/chat endpoints
├── index.html ← Single-page dashboard (fetches /api/refresh, /api/chat)
├── themes.json ← Theme definitions (user-editable)
├── refresh.sh ← Data collection script (called by server.py)
└── data.json ← Generated data (auto-refreshed)
When you open the dashboard, index.html calls /api/refresh. The server runs refresh.sh (with 30s debounce) to collect fresh data from your OpenClaw installation, then returns the JSON. No cron jobs needed.
The /api/chat endpoint accepts {"question": "...", "history": [...]} and forwards a stateless request to the OpenClaw gateway's OpenAI-compatible /v1/chat/completions endpoint, with a system prompt built from live data.json.
Edit config.json:
{
  "bot": {
    "name": "My Bot",
    "emoji": "🤖"
  },
  "theme": {
    "preset": "nord"
  },
  "refresh": {
    "intervalSeconds": 30
  },
  "server": {
    "port": 8080,
    "host": "127.0.0.1"
  },
  "ai": {
    "enabled": true,
    "gatewayPort": 18789,
    "model": "kimi-coding/k2p5",
    "maxHistory": 6,
    "dotenvPath": "~/.openclaw/.env"
  }
}| Key | Default | Description |
|---|---|---|
bot.name |
"OpenClaw Dashboard" |
Dashboard title |
bot.emoji |
"🦞" |
Avatar emoji |
theme.preset |
"midnight" |
Default theme (midnight, nord, catppuccin-mocha, github-light, solarized-light, catppuccin-latte) |
panels.* |
true |
Show/hide individual panels (panels.kanban is legacy/no-op) |
refresh.intervalSeconds |
30 |
Debounce interval for refresh |
alerts.dailyCostHigh |
50 |
Daily cost threshold for high alert ($) |
alerts.dailyCostWarn |
20 |
Daily cost threshold for warning alert ($) |
alerts.contextPct |
80 |
Context usage % threshold for alerts |
alerts.memoryMb |
640 |
Gateway memory threshold (MB) for alerts |
server.port |
8080 |
Server port (also --port / -p flag or DASHBOARD_PORT env) |
server.host |
"127.0.0.1" |
Server bind address (also --bind / -b flag or DASHBOARD_BIND env) |
openclawPath |
"~/.openclaw" |
Legacy key; runtime path is currently controlled by OPENCLAW_HOME env var |
ai.enabled |
true |
Enable/disable the AI chat panel and /api/chat endpoint |
ai.gatewayPort |
18789 |
Port of your OpenClaw gateway |
ai.model |
"kimi-coding/k2p5" |
Model to use for chat (any model registered in your gateway) |
ai.maxHistory |
6 |
Number of previous messages to include for context |
ai.dotenvPath |
"~/.openclaw/.env" |
Path to .env file containing OPENCLAW_GATEWAY_TOKEN
|
The chat panel requires:
- Your OpenClaw gateway running with the
chatCompletionsendpoint enabled:"gateway": { "http": { "endpoints": { "chatCompletions": { "enabled": true } } } }
-
OPENCLAW_GATEWAY_TOKENset in your.envfile (defaults to~/.openclaw/.env)
The chat is stateless — each question is sent directly to the gateway with a system prompt built from live data.json. No agent memory or tools bleed in.
See docs/CONFIGURATION.md for full details.
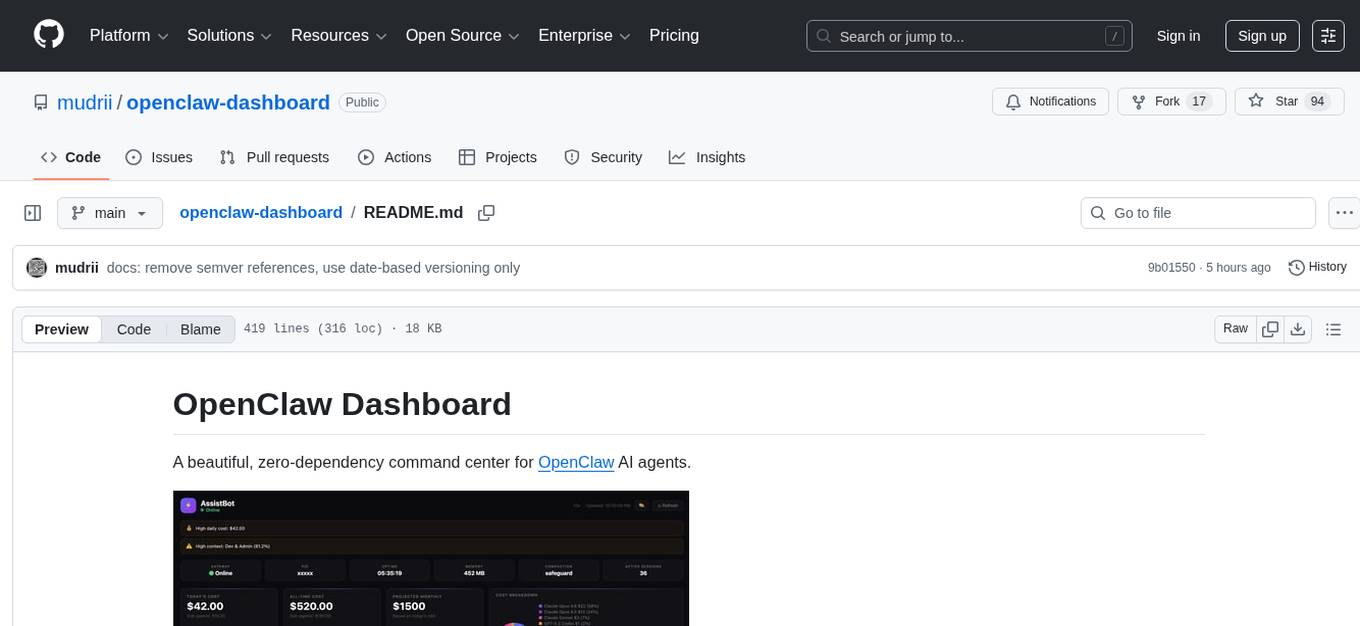
Full dashboard view — all sections at a glance:

Real-time bot status, gateway uptime, memory usage, active session count, today's cost, all-time spend, projected monthly cost, and a per-model cost breakdown donut chart. Smart alert banners surface high costs, failed crons, and context overflows automatically.

Three always-visible SVG charts with 7d/30d toggle: cost trend over time, per-model cost breakdown bars, and sub-agent activity volume. No external chart libraries — pure inline SVG.

All scheduled jobs with status badges (active/idle/error), schedule expression, last run time, next run, duration, and the model used. At-a-glance view of your automation health.

Live sessions with model, type badges (DM / group / subagent), context usage %, and token count. Above the session list: a visual agent hierarchy tree showing parent → sub-agent → sub-sub-agent relationships with live/idle status and trigger labels — updated every refresh.

Per-model token and cost breakdown with 7d / 30d / all-time tabs. Includes input tokens, output tokens, cache reads, and total cost per model — sortable at a glance.

All sub-agent runs with cost, duration, status, and token breakdown. Separate 7d/30d tabs. Useful for tracking which tasks spawn the most agents and where spend is concentrated.

Quick reference panel showing all configured models, active skills, and the last 5 git commits from your OpenClaw workspace — so you always know what's deployed.

Full agent setup at a glance: model routing chain (primary → fallbacks), sub-agent routing by purpose (General / Dev+Coding / Work), agent details table with per-agent fallbacks, agent bindings with resolved group names, runtime config (compaction, memory flush), and subagent limits (max depth, max children/agent).

./uninstall.shOr manually:
# macOS
launchctl unload ~/Library/LaunchAgents/com.openclaw.dashboard.plist
rm -rf ~/.openclaw/dashboard

# Linux
systemctl --user stop openclaw-dashboard
rm -rf ~/.openclaw/dashboard- Python 3.6+ — Backend server and data collection
-
OpenClaw — Installed at
~/.openclaw(docs) - macOS 10.15+ or Linux (Ubuntu 18.04+, Debian 10+)
- Modern web browser
- New: AI chat panel (💬 FAB) — ask natural language questions about costs, sessions, crons, and config
-
New:
/api/chatendpoint backed by the OpenClaw gateway's OpenAI-compatible completions API -
New:
read_dotenv()loadsOPENCLAW_GATEWAY_TOKENfrom~/.openclaw/.envautomatically -
New:
build_dashboard_prompt()compresses livedata.jsoninto a structured system prompt -
New:
aiconfig section —enabled,gatewayPort,model,maxHistory,dotenvPath - Improved: Stateless gateway calls — no agent memory or tool bleed between sessions
- Fixed: 60s gateway timeout (up from 30s) to accommodate reasoning model latency
- Tests: 14 new chat tests added (AC-CHAT-1 through AC-CHAT-8)
-
Version:
2.3.0→2.4.0
-
Fixed:
refresh.shnow correctly handles agents with dictionary-stylemodelconfigs (containingprimaryandfallbackskeys). Previously, dict-type model configs caused TypeError and prevented those agents from appearing in the dashboard. (Fixes #2)
- New: Dynamic channels panel renders all configured/runtime channels (Slack, Discord, Telegram, WhatsApp, and unknown future channels)
-
Improved: Connected/Health now show explicit
Unknownfallback when runtime signal is absent - New: Runtime channel-status backfill from recent session activity (marks active channels as connected/health=active when explicit status is missing)
- New: Agent Bindings includes inferred IMPLICIT routes for channels without explicit binding entries
- Quality: Generic single-agent and multi-agent compatibility validated
- Security: XSS-safe escaping preserved for all dynamic channel/binding values
- Tests: 46/46 passing, independently validated with Opus
-
New: Section dirty-checking —
prevDsnapshot +sectionChanged()skips unchanged DOM sections on every refresh -
New:
requestAnimationFramebatching for render calls - New: Scroll position preservation for cron and session tables
- Fixed: Tab switching (7d/30d/today) correctly triggers re-render after dirty-check introduction
- Fixed: Cross-tab dirty-check contamination between token usage and sub-token sections
-
Fixed: Invalid
chartDayskey insectionChanged(),t.colorsnull guard in theme menu - New: Full ATDD test suite — 44 acceptance criteria across 4 test files
-
New:
ARCHITECTURE.md— clean module design for future refactor -
New:
TODO.md— backlog with version plan - New: GitHub link + version badge in header
- New: "Why This Exists" section in README
- New: 🌳 Agent Hierarchy Tree in Active Sessions — 3-level CSS indented cards showing parent→child agent relationships
- New: Sub-agent Routing section in Model Routing panel
- Improved: Agent Bindings redesign — resolved group names + main agent catch-all display
- New: Fallbacks column in Agent Details table
- New: Subagent Limits panel
- Improved: Font size consistency fixes across Agent Config section
- Improved: Runtime Config channel rows compact layout
- New: 📈 Charts & Trends section — 3 always-visible pure SVG charts (cost trend, model breakdown, sub-agent activity)
- New: 7d/30d time filter tabs on Token Usage, Sub-Agent Activity, and Sub-Agent Token Breakdown panels
- New: Charts have their own 7d/30d toggle, default to 7 days
-
New: Daily aggregation in
refresh.sh— 30 days ofdailyChartdata with per-model cost breakdown -
New:
models_7d,models_30d,subagent_7d,subagent_30ddata buckets -
Improved:
refresh.shnow collects 35 data keys for richer time-series analysis
- New: 🎨 Multi-theme support — 6 built-in themes (3 dark + 3 light)
- New: Theme switcher in header bar — instant CSS variable swap, no reload needed
-
New:
themes.json— external theme definitions, user-editable for custom themes -
New: Themes persist via
localStorageacross page refreshes -
New:
TECHNICAL.md— comprehensive developer documentation (architecture, data pipeline, schema, security) - Improved: Replaced ~20 hardcoded color values with CSS custom properties for full theme support
-
New:
--bind/-bflag for LAN access (--bind 0.0.0.0) -
New:
--port/-pflag for custom port -
New:
--version/-Vflag -
New:
DASHBOARD_BINDandDASHBOARD_PORTenvironment variables -
New:
config.jsonsupport forserver.hostandserver.portsettings -
New:
refresh.intervalSecondsconfig option for debounce tuning -
New: Auto-detect and display LAN IP when binding to
0.0.0.0 - Improved: Config priority chain: CLI flags > env vars > config.json > defaults
-
Improved:
--helpwith usage examples
- New: Complete UI redesign with glass morphism dark theme
-
New:
server.pywith on-demand/api/refreshendpoint (replacespython3 -m http.server) - New: 10 dashboard panels (up from 4)
- New: Sub-agent activity tracking with cost and token breakdown
- New: Smart alerts system (cost warnings, failed crons, high context, gateway offline)
- New: System health row (gateway, PID, uptime, memory, compaction, sessions)
- New: Cost donut chart with per-model breakdown
- New: Kanban board for task tracking
- New: Active sessions panel with context % bars and type badges
- New: Git log panel
- New: Auto-refresh with 60s countdown
- Improved: Token usage tables with today/all-time toggle
-
Improved:
refresh.shauto-discovers all sessions, crons, models, skills - Improved: Responsive layout for mobile/tablet
- Initial release with basic token usage and cron panels
See CONTRIBUTING.md for guidelines.
MIT License — see LICENSE
Made with 🦞 for the OpenClaw community
For Tasks:
Click tags to check more tools for each tasksFor Jobs:
Alternative AI tools for openclaw-dashboard
Similar Open Source Tools
openclaw-dashboard
OpenClaw Dashboard is a beautiful, zero-dependency command center for OpenClaw AI agents. It provides a single local page that collects gateway health, costs, cron status, active sessions, sub-agent runs, model usage, and git log in one place, refreshed automatically without login or external dependencies. It aims to offer an at-a-glance overview layer for users to monitor the health of their OpenClaw setup and make informed decisions quickly without the need to search through log files or run CLI commands.
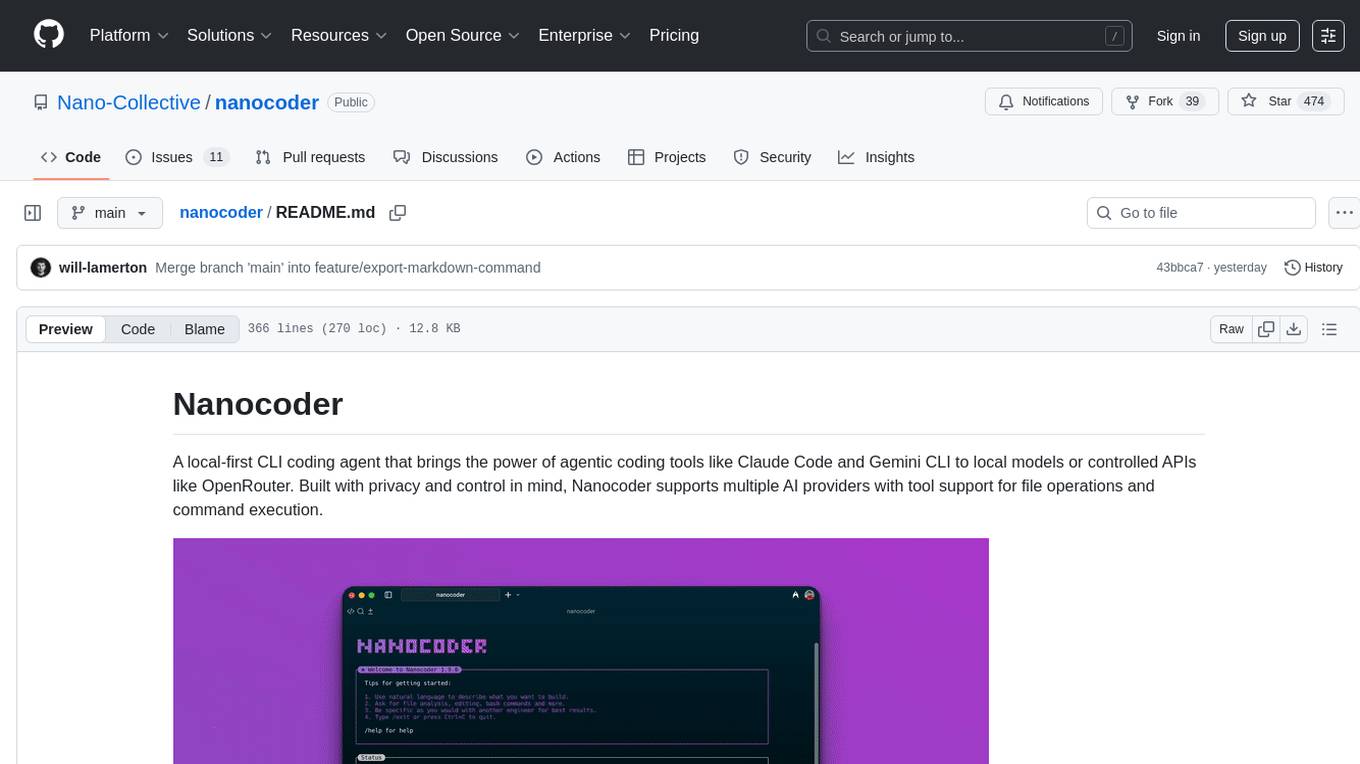
nanocoder
Nanocoder is a versatile code editor designed for beginners and experienced programmers alike. It provides a user-friendly interface with features such as syntax highlighting, code completion, and error checking. With Nanocoder, you can easily write and debug code in various programming languages, making it an ideal tool for learning, practicing, and developing software projects. Whether you are a student, hobbyist, or professional developer, Nanocoder offers a seamless coding experience to boost your productivity and creativity.
ai-counsel
AI Counsel is a true deliberative consensus MCP server where AI models engage in actual debate, refine positions across multiple rounds, and converge with voting and confidence levels. It features two modes (quick and conference), mixed adapters (CLI tools and HTTP services), auto-convergence, structured voting, semantic grouping, model-controlled stopping, evidence-based deliberation, local model support, data privacy, context injection, semantic search, fault tolerance, and full transcripts. Users can run local and cloud models to deliberate on various questions, ground decisions in reality by querying code and files, and query past decisions for analysis. The tool is designed for critical technical decisions requiring multi-model deliberation and consensus building.
tokscale
Tokscale is a high-performance CLI tool and visualization dashboard for tracking token usage and costs across multiple AI coding agents. It helps monitor and analyze token consumption from various AI coding tools, providing real-time pricing calculations using LiteLLM's pricing data. Inspired by the Kardashev scale, Tokscale measures token consumption as users scale the ranks of AI-augmented development. It offers interactive TUI mode, multi-platform support, real-time pricing, detailed breakdowns, web visualization, flexible filtering, and social platform features.
claude_code_bridge
Claude Code Bridge (ccb) is a new multi-model collaboration tool that enables effective collaboration among multiple AI models in a split-pane CLI environment. It offers features like visual and controllable interface, persistent context maintenance, token savings, and native workflow integration. The tool allows users to unleash the full power of CLI by avoiding model bias, cognitive blind spots, and context limitations. It provides a new WYSIWYG solution for multi-model collaboration, making it easier to control and visualize multiple AI models simultaneously.
code_puppy
Code Puppy is an AI-powered code generation agent designed to understand programming tasks, generate high-quality code, and explain its reasoning. It supports multi-language code generation, interactive CLI, and detailed code explanations. The tool requires Python 3.9+ and API keys for various models like GPT, Google's Gemini, Cerebras, and Claude. It also integrates with MCP servers for advanced features like code search and documentation lookups. Users can create custom JSON agents for specialized tasks and access a variety of tools for file management, code execution, and reasoning sharing.
OpenMemory
OpenMemory is a cognitive memory engine for AI agents, providing real long-term memory capabilities beyond simple embeddings. It is self-hosted and supports Python + Node SDKs, with integrations for various tools like LangChain, CrewAI, AutoGen, and more. Users can ingest data from sources like GitHub, Notion, Google Drive, and others directly into memory. OpenMemory offers explainable traces for recalled information and supports multi-sector memory, temporal reasoning, decay engine, waypoint graph, and more. It aims to provide a true memory system rather than just a vector database with marketing copy, enabling users to build agents, copilots, journaling systems, and coding assistants that can remember and reason effectively.
alphora
Alphora is a full-stack framework for building production AI agents, providing agent orchestration, prompt engineering, tool execution, memory management, streaming, and deployment with an async-first, OpenAI-compatible design. It offers features like agent derivation, reasoning-action loop, async streaming, visual debugger, OpenAI compatibility, multimodal support, tool system with zero-config tools and type safety, prompt engine with dynamic prompts, memory and storage management, sandbox for secure execution, deployment as API, and more. Alphora allows users to build sophisticated AI agents easily and efficiently.
agentfield
AgentField is an open-source control plane designed for autonomous AI agents, providing infrastructure for agents to make decisions beyond chatbots. It offers features like scaling infrastructure, routing & discovery, async execution, durable state, observability, trust infrastructure with cryptographic identity, verifiable credentials, and policy enforcement. Users can write agents in Python, Go, TypeScript, or interact via REST APIs. The tool enables the creation of AI backends that reason autonomously within defined boundaries, offering predictability and flexibility. AgentField aims to bridge the gap between AI frameworks and production-ready infrastructure for AI agents.
automem
AutoMem is a production-grade long-term memory system for AI assistants, achieving 90.53% accuracy on the LoCoMo benchmark. It combines FalkorDB (Graph) and Qdrant (Vectors) storage systems to store, recall, connect, learn, and perform with memories. AutoMem enables AI assistants to remember, connect, and evolve their understanding over time, similar to human long-term memory. It implements techniques from peer-reviewed memory research and offers features like multi-hop bridge discovery, knowledge graphs that evolve, 9-component hybrid scoring, memory consolidation cycles, background intelligence, 11 relationship types, and more. AutoMem is benchmark-proven, research-validated, and production-ready, with features like sub-100ms recall, concurrent writes, automatic retries, health monitoring, dual storage redundancy, and automated backups.
zeroclaw
ZeroClaw is a fast, small, and fully autonomous AI assistant infrastructure built with Rust. It features a lean runtime, cost-efficient deployment, fast cold starts, and a portable architecture. It is secure by design, fully swappable, and supports OpenAI-compatible provider support. The tool is designed for low-cost boards and small cloud instances, with a memory footprint of less than 5MB. It is suitable for tasks like deploying AI assistants, swapping providers/channels/tools, and pluggable everything.
trpc-agent-go
A powerful Go framework for building intelligent agent systems with large language models (LLMs), hierarchical planners, memory, telemetry, and a rich tool ecosystem. tRPC-Agent-Go enables the creation of autonomous or semi-autonomous agents that reason, call tools, collaborate with sub-agents, and maintain long-term state. The framework provides detailed documentation, examples, and tools for accelerating the development of AI applications.
dexto
Dexto is a lightweight runtime for creating and running AI agents that turn natural language into real-world actions. It serves as the missing intelligence layer for building AI applications, standalone chatbots, or as the reasoning engine inside larger products. Dexto features a powerful CLI and Web UI for running AI agents, supports multiple interfaces, allows hot-swapping of LLMs from various providers, connects to remote tool servers via the Model Context Protocol, is config-driven with version-controlled YAML, offers production-ready core features, extensibility for custom services, and enables multi-agent collaboration via MCP and A2A.
ctinexus
CTINexus is a framework that leverages optimized in-context learning of large language models to automatically extract cyber threat intelligence from unstructured text and construct cybersecurity knowledge graphs. It processes threat intelligence reports to extract cybersecurity entities, identify relationships between security concepts, and construct knowledge graphs with interactive visualizations. The framework requires minimal configuration, with no extensive training data or parameter tuning needed.
LLMTSCS
LLMLight is a novel framework that employs Large Language Models (LLMs) as decision-making agents for Traffic Signal Control (TSC). The framework leverages the advanced generalization capabilities of LLMs to engage in a reasoning and decision-making process akin to human intuition for effective traffic control. LLMLight has been demonstrated to be remarkably effective, generalizable, and interpretable against various transportation-based and RL-based baselines on nine real-world and synthetic datasets.
For similar tasks
openclaw-dashboard
OpenClaw Dashboard is a beautiful, zero-dependency command center for OpenClaw AI agents. It provides a single local page that collects gateway health, costs, cron status, active sessions, sub-agent runs, model usage, and git log in one place, refreshed automatically without login or external dependencies. It aims to offer an at-a-glance overview layer for users to monitor the health of their OpenClaw setup and make informed decisions quickly without the need to search through log files or run CLI commands.
For similar jobs
sweep
Sweep is an AI junior developer that turns bugs and feature requests into code changes. It automatically handles developer experience improvements like adding type hints and improving test coverage.
teams-ai
The Teams AI Library is a software development kit (SDK) that helps developers create bots that can interact with Teams and Microsoft 365 applications. It is built on top of the Bot Framework SDK and simplifies the process of developing bots that interact with Teams' artificial intelligence capabilities. The SDK is available for JavaScript/TypeScript, .NET, and Python.
ai-guide
This guide is dedicated to Large Language Models (LLMs) that you can run on your home computer. It assumes your PC is a lower-end, non-gaming setup.
classifai
Supercharge WordPress Content Workflows and Engagement with Artificial Intelligence. Tap into leading cloud-based services like OpenAI, Microsoft Azure AI, Google Gemini and IBM Watson to augment your WordPress-powered websites. Publish content faster while improving SEO performance and increasing audience engagement. ClassifAI integrates Artificial Intelligence and Machine Learning technologies to lighten your workload and eliminate tedious tasks, giving you more time to create original content that matters.
chatbot-ui
Chatbot UI is an open-source AI chat app that allows users to create and deploy their own AI chatbots. It is easy to use and can be customized to fit any need. Chatbot UI is perfect for businesses, developers, and anyone who wants to create a chatbot.
BricksLLM
BricksLLM is a cloud native AI gateway written in Go. Currently, it provides native support for OpenAI, Anthropic, Azure OpenAI and vLLM. BricksLLM aims to provide enterprise level infrastructure that can power any LLM production use cases. Here are some use cases for BricksLLM: * Set LLM usage limits for users on different pricing tiers * Track LLM usage on a per user and per organization basis * Block or redact requests containing PIIs * Improve LLM reliability with failovers, retries and caching * Distribute API keys with rate limits and cost limits for internal development/production use cases * Distribute API keys with rate limits and cost limits for students
uAgents
uAgents is a Python library developed by Fetch.ai that allows for the creation of autonomous AI agents. These agents can perform various tasks on a schedule or take action on various events. uAgents are easy to create and manage, and they are connected to a fast-growing network of other uAgents. They are also secure, with cryptographically secured messages and wallets.
griptape
Griptape is a modular Python framework for building AI-powered applications that securely connect to your enterprise data and APIs. It offers developers the ability to maintain control and flexibility at every step. Griptape's core components include Structures (Agents, Pipelines, and Workflows), Tasks, Tools, Memory (Conversation Memory, Task Memory, and Meta Memory), Drivers (Prompt and Embedding Drivers, Vector Store Drivers, Image Generation Drivers, Image Query Drivers, SQL Drivers, Web Scraper Drivers, and Conversation Memory Drivers), Engines (Query Engines, Extraction Engines, Summary Engines, Image Generation Engines, and Image Query Engines), and additional components (Rulesets, Loaders, Artifacts, Chunkers, and Tokenizers). Griptape enables developers to create AI-powered applications with ease and efficiency.