AI tools for data visualization OpenAI API
Related Tools:
Glama
Glama is an all-in-one AI workspace that allows users to upload, analyze, and visualize data. It provides access to various AI models with a single account, offering features like agents, MCP, prompt templates, and more. Users can compare AI responses, transform text into diagrams, solve math problems, and stay updated with new AI models. Glama ensures data security, seamless teamwork, and compatibility with OpenAI API.
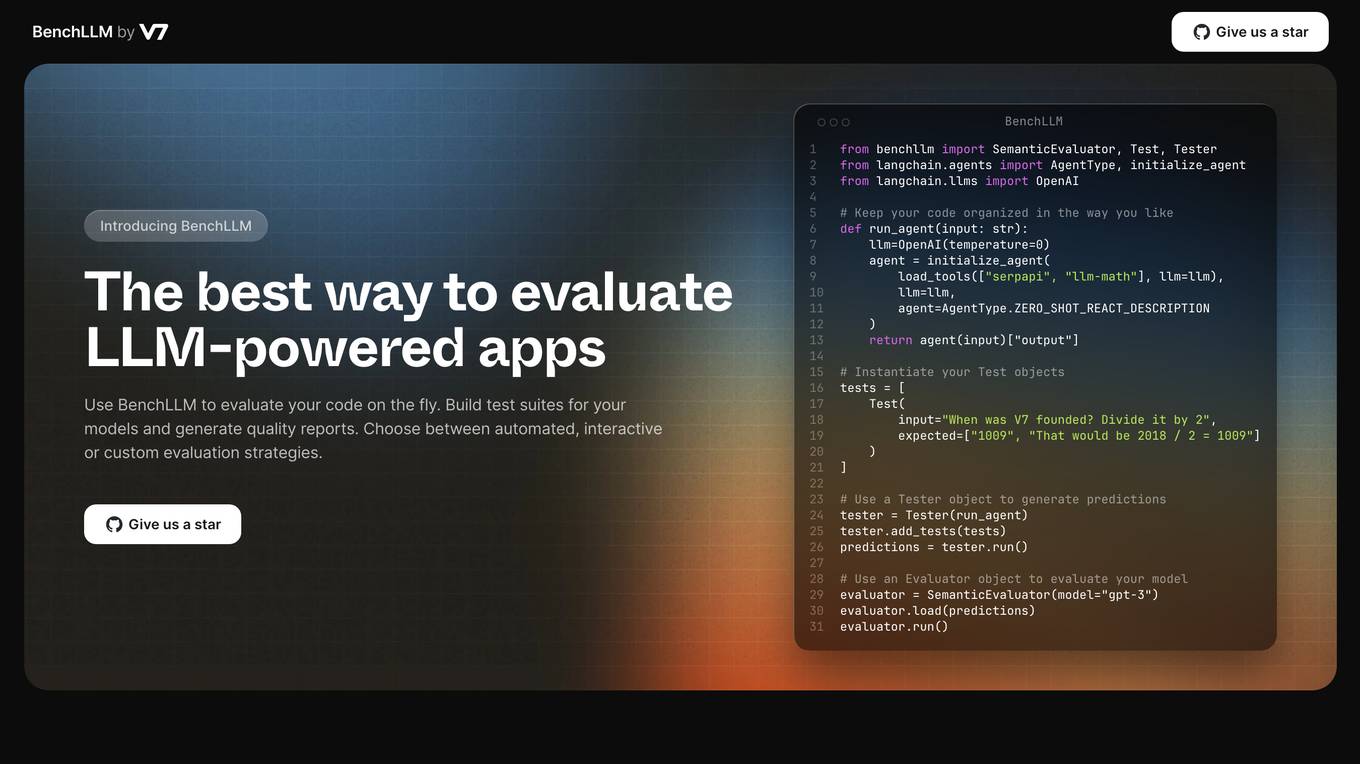
BenchLLM
BenchLLM is an AI tool designed for AI engineers to evaluate LLM-powered apps by running and evaluating models with a powerful CLI. It allows users to build test suites, choose evaluation strategies, and generate quality reports. The tool supports OpenAI, Langchain, and other APIs out of the box, offering automation, visualization of reports, and monitoring of model performance.
ChatCSV
ChatCSV is your personal data analyst that allows you to interact with your spreadsheets in a conversational manner. Simply upload a CSV file and start asking questions to get insights through visualizations. It is designed to assist users across various industries such as retail, finance, banking, marketing, and more, making data analysis more accessible and intuitive.
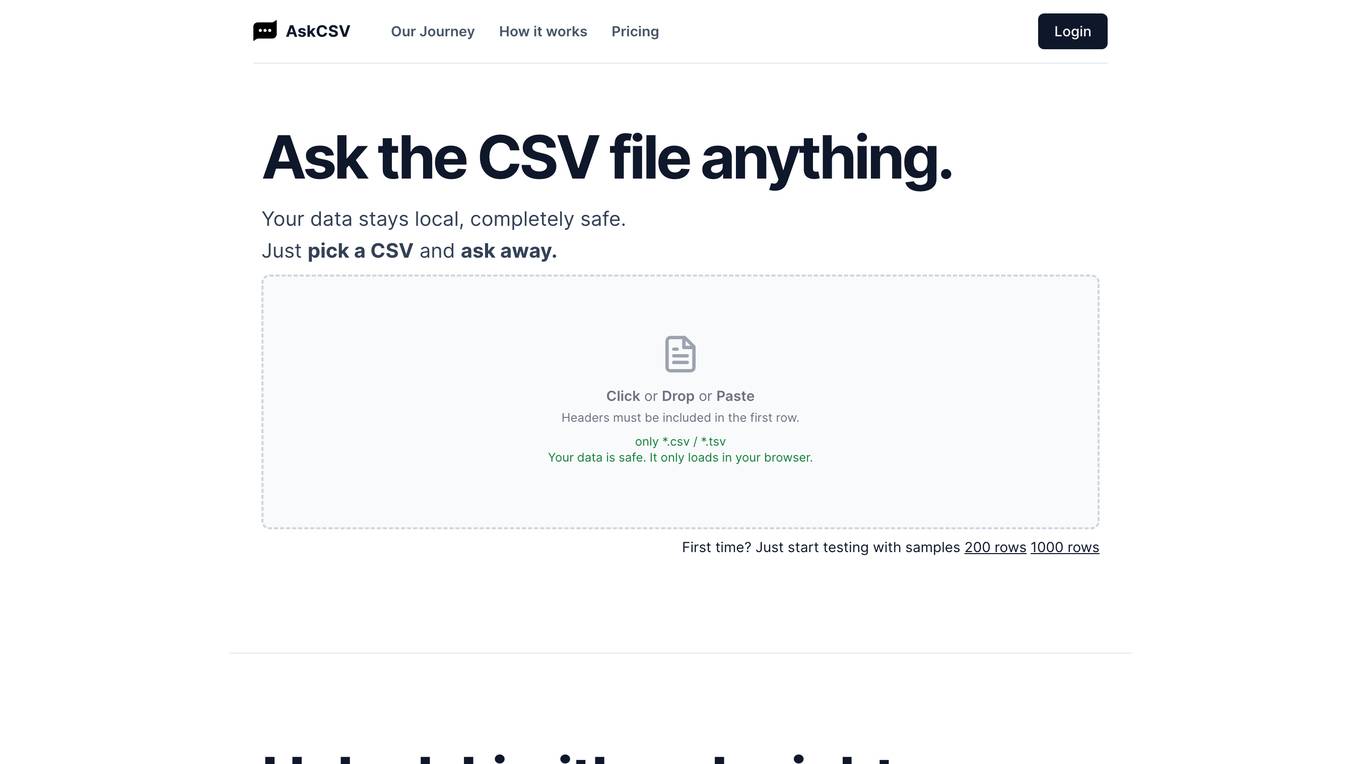
AskCSV
AskCSV is a revolutionary AI-powered tool that empowers you to unlock valuable insights from your CSV files. Simply ask any question about your data, and AskCSV will provide you with instant, accurate answers and visualizations. Your data remains completely secure, processed directly in your browser's memory without any server uploads. With AskCSV, you can effortlessly analyze your data, identify trends, make informed decisions, and gain a deeper understanding of your business.
Powerdrill
Powerdrill is a platform that provides swift insights from knowledge and data. It offers a range of features such as discovering datasets, creating BI dashboards, accessing various apps, resources, blogs, documentation, and changelogs. The platform is available in English and fosters a community through its affiliate program. Users can sign up for a basic plan to start utilizing the tools and services offered by Powerdrill.
MacroMicro
MacroMicro is an AI analytics platform that combines technology and research expertise to empower users with valuable insights into global market trends. With over 0k registered users and 0M+ monthly website traffic, MacroMicro offers real-time charts, cycle analysis, and data-driven insights to optimize investment strategies. The platform compiles the MM Global Recession Probability, utilizes OpenAI's Embedding technology, and provides exclusive reports and analysis on key market events. Users can access dynamic and automatically-updated charts, a powerful toolbox for analysis, and engage with a vibrant community of macroeconomic professionals.
ChatViz
ChatViz is an AI-powered data visualization tool that leverages ChatGPT to enhance data visualization capabilities. It offers features such as SQL translator and chart suggestion to streamline the visualization process. By utilizing ChatViz, users can optimize development time, simplify data visualization, and say goodbye to dashboard complexity. The tool provides a new way to visualize data, reducing development time and improving user experience.
dataset.macgence
dataset.macgence is an AI-powered data analysis tool that helps users extract valuable insights from their datasets. It offers a user-friendly interface for uploading, cleaning, and analyzing data, making it suitable for both beginners and experienced data analysts. With advanced algorithms and visualization capabilities, dataset.macgence enables users to uncover patterns, trends, and correlations in their data, leading to informed decision-making. Whether you're a business professional, researcher, or student, dataset.macgence can streamline your data analysis process and enhance your data-driven strategies.
ChartPixel
ChartPixel is an AI-assisted data analysis platform that empowers users to effortlessly generate charts, insights, and actionable statistics in just 30 seconds. The platform is designed to demystify data and analysis, making it accessible to users of all skill levels. ChartPixel combines the power of AI with domain expertise to provide secure and reliable output, ensuring trustworthy results without compromising data privacy. With user-friendly features and educational tools, ChartPixel helps users clean, wrangle, visualize, and present data with ease, catering to both beginners and professionals.
Columns
Columns is an AI tool that automates data storytelling. It enables users to create compelling narratives and visualizations from their data without the need for manual intervention. With Columns, users can easily transform raw data into engaging stories, making data analysis more accessible and impactful. The tool leverages advanced algorithms to analyze data sets, identify patterns, and generate insights that can be presented in a visually appealing format. Columns streamlines the process of data storytelling, saving users time and effort while enhancing the effectiveness of their data-driven communication.
ChartFast
ChartFast is an AI Data Analyzer tool that automates data visualization and analysis tasks, powered by GPT-4 technology. It allows users to generate precise and sleek graphs in seconds, process vast amounts of data, and provide interactive data queries and quick exports. With features like specialized internal libraries for complex graph generation, customizable visualization code, and instant data export, ChartFast aims to streamline data work and enhance data analysis efficiency.
SheetBot AI
SheetBot AI is an AI data analyst tool that enables users to analyze data quickly without the need for coding. It automates repetitive and time-consuming data tasks, making data visualization and analysis more efficient. With SheetBot AI, users can generate accurate and visually appealing graphs in seconds, streamlining the data analysis process.
Findly
Findly is a data analytics platform that allows users to ask questions about their data and receive insights and reports. It integrates with various data sources such as Google Analytics, Facebook Ads, and BigQuery, and provides features such as data visualization, scheduled reporting, and templates. Findly is designed to make data analysis accessible and actionable for everyone on a team, regardless of their technical expertise.
Dot Analytics
Dot Analytics is a growth-focused data analytics agency that offers a wide range of services including data analytics, data engineering, data visualization, data science, big data analytics, AI consulting, and more. They specialize in providing analytics solutions for data-driven business managers seeking accuracy, statistics, and data to drive revenue growth. With over 6 years of experience, they offer tailored analytics solutions to optimize customer acquisition cost, lifetime value, average order value, and conversions. Dot Analytics partners with clients from various industries to provide transparent, maintenance, and optimization services.
InfraNodus
InfraNodus is a text network visualization tool that helps users generate insights from any discourse by representing it as a network. It uses AI-powered algorithms to identify structural gaps in the text and suggest ways to bridge them. InfraNodus can be used for a variety of purposes, including research, creative writing, marketing, and SEO.
Slate Technologies Solutions
Slate Technologies Solutions is an AI-powered data analytics software that leverages predictive AI, generative AI, and conversational AI to provide a powerful toolkit for next-generation construction. The software connects, contextualizes, and enhances relevant information within existing data sources, allowing users to query, interact, and make decisions based on data insights and recommendations. Slate aims to address real-world construction problems by empowering teams with AI-driven intelligence, optimizing data, and turning unstructured information into actionable insights. The application improves operational efficiency, provides real-time progress reporting, and enables teams to make smarter decisions, ultimately driving profitability and success in construction projects.
Onvo AI
Onvo AI is an embedded data visualization platform that allows users to create interactive dashboards and data visualizations using simple AI prompts. It connects to various data sources, enabling users to build insightful charts and visualizations without the need for complex queries or manual data manipulation. Onvo AI offers customization options, allowing users to match their brand's identity and provides secure sharing and embedding features. It also includes analytics capabilities, enabling users to track dashboard usage and user engagement.
OSS Insight
OSS Insight is an AI tool that provides deep insight into developers and repositories on GitHub, offering information about stars, pull requests, issues, pushes, comments, and reviews. It utilizes artificial intelligence to analyze data and provide valuable insights to users. The tool ranks repositories, tracks trending repositories, and offers real-time information about GitHub events. Additionally, it offers features like data exploration, collections, live blog, API integration, and widgets.
Compact Data Science
Compact Data Science is a data science platform that provides a comprehensive set of tools and resources for data scientists and analysts. The platform includes a variety of features such as data preparation, data visualization, machine learning, and predictive analytics. Compact Data Science is designed to be easy to use and accessible to users of all skill levels.
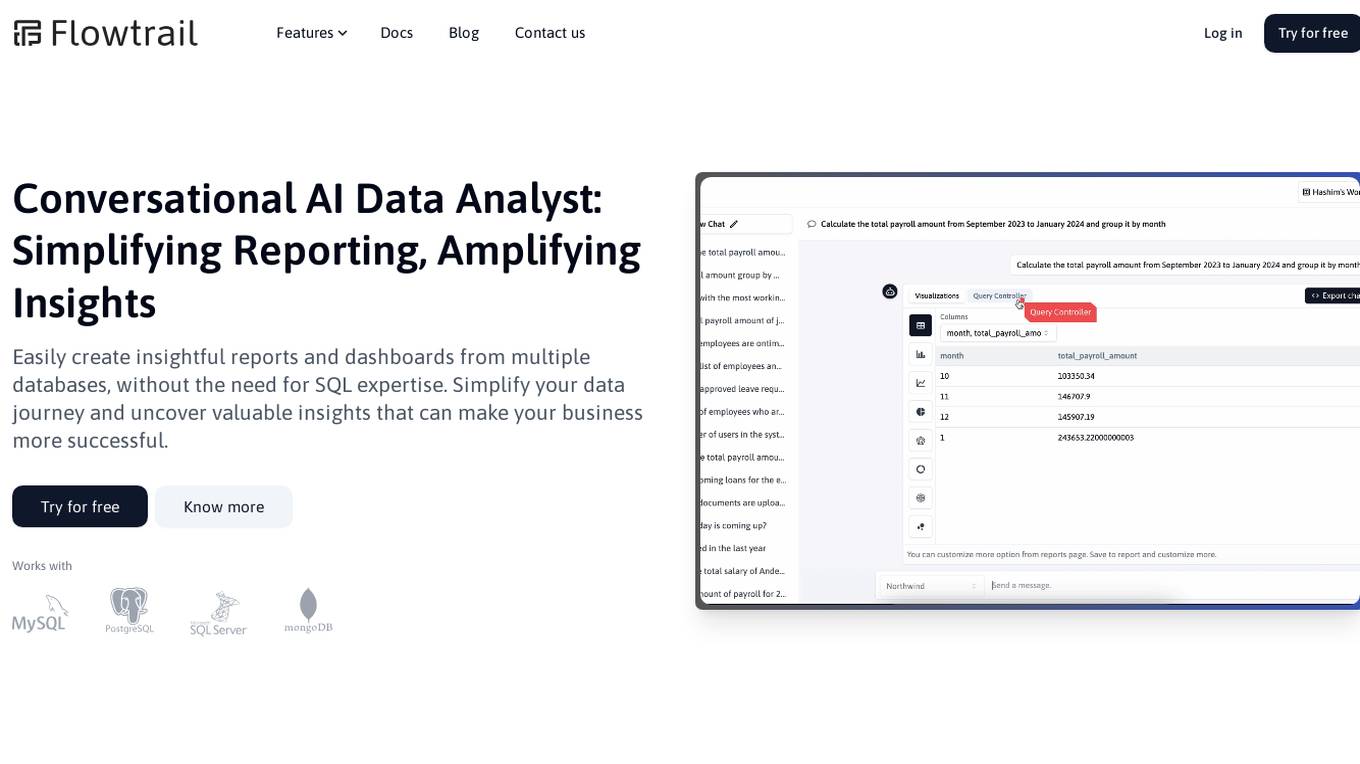
Flowtrail AI
Flowtrail AI is a powerful data analytics platform that simplifies reporting and amplifies insights for businesses. It allows users to effortlessly create insightful reports and dashboards from multiple databases without the need for SQL expertise. With features like AI-driven query building, natural language processing, and text-to-SQL conversion, Flowtrail AI transforms data into actionable insights, making data-driven decision-making more efficient and effective.
Data Analytics Specialist
Leading Big Data Analytics tool, blending advanced technology with OpenAI's expertise.
Emmi Data Analysis and Visualizer
Expert in data analysis and visualization, offering clear explanations and guidance.
Illuminous - The Data Exploration AI
Expert in data analysis, visualizations, and predictions.
Plotter
Provide a hand-drawing or screenshot of your desired plot along with the data and I'll make the plot.
Sheets Expert
Master the art of Google Sheets with an assistant who can do everything from answer questions about basic features, explain functions in an eloquent and succinct manner, simplify the most complex formulas into easy steps, and help you identify techniques to effectively visualize your data.
Vicky Vega
Generates Vega-Lite JSON code for Power BI visuals from data and descriptions.
Time Tracker Visualizer (See Stats from Toggl)
I turn Toggl data into insightful visuals. Get your data from Settings (in Toggl Track) -> Data Export -> Export Time Entries. Ask for bonus analyses and plots :)
Addy™ for Power BI Data Analytics
Advisor for Power BI Analytics, aiding in solution planning, design, and construction. Ask Hi or type /help for how to get started.
data-juicer
Data-Juicer is a one-stop data processing system to make data higher-quality, juicier, and more digestible for LLMs. It is a systematic & reusable library of 80+ core OPs, 20+ reusable config recipes, and 20+ feature-rich dedicated toolkits, designed to function independently of specific LLM datasets and processing pipelines. Data-Juicer allows detailed data analyses with an automated report generation feature for a deeper understanding of your dataset. Coupled with multi-dimension automatic evaluation capabilities, it supports a timely feedback loop at multiple stages in the LLM development process. Data-Juicer offers tens of pre-built data processing recipes for pre-training, fine-tuning, en, zh, and more scenarios. It provides a speedy data processing pipeline requiring less memory and CPU usage, optimized for maximum productivity. Data-Juicer is flexible & extensible, accommodating most types of data formats and allowing flexible combinations of OPs. It is designed for simplicity, with comprehensive documentation, easy start guides and demo configs, and intuitive configuration with simple adding/removing OPs from existing configs.

ai-data-science-team
The AI Data Science Team of Copilots is an AI-powered data science team that uses agents to help users perform common data science tasks 10X faster. It includes agents specializing in data cleaning, preparation, feature engineering, modeling, and interpretation of business problems. The project is a work in progress with new data science agents to be released soon. Disclaimer: This project is for educational purposes only and not intended to replace a company's data science team. No warranties or guarantees are provided, and the creator assumes no liability for financial loss.
ST-Raptor
ST-Raptor is a powerful open-source tool for analyzing and visualizing spatial-temporal data. It provides a user-friendly interface for exploring complex datasets and generating insightful visualizations. With ST-Raptor, users can easily identify patterns, trends, and anomalies in their spatial-temporal data, making it ideal for researchers, analysts, and data scientists working with geospatial and time-series data.
hongbomiao.com
hongbomiao.com is a personal research and development (R&D) lab that facilitates the sharing of knowledge. The repository covers a wide range of topics including web development, mobile development, desktop applications, API servers, cloud native technologies, data processing, machine learning, computer vision, embedded systems, simulation, database management, data cleaning, data orchestration, testing, ops, authentication, authorization, security, system tools, reverse engineering, Ethereum, hardware, network, guidelines, design, bots, and more. It provides detailed information on various tools, frameworks, libraries, and platforms used in these domains.
Auto-Analyst
Auto-Analyst is an AI-driven data analytics agentic system designed to simplify and enhance the data science process. By integrating various specialized AI agents, this tool aims to make complex data analysis tasks more accessible and efficient for data analysts and scientists. Auto-Analyst provides a streamlined approach to data preprocessing, statistical analysis, machine learning, and visualization, all within an interactive Streamlit interface. It offers plug and play Streamlit UI, agents with data science speciality, complete automation, LLM agnostic operation, and is built using lightweight frameworks.

AiTreasureBox
AiTreasureBox is a versatile AI tool that provides a collection of pre-trained models and algorithms for various machine learning tasks. It simplifies the process of implementing AI solutions by offering ready-to-use components that can be easily integrated into projects. With AiTreasureBox, users can quickly prototype and deploy AI applications without the need for extensive knowledge in machine learning or deep learning. The tool covers a wide range of tasks such as image classification, text generation, sentiment analysis, object detection, and more. It is designed to be user-friendly and accessible to both beginners and experienced developers, making AI development more efficient and accessible to a wider audience.
awesome-LLM-resourses
A comprehensive repository of resources for Chinese large language models (LLMs), including data processing tools, fine-tuning frameworks, inference libraries, evaluation platforms, RAG engines, agent frameworks, books, courses, tutorials, and tips. The repository covers a wide range of tools and resources for working with LLMs, from data labeling and processing to model fine-tuning, inference, evaluation, and application development. It also includes resources for learning about LLMs through books, courses, and tutorials, as well as insights and strategies from building with LLMs.
AITreasureBox
AITreasureBox is a comprehensive collection of AI tools and resources designed to simplify and accelerate the development of AI projects. It provides a wide range of pre-trained models, datasets, and utilities that can be easily integrated into various AI applications. With AITreasureBox, developers can quickly prototype, test, and deploy AI solutions without having to build everything from scratch. Whether you are working on computer vision, natural language processing, or reinforcement learning projects, AITreasureBox has something to offer for everyone. The repository is regularly updated with new tools and resources to keep up with the latest advancements in the field of artificial intelligence.
awesome-mlops
Awesome MLOps is a curated list of tools related to Machine Learning Operations, covering areas such as AutoML, CI/CD for Machine Learning, Data Cataloging, Data Enrichment, Data Exploration, Data Management, Data Processing, Data Validation, Data Visualization, Drift Detection, Feature Engineering, Feature Store, Hyperparameter Tuning, Knowledge Sharing, Machine Learning Platforms, Model Fairness and Privacy, Model Interpretability, Model Lifecycle, Model Serving, Model Testing & Validation, Optimization Tools, Simplification Tools, Visual Analysis and Debugging, and Workflow Tools. The repository provides a comprehensive collection of tools and resources for individuals and teams working in the field of MLOps.
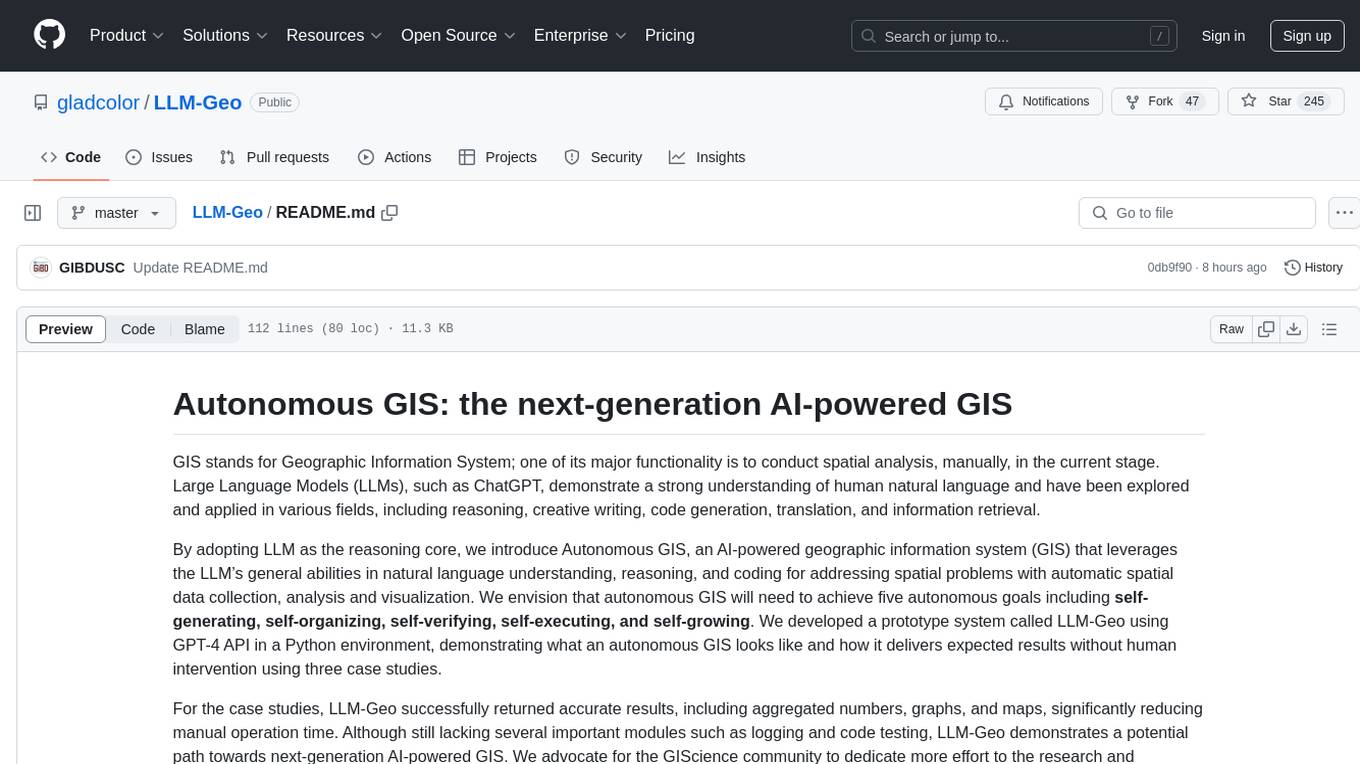
LLM-Geo
LLM-Geo is an AI-powered geographic information system (GIS) that leverages Large Language Models (LLMs) for automatic spatial data collection, analysis, and visualization. By adopting LLM as the reasoning core, it addresses spatial problems with self-generating, self-organizing, self-verifying, self-executing, and self-growing capabilities. The tool aims to make spatial analysis easier, faster, and more accessible by reducing manual operation time and delivering accurate results through case studies. It uses GPT-4 API in a Python environment and advocates for further research and development in autonomous GIS.
awesome-LLM-resources
This repository is a curated list of resources for learning and working with Large Language Models (LLMs). It includes a collection of articles, tutorials, tools, datasets, and research papers related to LLMs such as GPT-3, BERT, and Transformer models. Whether you are a researcher, developer, or enthusiast interested in natural language processing and artificial intelligence, this repository provides valuable resources to help you understand, implement, and experiment with LLMs.
better-chatbot
Better Chatbot is an open-source AI chatbot designed for individuals and teams, inspired by various AI models. It integrates major LLMs, offers powerful tools like MCP protocol and data visualization, supports automation with custom agents and visual workflows, enables collaboration by sharing configurations, provides a voice assistant feature, and ensures an intuitive user experience. The platform is built with Vercel AI SDK and Next.js, combining leading AI services into one platform for enhanced chatbot capabilities.
AGiXT
AGiXT is a dynamic Artificial Intelligence Automation Platform engineered to orchestrate efficient AI instruction management and task execution across a multitude of providers. Our solution infuses adaptive memory handling with a broad spectrum of commands to enhance AI's understanding and responsiveness, leading to improved task completion. The platform's smart features, like Smart Instruct and Smart Chat, seamlessly integrate web search, planning strategies, and conversation continuity, transforming the interaction between users and AI. By leveraging a powerful plugin system that includes web browsing and command execution, AGiXT stands as a versatile bridge between AI models and users. With an expanding roster of AI providers, code evaluation capabilities, comprehensive chain management, and platform interoperability, AGiXT is consistently evolving to drive a multitude of applications, affirming its place at the forefront of AI technology.
agents-starter
A starter template for building AI-powered chat agents using Cloudflare's Agent platform, powered by agents-sdk. It provides a foundation for creating interactive chat experiences with AI, complete with a modern UI and tool integration capabilities. Features include interactive chat interface with AI, built-in tool system with human-in-the-loop confirmation, advanced task scheduling, dark/light theme support, real-time streaming responses, state management, and chat history. Prerequisites include a Cloudflare account and OpenAI API key. The project structure includes components for chat UI implementation, chat agent logic, tool definitions, and helper functions. Customization guide covers adding new tools, modifying the UI, and example use cases for customer support, development assistant, data analysis assistant, personal productivity assistant, and scheduling assistant.
gonzo
Gonzo is a powerful, real-time log analysis terminal UI tool inspired by k9s. It allows users to analyze log streams with beautiful charts, AI-powered insights, and advanced filtering directly from the terminal. The tool provides features like live streaming log processing, OTLP support, interactive dashboard with real-time charts, advanced filtering options including regex support, and AI-powered insights such as pattern detection, anomaly analysis, and root cause suggestions. Users can also configure AI models from providers like OpenAI, LM Studio, and Ollama for intelligent log analysis. Gonzo is built with Bubble Tea, Lipgloss, Cobra, Viper, and OpenTelemetry, following a clean architecture with separate modules for TUI, log analysis, frequency tracking, OTLP handling, and AI integration.
Neosgenesis
Neogenesis System is an advanced AI decision-making framework that enables agents to 'think about how to think'. It implements a metacognitive approach with real-time learning, tool integration, and multi-LLM support, allowing AI to make expert-level decisions in complex environments. Key features include metacognitive intelligence, tool-enhanced decisions, real-time learning, aha-moment breakthroughs, experience accumulation, and multi-LLM support.
finite-monkey-engine
FiniteMonkey is an advanced vulnerability mining engine powered purely by GPT, requiring no prior knowledge base or fine-tuning. Its effectiveness significantly surpasses most current related research approaches. The tool is task-driven, prompt-driven, and focuses on prompt design, leveraging 'deception' and hallucination as key mechanics. It has helped identify vulnerabilities worth over $60,000 in bounties. The tool requires PostgreSQL database, OpenAI API access, and Python environment for setup. It supports various languages like Solidity, Rust, Python, Move, Cairo, Tact, Func, Java, and Fake Solidity for scanning. FiniteMonkey is best suited for logic vulnerability mining in real projects, not recommended for academic vulnerability testing. GPT-4-turbo is recommended for optimal results with an average scan time of 2-3 hours for medium projects. The tool provides detailed scanning results guide and implementation tips for users.
lyraios
LYRAIOS (LLM-based Your Reliable AI Operating System) is an advanced AI assistant platform built with FastAPI and Streamlit, designed to serve as an operating system for AI applications. It offers core features such as AI process management, memory system, and I/O system. The platform includes built-in tools like Calculator, Web Search, Financial Analysis, File Management, and Research Tools. It also provides specialized assistant teams for Python and research tasks. LYRAIOS is built on a technical architecture comprising FastAPI backend, Streamlit frontend, Vector Database, PostgreSQL storage, and Docker support. It offers features like knowledge management, process control, and security & access control. The roadmap includes enhancements in core platform, AI process management, memory system, tools & integrations, security & access control, open protocol architecture, multi-agent collaboration, and cross-platform support.
LLM-PowerHouse-A-Curated-Guide-for-Large-Language-Models-with-Custom-Training-and-Inferencing
LLM-PowerHouse is a comprehensive and curated guide designed to empower developers, researchers, and enthusiasts to harness the true capabilities of Large Language Models (LLMs) and build intelligent applications that push the boundaries of natural language understanding. This GitHub repository provides in-depth articles, codebase mastery, LLM PlayLab, and resources for cost analysis and network visualization. It covers various aspects of LLMs, including NLP, models, training, evaluation metrics, open LLMs, and more. The repository also includes a collection of code examples and tutorials to help users build and deploy LLM-based applications.