Best AI tools for< Visualize Data With Charts >
20 - AI tool Sites
ChatCSV
ChatCSV is a personal data analyst tool that allows users to upload CSV files and ask questions in a conversational manner. It generates common questions about the data, visualizes answers with charts, and keeps a chat history for reference. The tool is useful for industries like retail, finance, banking, marketing, and advertising to understand trends, customer behavior, and more.
Chat2CSV
The website offers an AI-powered tool for easy data visualization through natural language commands. Users can transform CSV data into various charts without the need for complex coding. The platform provides a wide range of chart types, smart AI support, and prioritizes data security and privacy. It simplifies data visualization tasks, making it intuitive and versatile for users to create visual insights effortlessly.
Tablepad
Tablepad is an AI-powered data analytics tool that allows users to upload, view, and query data effortlessly. With Tablepad, users can generate insights and create charts without the need for coding skills. The tool supports various file formats and offers automated visual insights by generating graphs and charts based on plain English questions. Tablepad simplifies data exploration and visualization, making it easy for users to uncover valuable insights from their data.
ChartPixel
ChartPixel is an AI-assisted data analysis platform that empowers users to effortlessly generate charts, insights, and actionable statistics in just 30 seconds. The platform is designed to demystify data and analysis, making it accessible to users of all skill levels. ChartPixel combines the power of AI with domain expertise to provide secure and reliable output, ensuring trustworthy results without compromising data privacy. With user-friendly features and educational tools, ChartPixel helps users clean, wrangle, visualize, and present data with ease, catering to both beginners and professionals.
Kanaries
Kanaries is an augmented analytics platform that uses AI to automate the process of data exploration and visualization. It offers a variety of features to help users quickly and easily find insights in their data, including: * **RATH:** An AI-powered engine that can automatically generate insights and recommendations based on your data. * **Graphic Walker:** A visual analytics tool that allows you to explore your data in a variety of ways, including charts, graphs, and maps. * **Data Painter:** A data cleaning and transformation tool that makes it easy to prepare your data for analysis. * **Causal Analysis:** A tool that helps you identify and understand the causal relationships between variables in your data. Kanaries is designed to be easy to use, even for users with no prior experience with data analysis. It is also highly scalable, so it can be used to analyze large datasets. Kanaries is a valuable tool for anyone who wants to quickly and easily find insights in their data. It can be used by businesses of all sizes, and it is particularly well-suited for organizations that are looking to improve their data-driven decision-making.
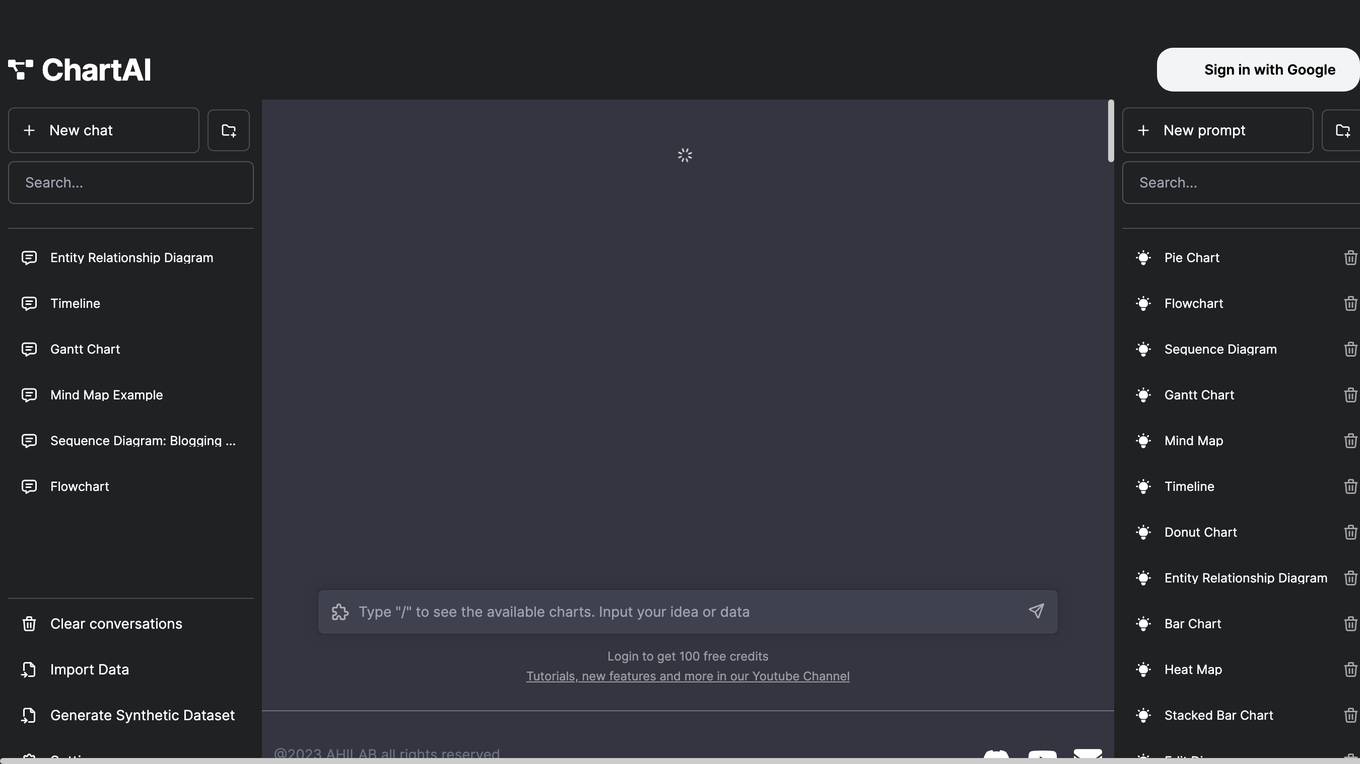
ChartAI
ChartAI is an AI-powered tool that helps you create beautiful charts and graphs from your data in seconds. With ChartAI, you can easily create bar charts, line charts, pie charts, and more. You can also customize your charts with different colors, fonts, and styles. ChartAI is the perfect tool for anyone who wants to create professional-looking charts and graphs quickly and easily.
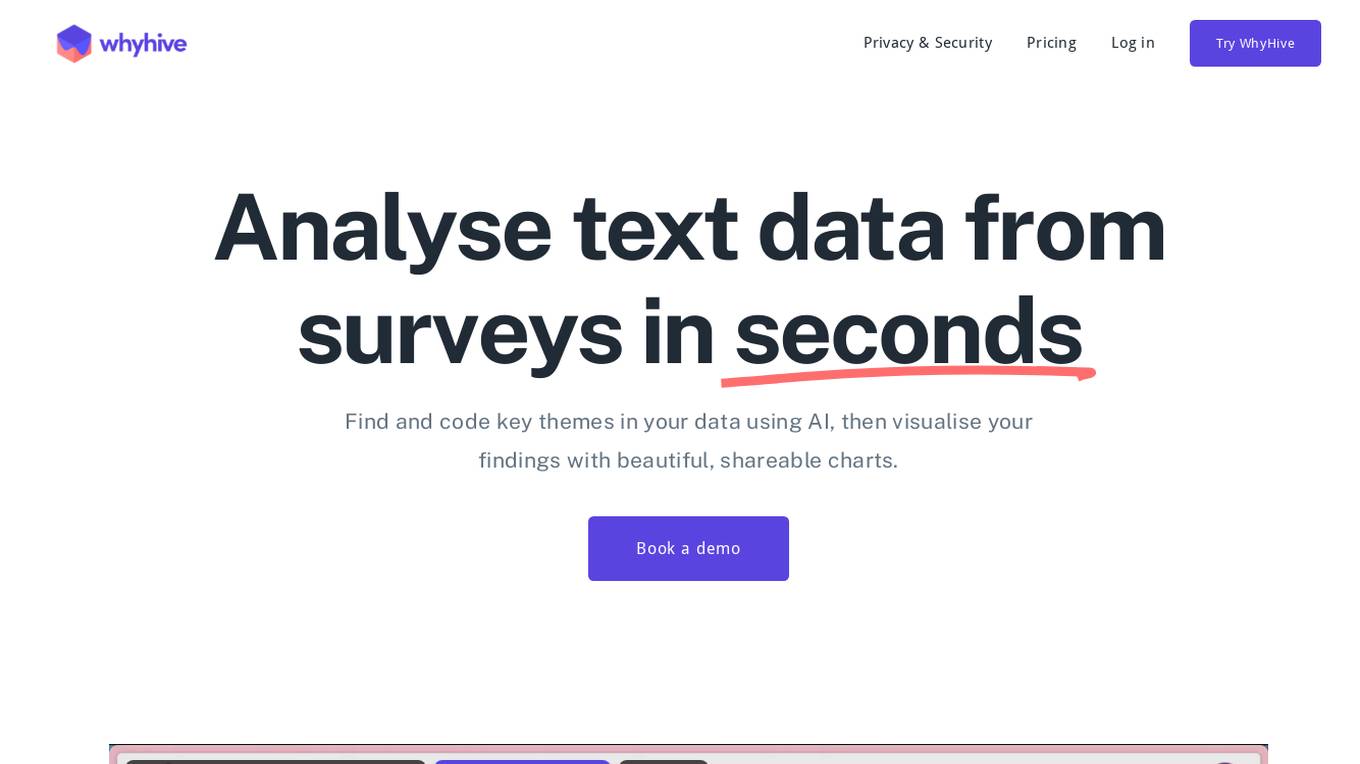
WhyHive
WhyHive is an AI-powered data analysis tool that helps users find and code key themes in their data, then visualize their findings with beautiful, shareable charts. It is designed to be easy to use, even for those with no prior experience with data analysis. WhyHive can analyze thousands of rows of data in minutes, saving users hours of manual coding time. It can also be used to analyze both quantitative and qualitative data, making it a versatile tool for a variety of research projects.
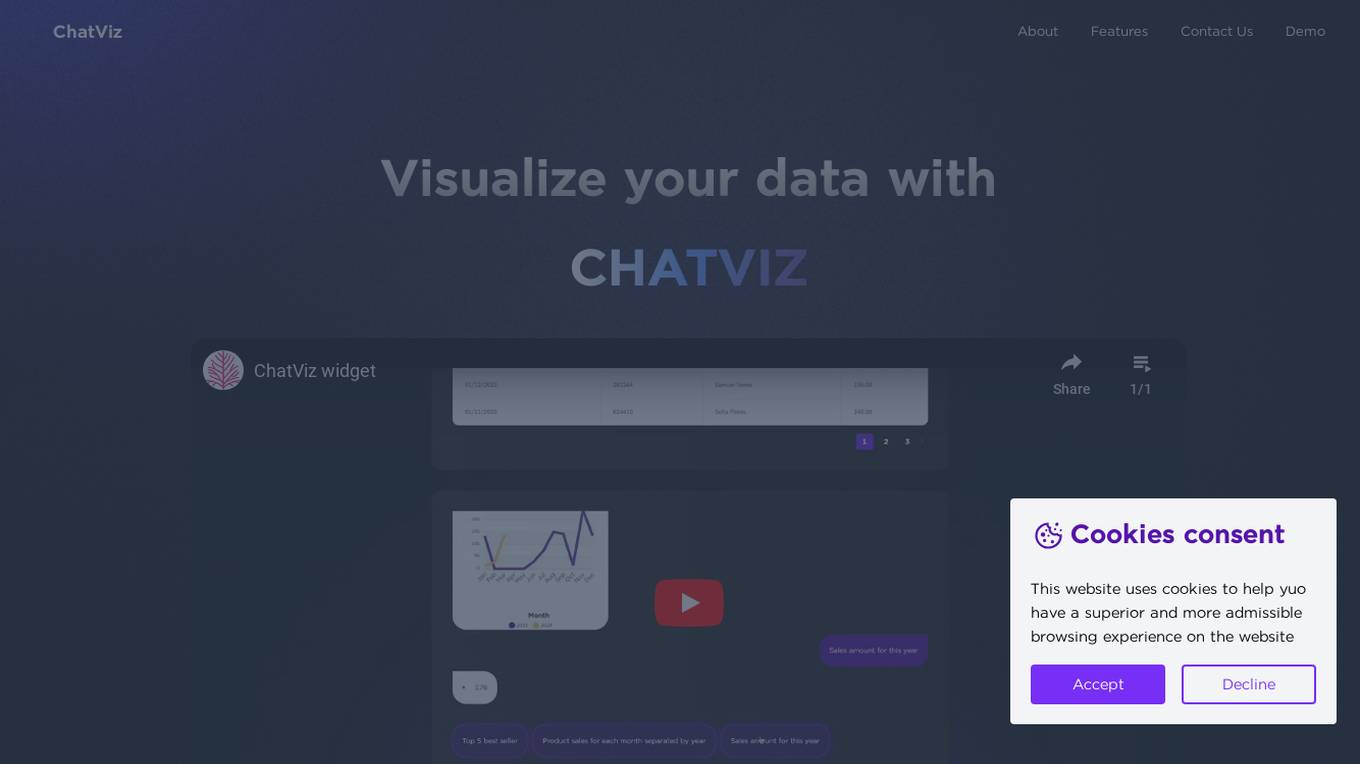
ChatViz
ChatViz is an AI-powered data visualization tool that leverages ChatGPT to enhance data visualization capabilities. It offers features such as SQL translator and chart suggestion to streamline the visualization process. By utilizing ChatViz, users can optimize development time, simplify data visualization, and say goodbye to dashboard complexity. The tool provides a new way to visualize data, reducing development time and improving user experience.
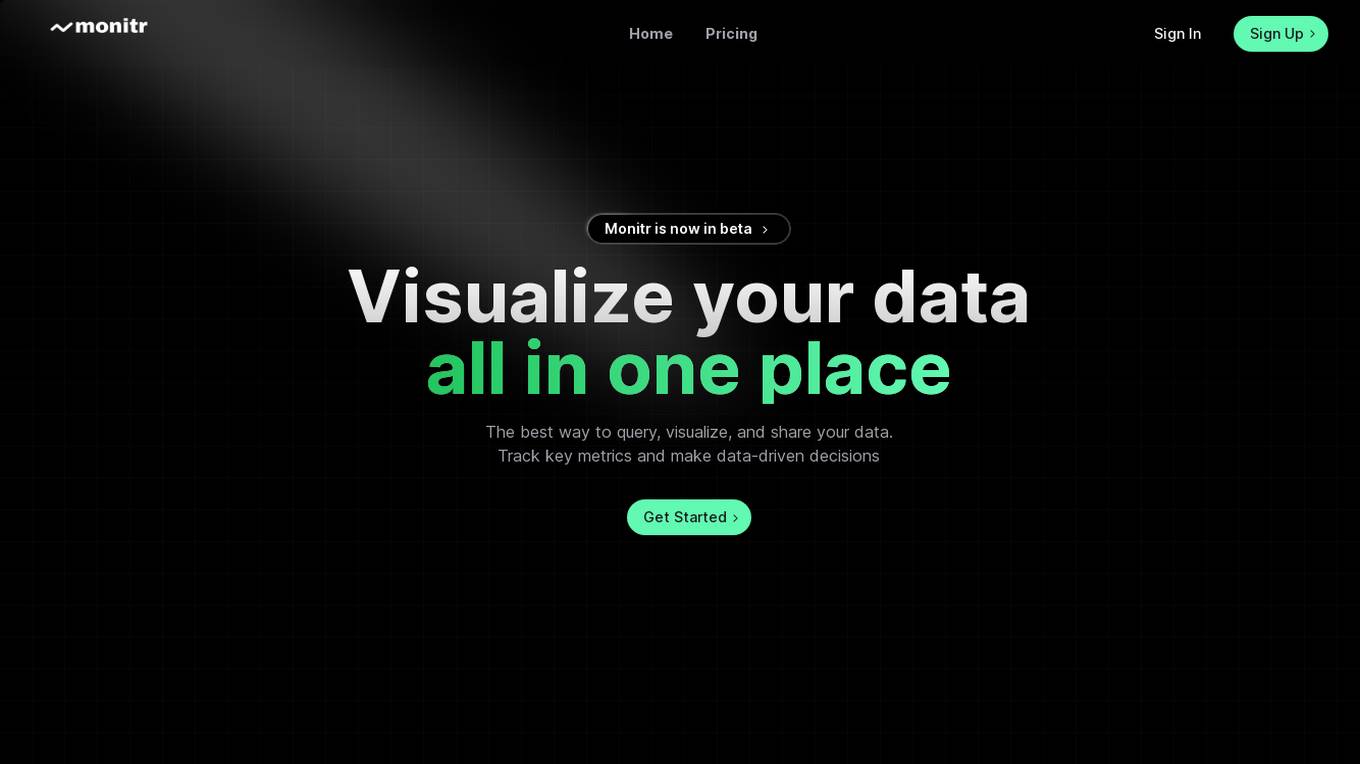
Monitr
Monitr is a data visualization and analytics platform that allows users to query, visualize, and share data in one place. It helps in tracking key metrics, making data-driven decisions, and breaking down data silos to provide a unified view of data from various sources. Users can create charts and dashboards, connect to different data sources like Postgresql and MySQL, and collaborate with teammates on SQL queries. Monitr's AI features are powered by Meta AI's Llama 3 LLM, enabling the development of powerful and flexible analytics tools for maximizing data utilization.
Diagramming AI
Diagramming AI is an innovative tool that allows users to instantly design and edit UML structures, workflow designs, and various other diagrams with the power of AI. It offers features such as AI-powered automated diagram creation, AI chat for discussions and suggestions, quick edit functionality, project-based diagram code storage, flexible export options, customizable color themes, URL to diagram conversion, image to diagram generation, a library of diagram templates, and more. The tool caters to professionals like software developers, project managers, data analysts, educators, technical writers, business analysts, product managers, researchers, students, and marketing professionals, enhancing their visual representation capabilities across various domains.
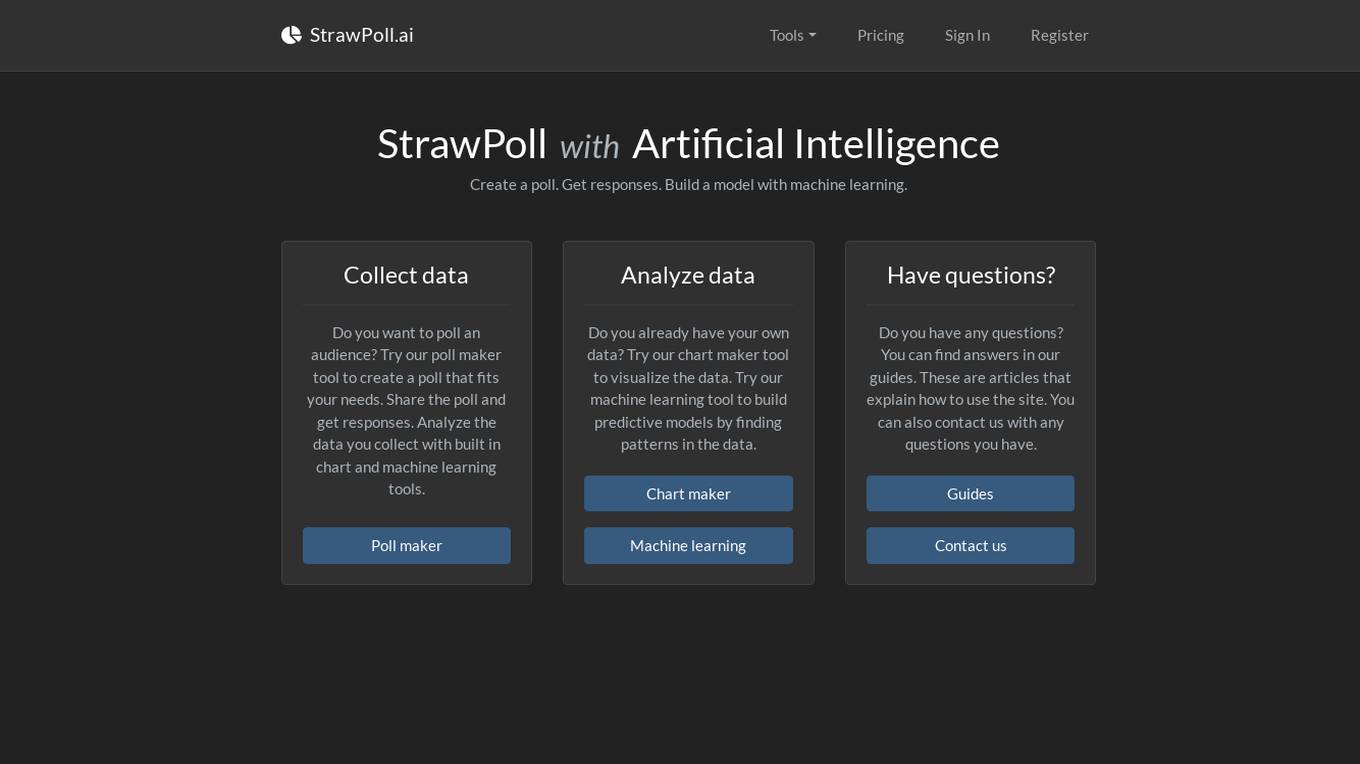
StrawPoll.ai
StrawPoll.ai is an AI-powered platform that offers tools for creating polls, generating charts, and utilizing machine learning to analyze data. Users can easily create polls tailored to their needs, share them to collect responses, and analyze the data using built-in chart and machine learning tools. The platform also provides a chart maker tool for visualizing existing data and a machine learning tool for building predictive models by identifying patterns in the data. Additionally, users can access guides for assistance and contact support for any queries.
MacroMicro
MacroMicro is an AI analytics platform that combines technology and research expertise to empower users with valuable insights into global market trends. With over 0k registered users and 0M+ monthly website traffic, MacroMicro offers real-time charts, cycle analysis, and data-driven insights to optimize investment strategies. The platform compiles the MM Global Recession Probability, utilizes OpenAI's Embedding technology, and provides exclusive reports and analysis on key market events. Users can access dynamic and automatically-updated charts, a powerful toolbox for analysis, and engage with a vibrant community of macroeconomic professionals.
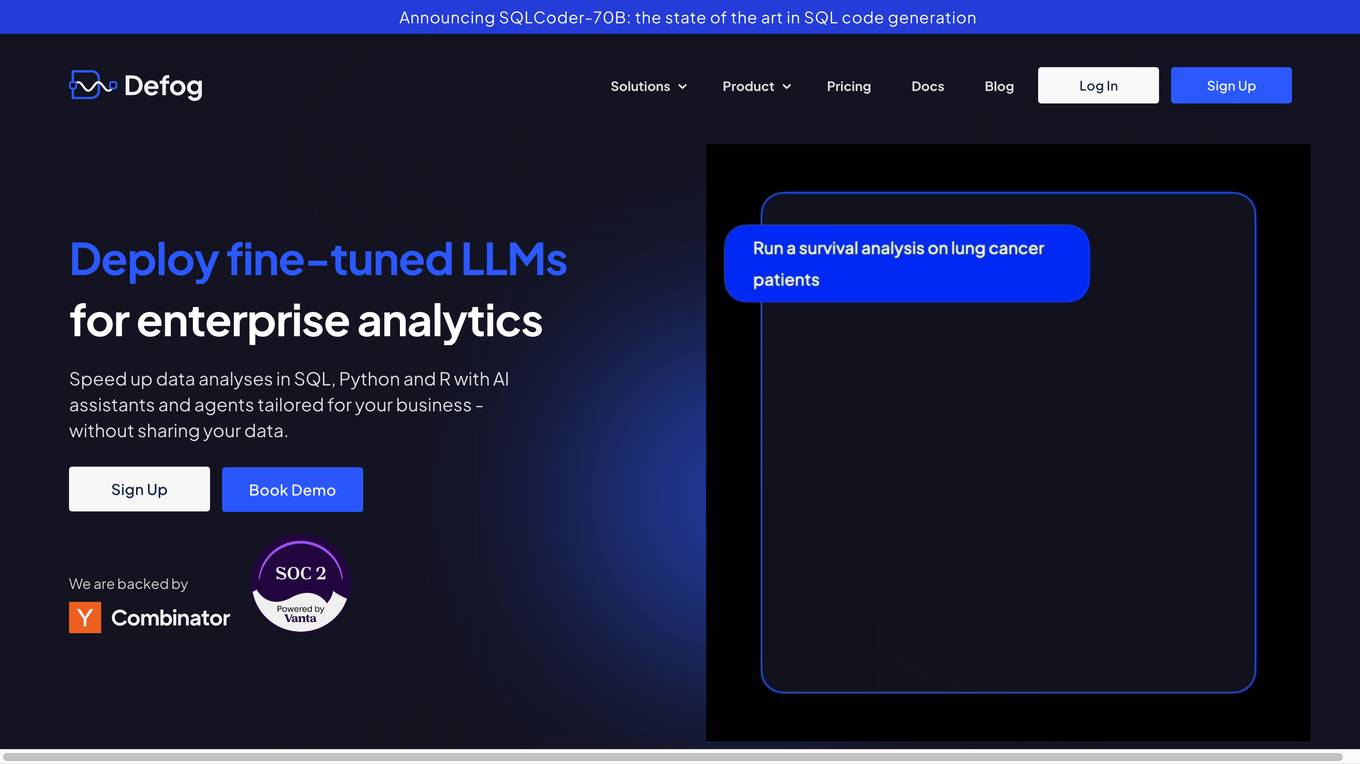
Defog.ai
Defog.ai provides fine-tuned AI models for enterprise SQL. It helps businesses speed up data analyses in SQL, Python, and R with AI assistants and agents tailored for their business - without sharing their data. Defog.ai's key features include the ability to ask questions of data in natural language, get results when needed, integrate with any SQL database or data warehouse, automatically visualize data as tables and charts, and fine-tune on your metadata to give results you can trust.
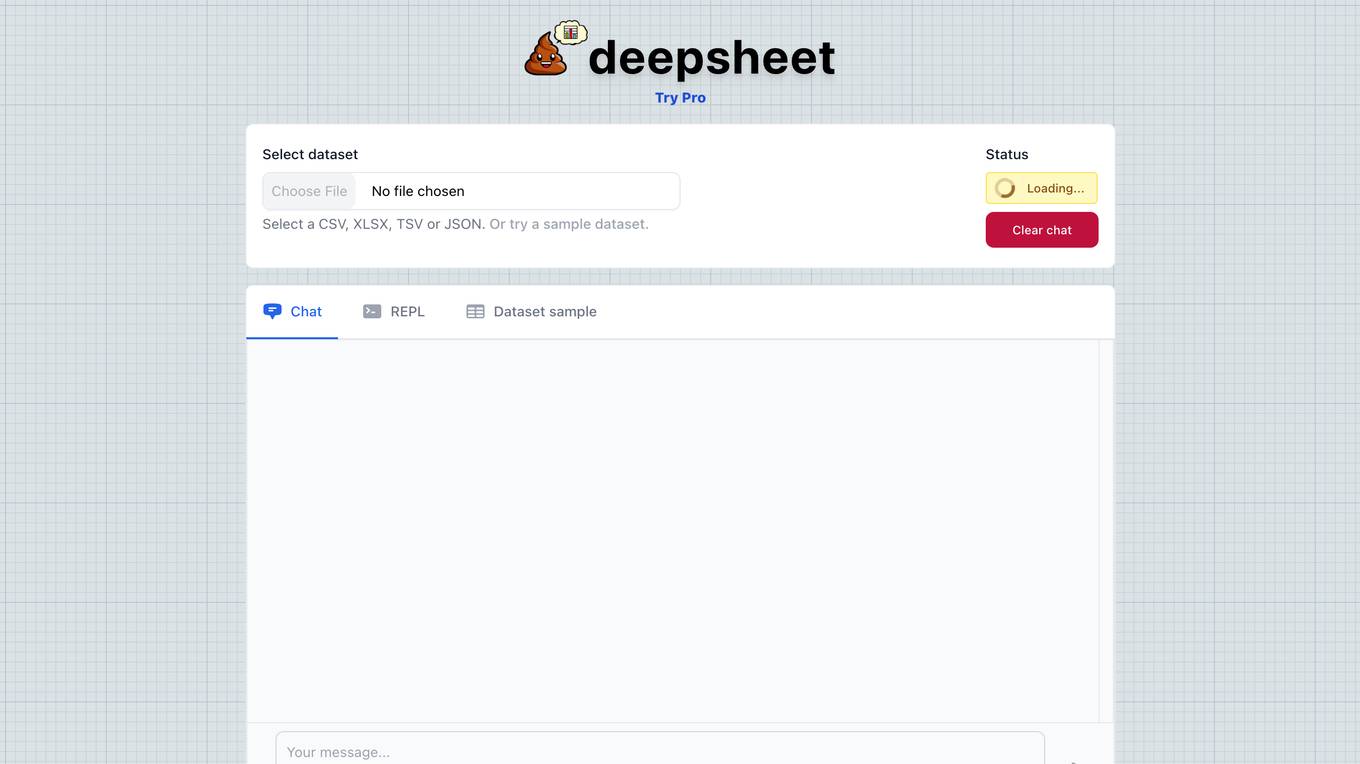
Deepsheet
Deepsheet is a cloud-based spreadsheet application that uses artificial intelligence to help users analyze and visualize data. It offers a variety of features, including the ability to import data from a variety of sources, create charts and graphs, and perform data analysis. Deepsheet is designed to be easy to use, even for users with no prior experience with spreadsheets.
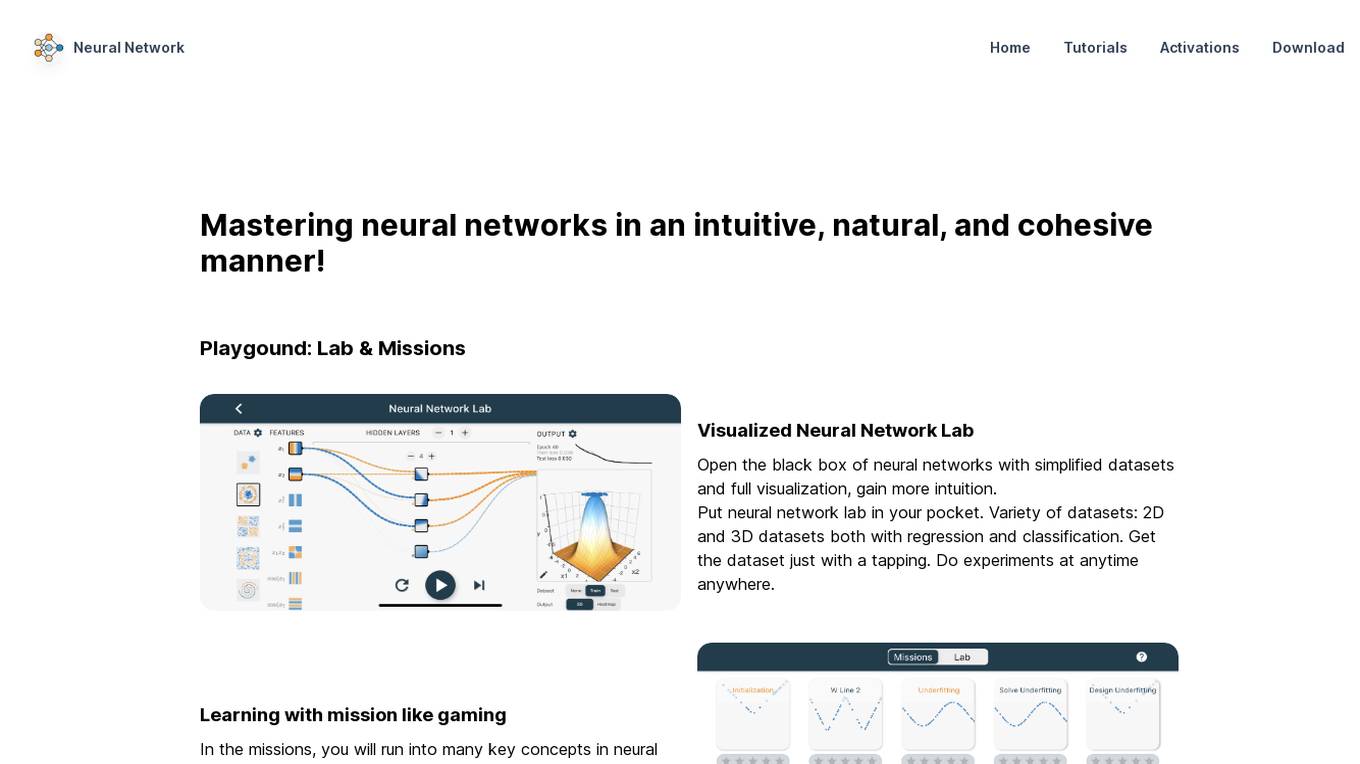
Neural Network Playground
The website offers interactive tutorials on neural networks and deep learning, providing a comprehensive platform for mastering neural networks in an intuitive, natural, and cohesive manner. Users can access a visualized neural network lab with simplified datasets, a variety of 2D and 3D datasets for regression and classification, and interactive missions to deepen understanding. The platform also features intuitive tutorials, well-visualized neural network knowledge with charts and animations, and a visual deep learning model editor for efficient model building. Overall, it aims to enhance learning and understanding of neural networks through interactive and visual tools.
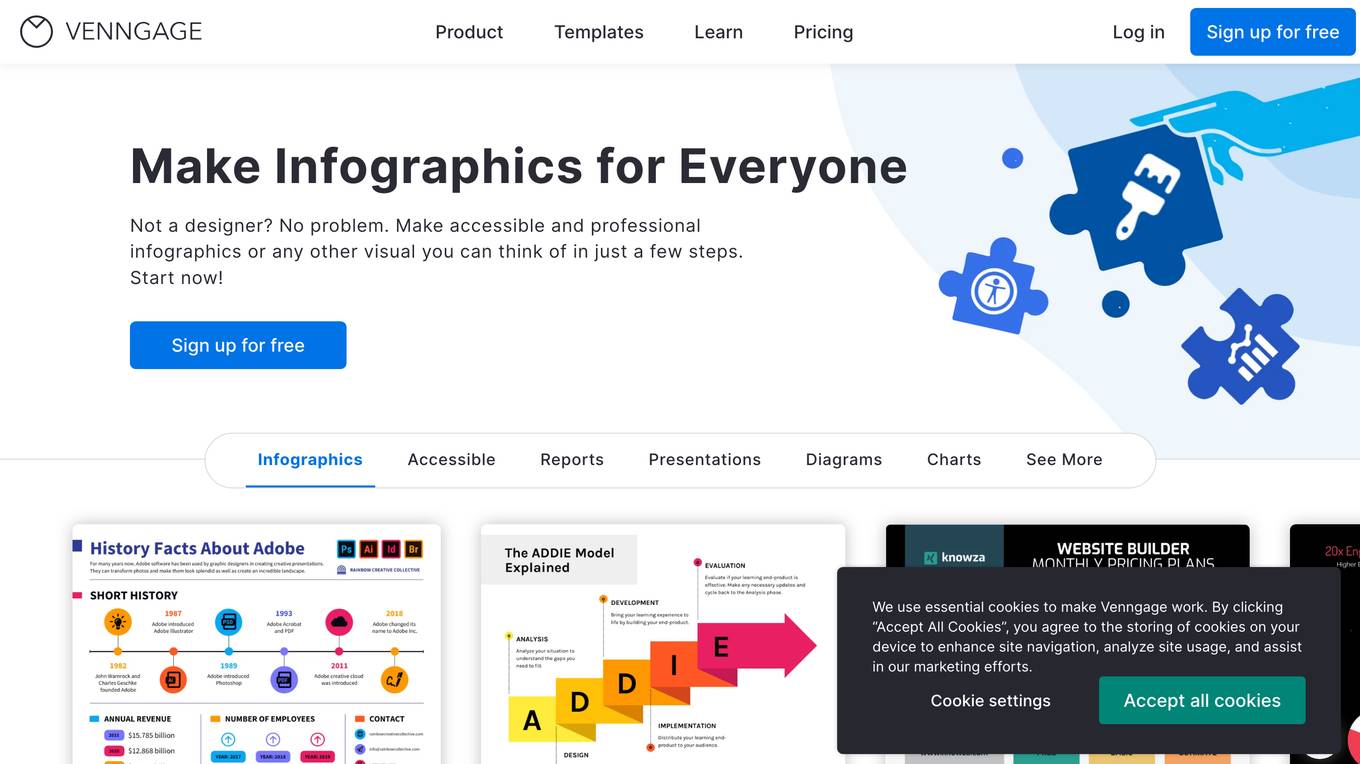
Venngage
Venngage is a professional infographic software that offers over 10,000 templates for creating visually appealing and accessible designs. The platform provides a range of features such as AI-powered design tools, accessible editor and templates, branding and collaboration options, smart diagram features, diverse icons, and free stock photos. Users can easily create infographics, reports, presentations, diagrams, charts, and more with Venngage's user-friendly interface and AI-driven features.
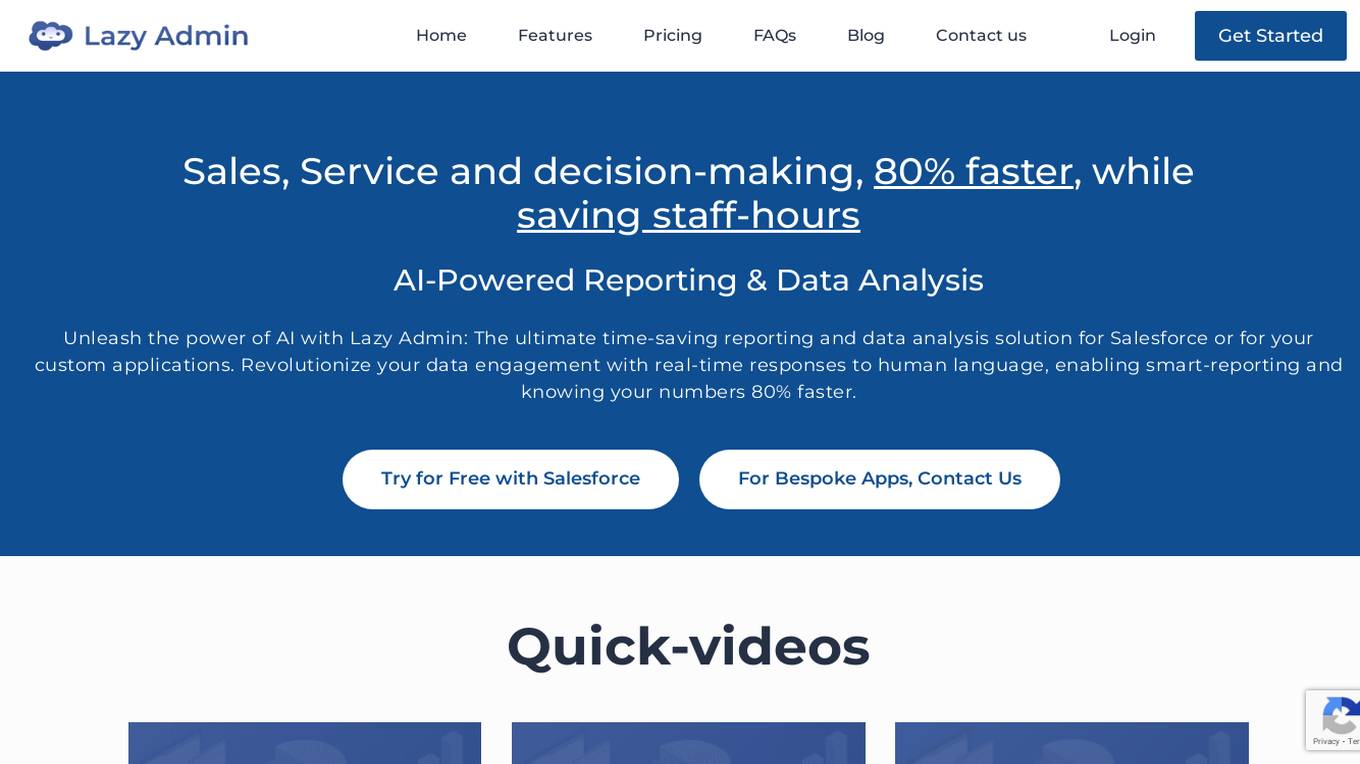
Lazy Admin
Lazy Admin is an AI-powered quick reporting and data analysis tool designed to revolutionize data engagement by providing real-time responses to human language queries. It enables smart reporting and faster decision-making by leveraging the power of AI. With features like data protection, AI-powered data analysis, export and share capabilities, and customizable options, Lazy Admin aims to streamline productivity and enhance data insights for businesses. The tool ensures data privacy and security while offering efficient search management and visualization of data through charts. Lazy Admin is suitable for Salesforce users and custom applications, offering a range of pricing plans to cater to different business needs.
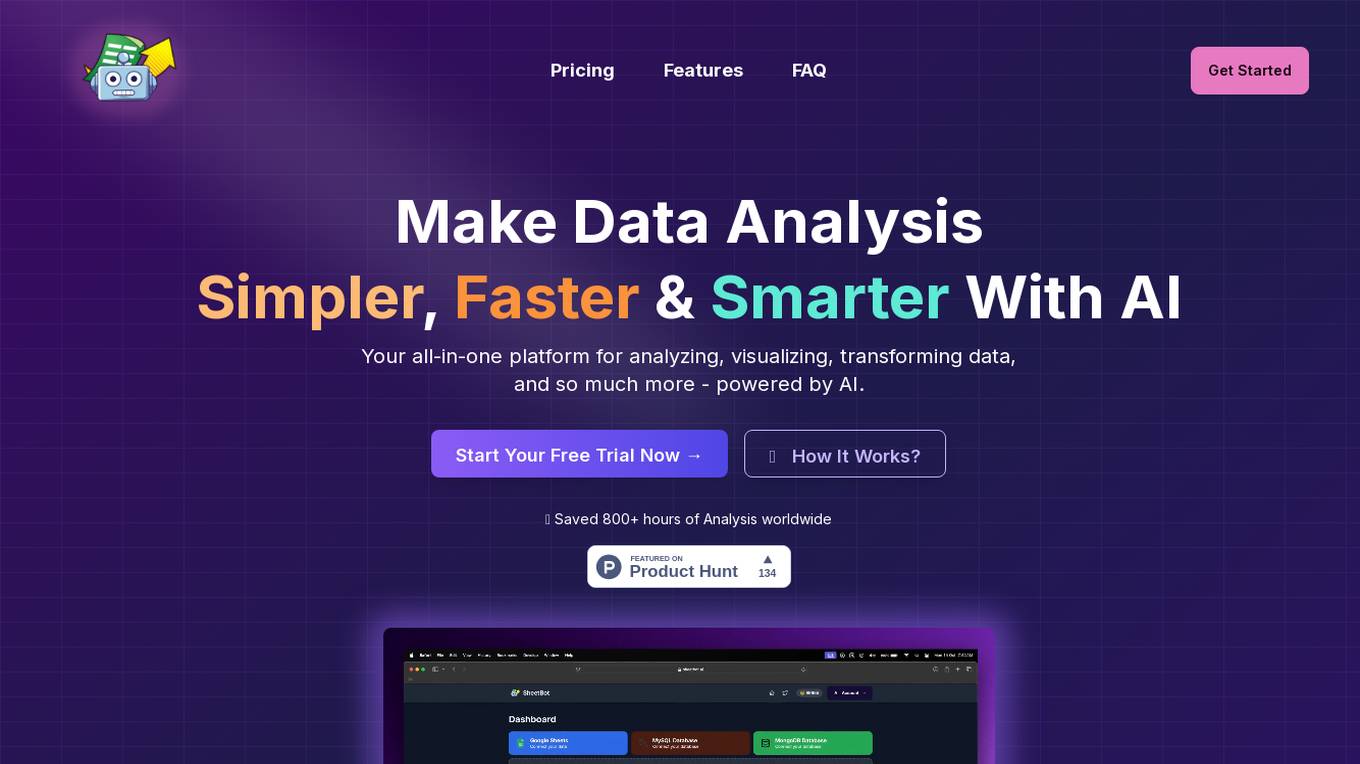
SheetBot AI
SheetBot AI is an AI data analyst tool that enables users to analyze data quickly without the need for coding. It automates repetitive and time-consuming data tasks, making data visualization and analysis more efficient. With SheetBot AI, users can generate accurate and visually appealing graphs in seconds, streamlining the data analysis process.
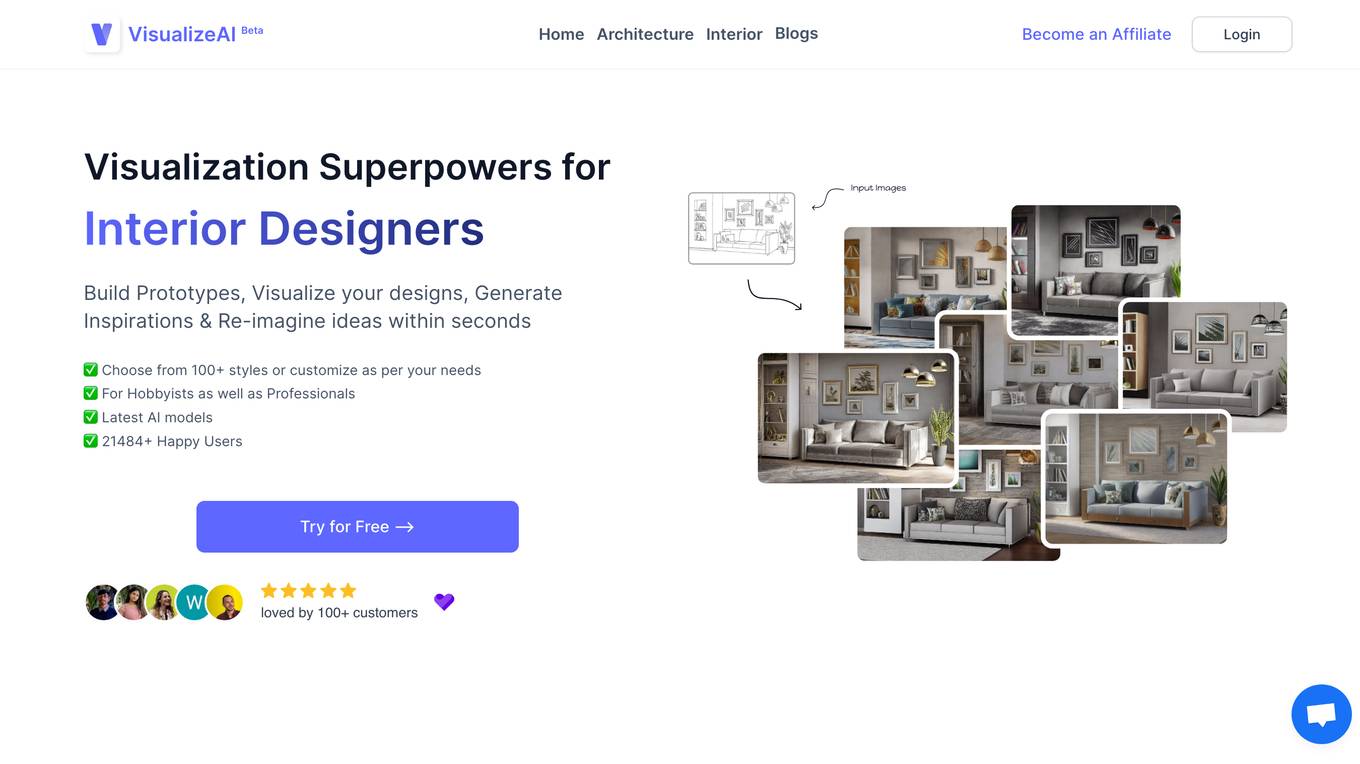
VisualizeAI
VisualizeAI is a powerful AI-powered platform that helps businesses visualize and analyze their data. With VisualizeAI, you can easily create stunning data visualizations, dashboards, and reports that will help you make better decisions. VisualizeAI is perfect for businesses of all sizes, from startups to large enterprises. It is easy to use and affordable, and it can help you save time and money while improving your decision-making.
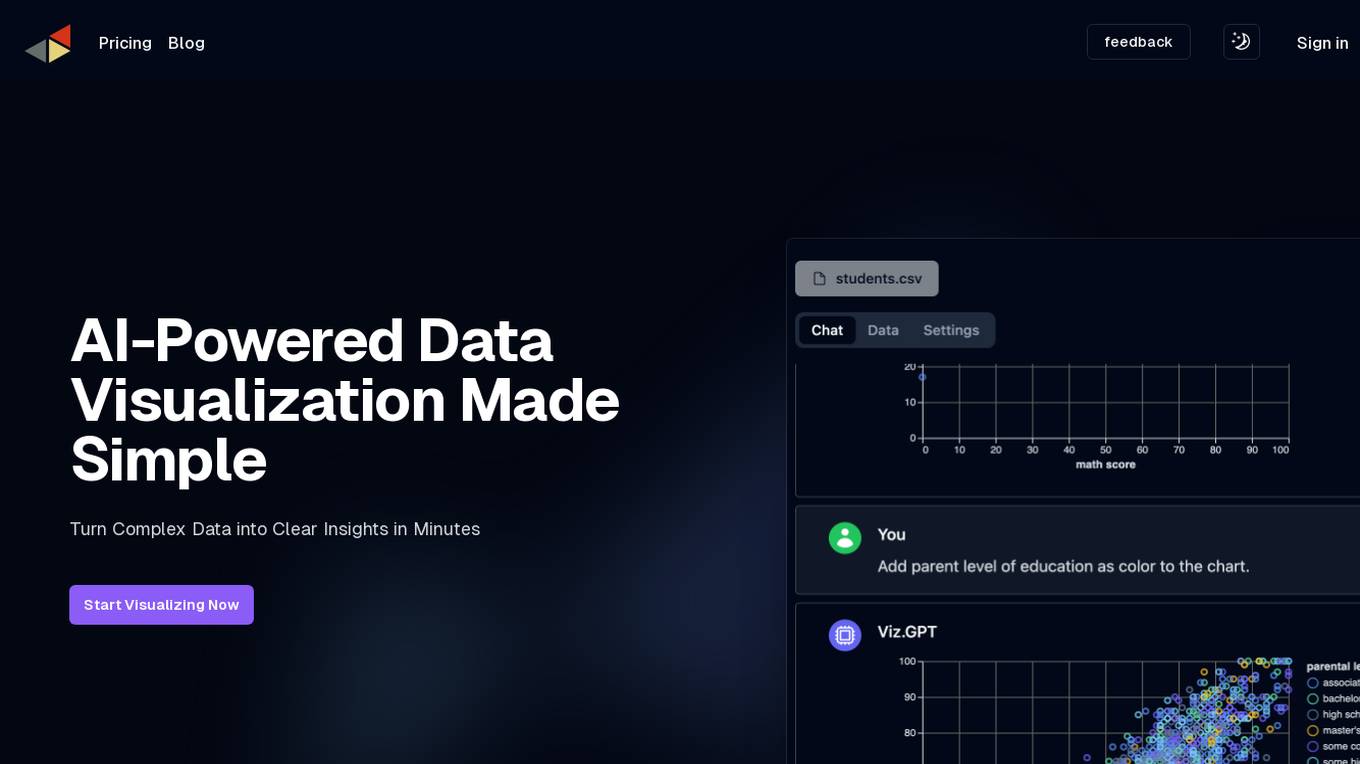
vizGPT
vizGPT is an AI-powered data visualization tool that simplifies the process of turning complex data into clear insights. The software offers contextual understanding, intelligent conversation, and natural language processing capabilities to help users quickly generate and understand complex visualizations. With real-time responses and contextual memory features, vizGPT provides a seamless data storytelling experience. Users can create visualizations using a no-code GUI with drag-and-drop functionality and leverage powerful data transformation and profiling tools. vizGPT aims to revolutionize data visualization by offering an intuitive and efficient solution for data analysis.
20 - Open Source AI Tools
Auto-Analyst
Auto-Analyst is an AI-driven data analytics agentic system designed to simplify and enhance the data science process. By integrating various specialized AI agents, this tool aims to make complex data analysis tasks more accessible and efficient for data analysts and scientists. Auto-Analyst provides a streamlined approach to data preprocessing, statistical analysis, machine learning, and visualization, all within an interactive Streamlit interface. It offers plug and play Streamlit UI, agents with data science speciality, complete automation, LLM agnostic operation, and is built using lightweight frameworks.
WrenAI
WrenAI is a data assistant tool that helps users get results and insights faster by asking questions in natural language, without writing SQL. It leverages Large Language Models (LLM) with Retrieval-Augmented Generation (RAG) technology to enhance comprehension of internal data. Key benefits include fast onboarding, secure design, and open-source availability. WrenAI consists of three core services: Wren UI (intuitive user interface), Wren AI Service (processes queries using a vector database), and Wren Engine (platform backbone). It is currently in alpha version, with new releases planned biweekly.
Slurm-web
Slurm-web is an open source web dashboard designed for Slurm based HPC clusters. It provides a graphical user interface to track jobs, insights, and visualizations for monitoring HPC supercomputers. The tool offers features like interactive charts, job filtering, live status updates, node visualization, RBAC permissions, LDAP authentication, and integration with Prometheus for metrics collection.
dataline
DataLine is an AI-driven data analysis and visualization tool designed for technical and non-technical users to explore data quickly. It offers privacy-focused data storage on the user's device, supports various data sources, generates charts, executes queries, and facilitates report building. The tool aims to speed up data analysis tasks for businesses and individuals by providing a user-friendly interface and natural language querying capabilities.

AiTreasureBox
AiTreasureBox is a versatile AI tool that provides a collection of pre-trained models and algorithms for various machine learning tasks. It simplifies the process of implementing AI solutions by offering ready-to-use components that can be easily integrated into projects. With AiTreasureBox, users can quickly prototype and deploy AI applications without the need for extensive knowledge in machine learning or deep learning. The tool covers a wide range of tasks such as image classification, text generation, sentiment analysis, object detection, and more. It is designed to be user-friendly and accessible to both beginners and experienced developers, making AI development more efficient and accessible to a wider audience.
AITreasureBox
AITreasureBox is a comprehensive collection of AI tools and resources designed to simplify and accelerate the development of AI projects. It provides a wide range of pre-trained models, datasets, and utilities that can be easily integrated into various AI applications. With AITreasureBox, developers can quickly prototype, test, and deploy AI solutions without having to build everything from scratch. Whether you are working on computer vision, natural language processing, or reinforcement learning projects, AITreasureBox has something to offer for everyone. The repository is regularly updated with new tools and resources to keep up with the latest advancements in the field of artificial intelligence.
awesome-ai-devtools
Awesome AI-Powered Developer Tools is a curated list of AI-powered developer tools that leverage AI to assist developers in tasks such as code completion, refactoring, debugging, documentation, and more. The repository includes a wide range of tools, from IDEs and Git clients to assistants, agents, app generators, UI generators, snippet generators, documentation tools, code generation tools, agent platforms, OpenAI plugins, search tools, and testing tools. These tools are designed to enhance developer productivity and streamline various development tasks by integrating AI capabilities.
pandas-ai
PandaAI is a Python platform that enables users to interact with their data in natural language, catering to both non-technical and technical users. It simplifies data querying and analysis, offering conversational data analytics capabilities with minimal code. Users can ask questions, visualize charts, and compare dataframes effortlessly. The tool aims to streamline data exploration and decision-making processes by providing a user-friendly interface for data manipulation and analysis.
supersonic
SuperSonic is a next-generation BI platform that integrates Chat BI (powered by LLM) and Headless BI (powered by semantic layer) paradigms. This integration ensures that Chat BI has access to the same curated and governed semantic data models as traditional BI. Furthermore, the implementation of both paradigms benefits from the integration: * Chat BI's Text2SQL gets augmented with context-retrieval from semantic models. * Headless BI's query interface gets extended with natural language API. SuperSonic provides a Chat BI interface that empowers users to query data using natural language and visualize the results with suitable charts. To enable such experience, the only thing necessary is to build logical semantic models (definition of metric/dimension/tag, along with their meaning and relationships) through a Headless BI interface. Meanwhile, SuperSonic is designed to be extensible and composable, allowing custom implementations to be added and configured with Java SPI. The integration of Chat BI and Headless BI has the potential to enhance the Text2SQL generation in two dimensions: 1. Incorporate data semantics (such as business terms, column values, etc.) into the prompt, enabling LLM to better understand the semantics and reduce hallucination. 2. Offload the generation of advanced SQL syntax (such as join, formula, etc.) from LLM to the semantic layer to reduce complexity. With these ideas in mind, we develop SuperSonic as a practical reference implementation and use it to power our real-world products. Additionally, to facilitate further development we decide to open source SuperSonic as an extensible framework.
data-juicer
Data-Juicer is a one-stop data processing system to make data higher-quality, juicier, and more digestible for LLMs. It is a systematic & reusable library of 80+ core OPs, 20+ reusable config recipes, and 20+ feature-rich dedicated toolkits, designed to function independently of specific LLM datasets and processing pipelines. Data-Juicer allows detailed data analyses with an automated report generation feature for a deeper understanding of your dataset. Coupled with multi-dimension automatic evaluation capabilities, it supports a timely feedback loop at multiple stages in the LLM development process. Data-Juicer offers tens of pre-built data processing recipes for pre-training, fine-tuning, en, zh, and more scenarios. It provides a speedy data processing pipeline requiring less memory and CPU usage, optimized for maximum productivity. Data-Juicer is flexible & extensible, accommodating most types of data formats and allowing flexible combinations of OPs. It is designed for simplicity, with comprehensive documentation, easy start guides and demo configs, and intuitive configuration with simple adding/removing OPs from existing configs.
pandas-ai
PandasAI is a Python library that makes it easy to ask questions to your data in natural language. It helps you to explore, clean, and analyze your data using generative AI.
swarms
Swarms provides simple, reliable, and agile tools to create your own Swarm tailored to your specific needs. Currently, Swarms is being used in production by RBC, John Deere, and many AI startups.
quadratic
Quadratic is a modern multiplayer spreadsheet application that integrates Python, AI, and SQL functionalities. It aims to streamline team collaboration and data analysis by enabling users to pull data from various sources and utilize popular data science tools. The application supports building dashboards, creating internal tools, mixing data from different sources, exploring data for insights, visualizing Python workflows, and facilitating collaboration between technical and non-technical team members. Quadratic is built with Rust + WASM + WebGL to ensure seamless performance in the browser, and it offers features like WebGL Grid, local file management, Python and Pandas support, Excel formula support, multiplayer capabilities, charts and graphs, and team support. The tool is currently in Beta with ongoing development for additional features like JS support, SQL database support, and AI auto-complete.
litlyx
Litlyx is a single-line code analytics solution that integrates with every JavaScript/TypeScript framework. It allows you to track 10+ KPIs and custom events for your website or web app. The tool comes with an AI Data Analyst Assistant that can analyze your data, compare data, query metadata, visualize charts, and more. Litlyx is open-source, allowing users to self-host it and create their own version of the dashboard. The tool is user-friendly and supports various JavaScript/TypeScript frameworks, making it versatile for different projects.
extension-gen-ai
The Looker GenAI Extension provides code examples and resources for building a Looker Extension that integrates with Vertex AI Large Language Models (LLMs). Users can leverage the power of LLMs to enhance data exploration and analysis within Looker. The extension offers generative explore functionality to ask natural language questions about data and generative insights on dashboards to analyze data by asking questions. It leverages components like BQML Remote Models, BQML Remote UDF with Vertex AI, and Custom Fine Tune Model for different integration options. Deployment involves setting up infrastructure with Terraform and deploying the Looker Extension by creating a Looker project, copying extension files, configuring BigQuery connection, connecting to Git, and testing the extension. Users can save example prompts and configure user settings for the extension. Development of the Looker Extension environment includes installing dependencies, starting the development server, and building for production.
holmesgpt
HolmesGPT is an open-source DevOps assistant powered by OpenAI or any tool-calling LLM of your choice. It helps in troubleshooting Kubernetes, incident response, ticket management, automated investigation, and runbook automation in plain English. The tool connects to existing observability data, is compliance-friendly, provides transparent results, supports extensible data sources, runbook automation, and integrates with existing workflows. Users can install HolmesGPT using Brew, prebuilt Docker container, Python Poetry, or Docker. The tool requires an API key for functioning and supports OpenAI, Azure AI, and self-hosted LLMs.

airflow
Apache Airflow (or simply Airflow) is a platform to programmatically author, schedule, and monitor workflows. When workflows are defined as code, they become more maintainable, versionable, testable, and collaborative. Use Airflow to author workflows as directed acyclic graphs (DAGs) of tasks. The Airflow scheduler executes your tasks on an array of workers while following the specified dependencies. Rich command line utilities make performing complex surgeries on DAGs a snap. The rich user interface makes it easy to visualize pipelines running in production, monitor progress, and troubleshoot issues when needed.
SuperKnowa
SuperKnowa is a fast framework to build Enterprise RAG (Retriever Augmented Generation) Pipelines at Scale, powered by watsonx. It accelerates Enterprise Generative AI applications to get prod-ready solutions quickly on private data. The framework provides pluggable components for tackling various Generative AI use cases using Large Language Models (LLMs), allowing users to assemble building blocks to address challenges in AI-driven text generation. SuperKnowa is battle-tested from 1M to 200M private knowledge base & scaled to billions of retriever tokens.
20 - OpenAI Gpts
Plotter
Provide a hand-drawing or screenshot of your desired plot along with the data and I'll make the plot.
Sheets Expert
Master the art of Google Sheets with an assistant who can do everything from answer questions about basic features, explain functions in an eloquent and succinct manner, simplify the most complex formulas into easy steps, and help you identify techniques to effectively visualize your data.

Sommelier de dados
Opa! Cole o texto da sua reportagem ou trecho para que eu possa analisá-la com base em manuais de uso de dados em textos jornalísticos.
Data Analysis Report Creator
Creates full DOCX data analysis reports with integrated visualizations
Ticket Sales AI_MensBasketball
Data Analyst for USC Athletics Dept, specializes in SQL and ticket sales insights.
D.A.A. | Data Action Assistant
Advanced assistant for data publication and subscription guidance, with enhanced contextual understanding and technical integration.
Eurostat Explorer
Explore & interpret the Eurostat database. Type in requests for statistics, also ask to visualize it. Works best wish specific datasets. It's meant for professionals familiar with the Eurostat database looking for a faster way to explore it.

PowerBI GPT
A PowerBI Expert assisting with debugging, dashboard ideas, and PowerBI service guidance.

Qlik Sense Inphinity Forms Writeback Extension
Get help with Qlik Sense Inphinity Forms Writeback Extension.
SEARCHLIGHT
Script Examples and Resource Center for Helping with LAMMPS Input Generation and High-quality Tutorials (SERCHLIGHT)
ReDev You v00400
Specialist in belief transformation using advanced NLP and visualization, now more powerful with a two-component structure.
Illuminous - The Data Exploration AI
Expert in data analysis, visualizations, and predictions.