Best AI tools for< Create Charts >
17 - AI tool Sites
Baseboard
Baseboard is an AI tool designed to help users generate insights from their data quickly and efficiently. With Baseboard, users can create visually appealing charts and visualizations for their websites or publications with the assistance of an AI-powered designer. The tool aims to streamline the data visualization process and provide users with valuable insights to make informed decisions.
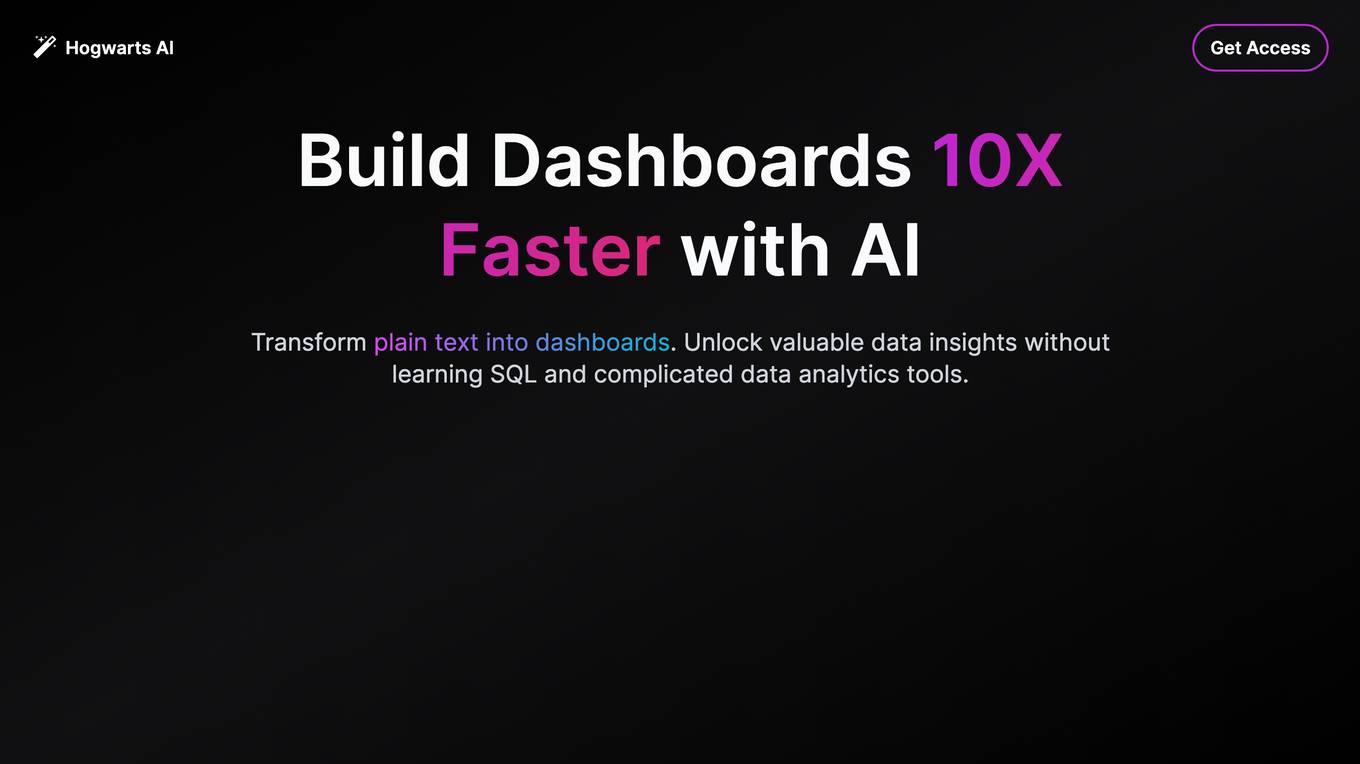
Hogwarts AI
Hogwarts AI empowers users to effortlessly build dashboards and unlock valuable data insights without the need for SQL or complex data analytics tools. Trained on a vast repository of queries and patterns, Hogwarts AI seamlessly transforms product data into intuitive charts and summaries. Its diverse data integration capabilities allow for effortless connection to various sources, including Postgres, Snowflake, Salesforce, Stripe, and even Excel tables. The AI Copilot feature enables users to create visually compelling charts with text in minutes, eliminating the need for SQL and DAX queries. Hogwarts AI also provides intelligent chart recommendations to facilitate deeper insights and enables the generation of shareable charts for product documentation and executive reviews.
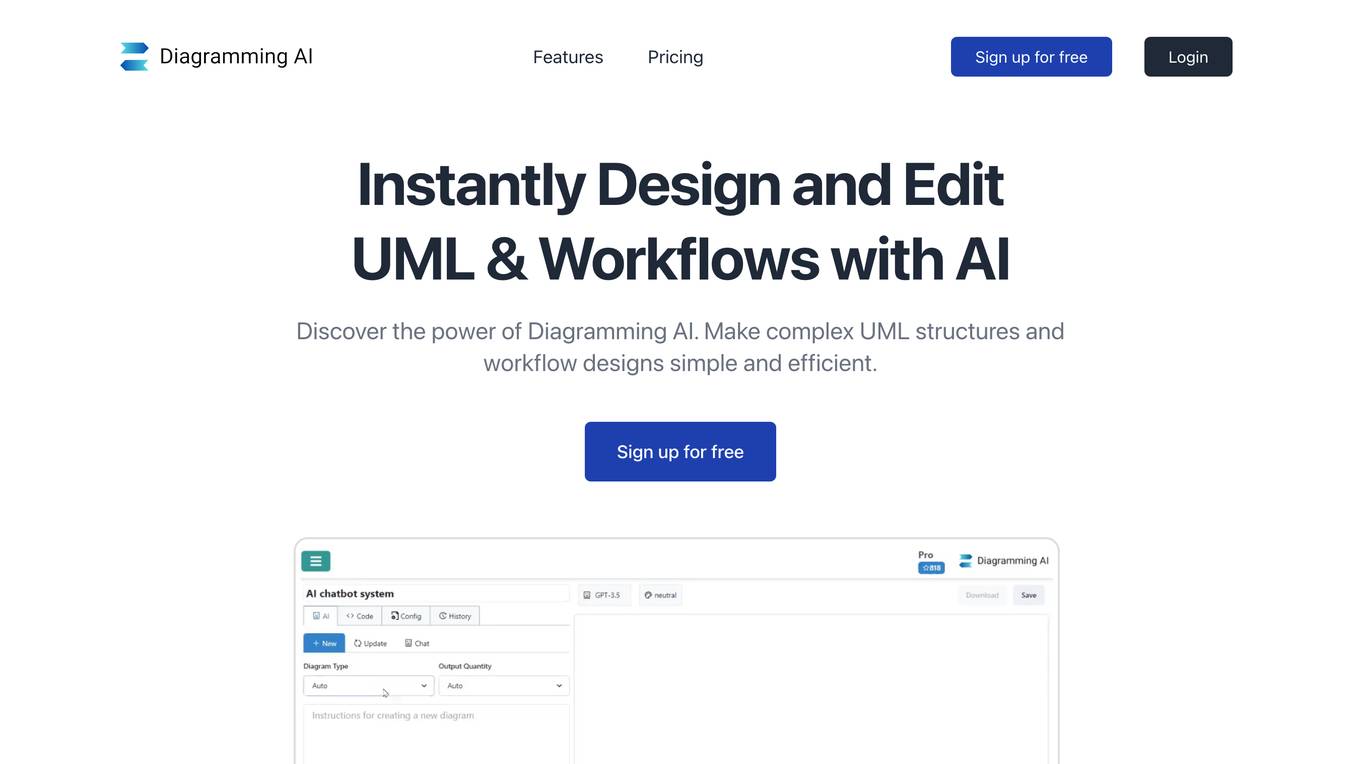
Diagramming AI
Diagramming AI is an innovative tool that allows users to instantly design and edit UML structures, workflow designs, and various other diagrams with the power of AI. It offers features such as AI-powered automated diagram creation, AI chat for discussions and suggestions, quick edit functionality, project-based diagram code storage, flexible export options, customizable color themes, URL to diagram conversion, image to diagram generation, a library of diagram templates, and more. The tool caters to professionals like software developers, project managers, data analysts, educators, technical writers, business analysts, product managers, researchers, students, and marketing professionals, enhancing their visual representation capabilities across various domains.
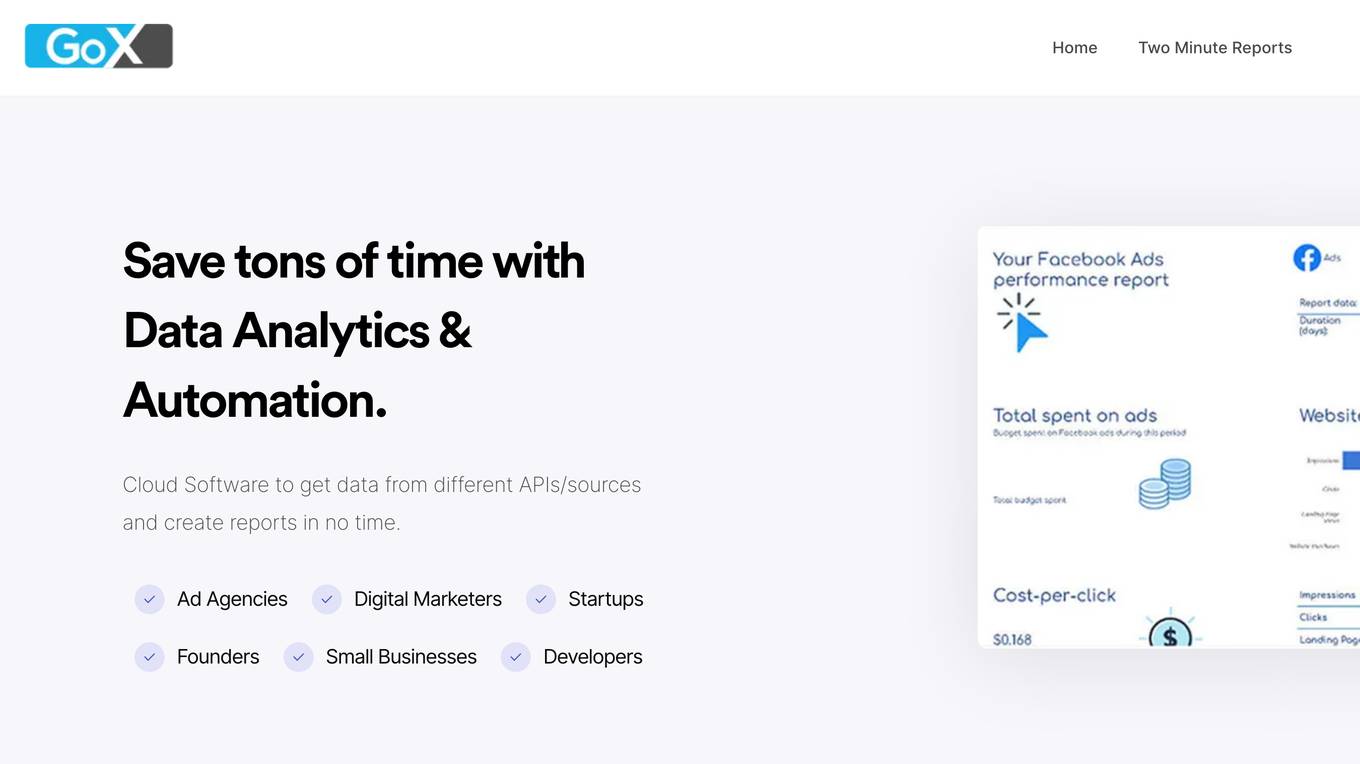
GoX Data Automation Software
GoX Data Automation Software is a cloud-based tool designed to save time with data analytics and automation. It allows users to connect to different APIs/sources, create reports with beautiful charts and graphs, automate report generation, and consolidate data from various sources into reports or dashboards. The software, known as Two Minute Reports (TMR), works seamlessly with Google Sheets and Looker Studio to help users efficiently manage their reporting tasks.
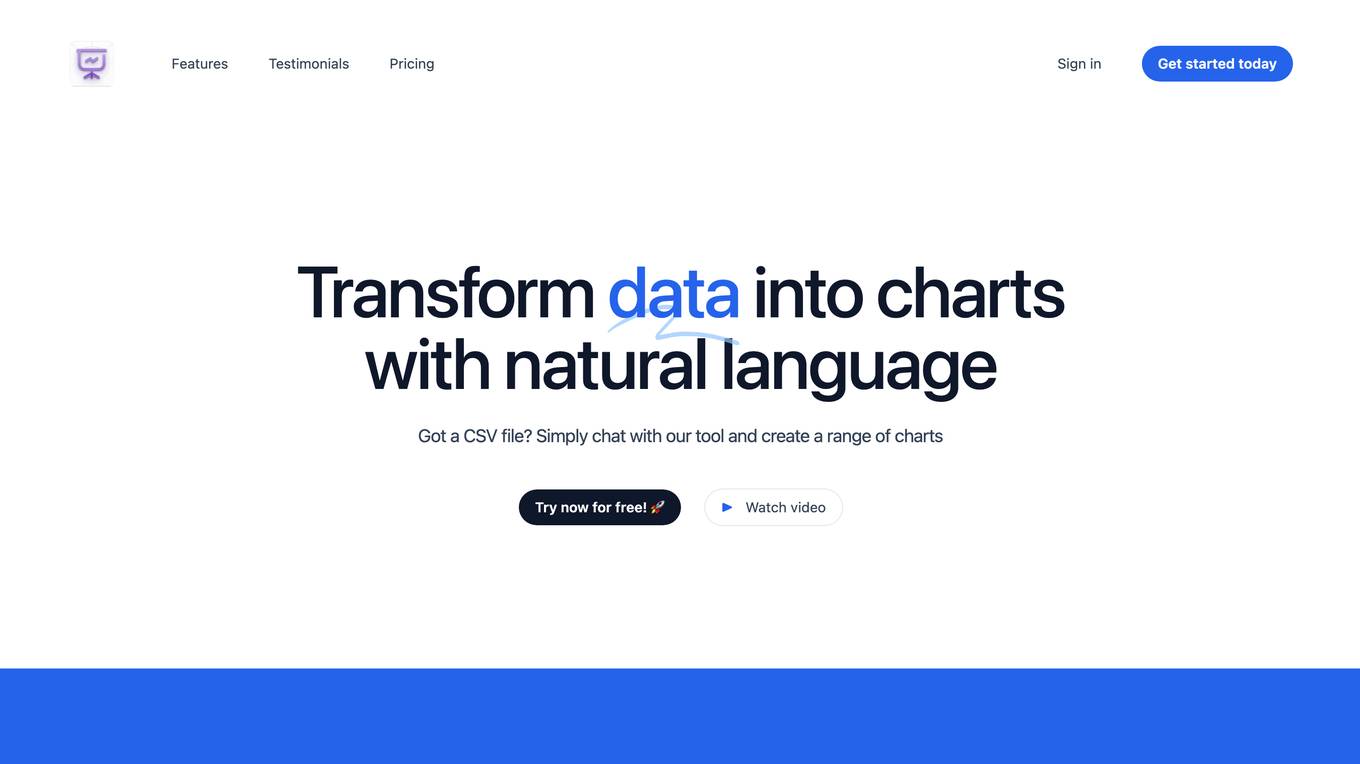
Chat2CSV
The website offers an AI-powered tool for easy data visualization through natural language commands. Users can transform CSV data into various charts without the need for complex coding. The platform provides a wide range of chart types, smart AI support, and prioritizes data security and privacy. It simplifies data visualization tasks, making it intuitive and versatile for users to create visual insights effortlessly.
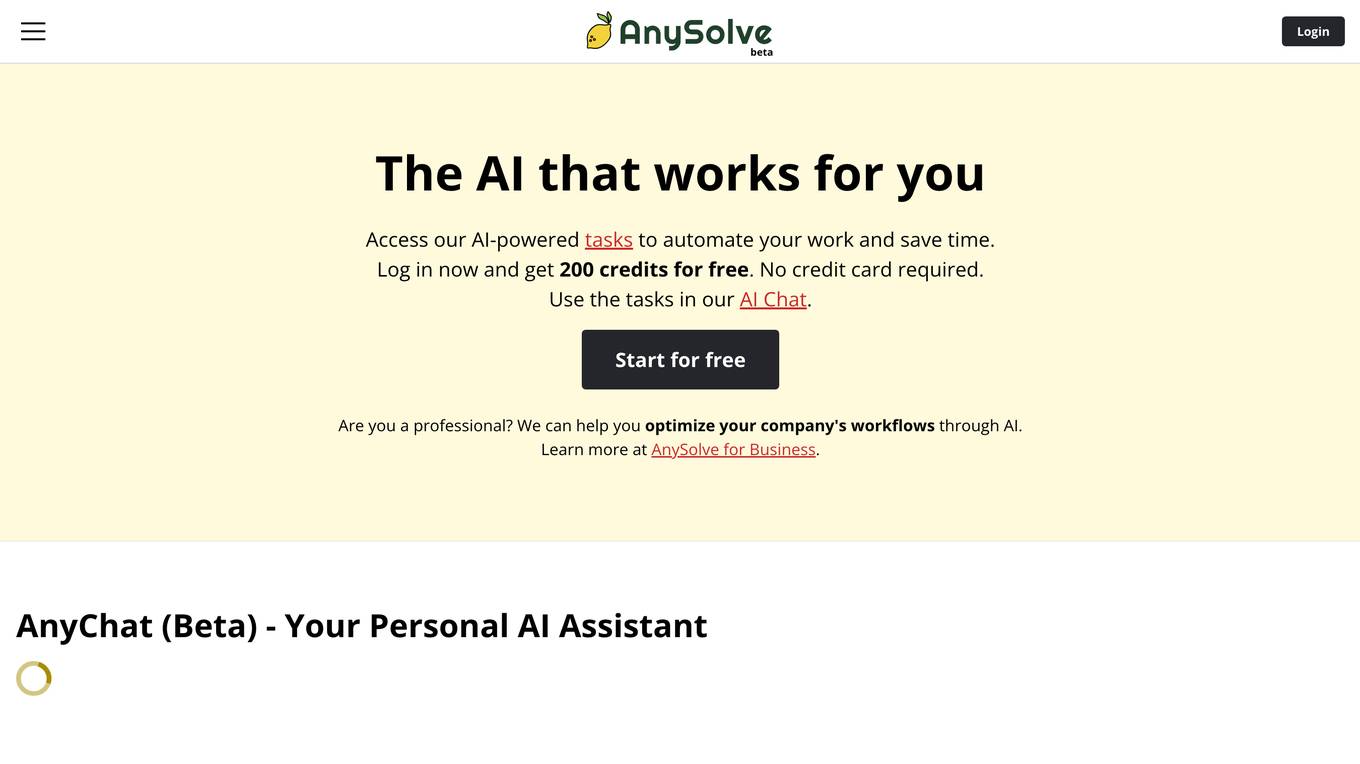
AnySolve
AnySolve is an AI-powered platform that offers a wide range of tools to automate tasks and save time. Users can access tools like AI Chat, Write Like Anyone, Wikipedia Article Creation, Create Credit Contract, Answer Exam Question, and more. AnySolve allows users to create and share their own AI tools, discover existing tools, and integrate various AI capabilities into their workflows. The platform provides a user-friendly interface and supports multiple output formats, making it a versatile solution for professionals across different industries.
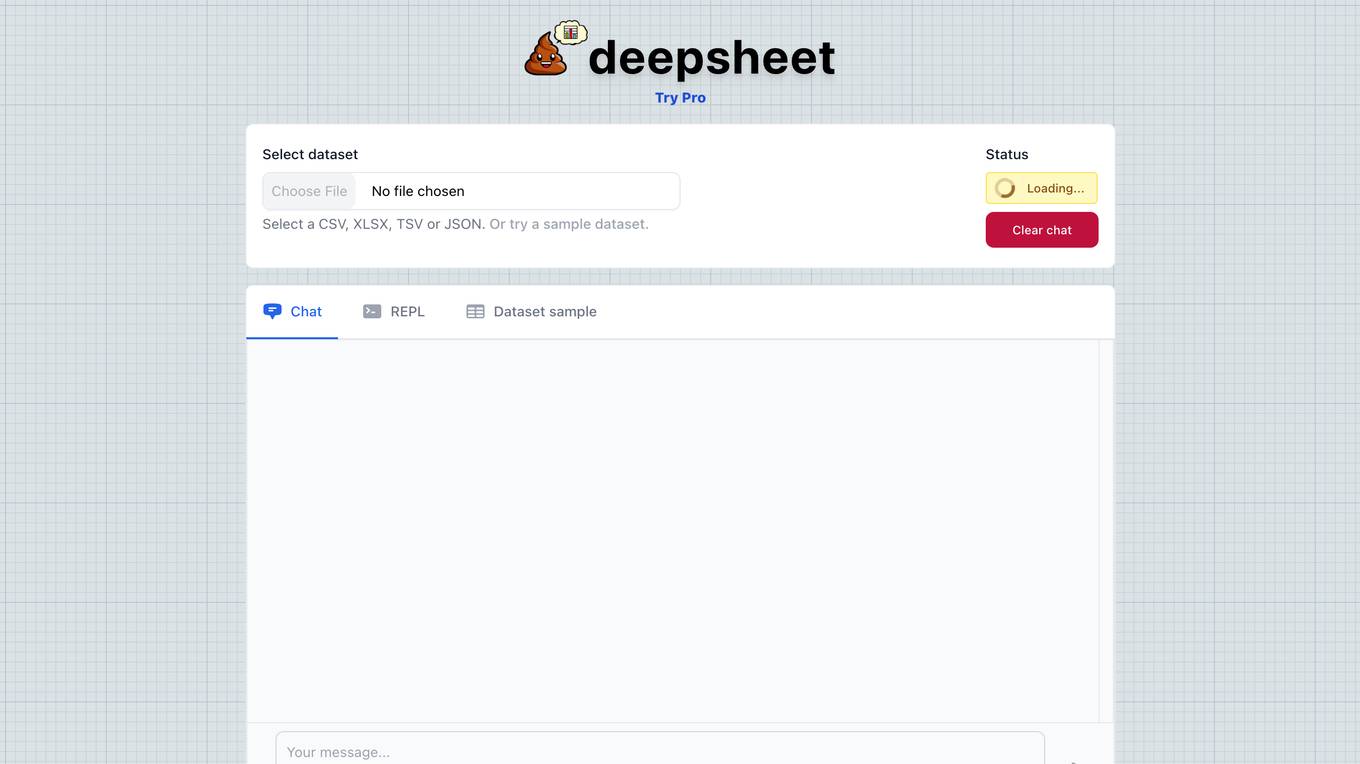
Deepsheet
Deepsheet is a cloud-based spreadsheet application that uses artificial intelligence to help users analyze and visualize data. It offers a variety of features, including the ability to import data from a variety of sources, create charts and graphs, and perform data analysis. Deepsheet is designed to be easy to use, even for users with no prior experience with spreadsheets.

Sheet Copilot
Sheet Copilot is a Google Sheets add-on that uses AI to automate tasks and improve productivity. With Sheet Copilot, you can quickly and easily complete tasks such as data entry, formatting, and analysis. Sheet Copilot is free to use in beta.
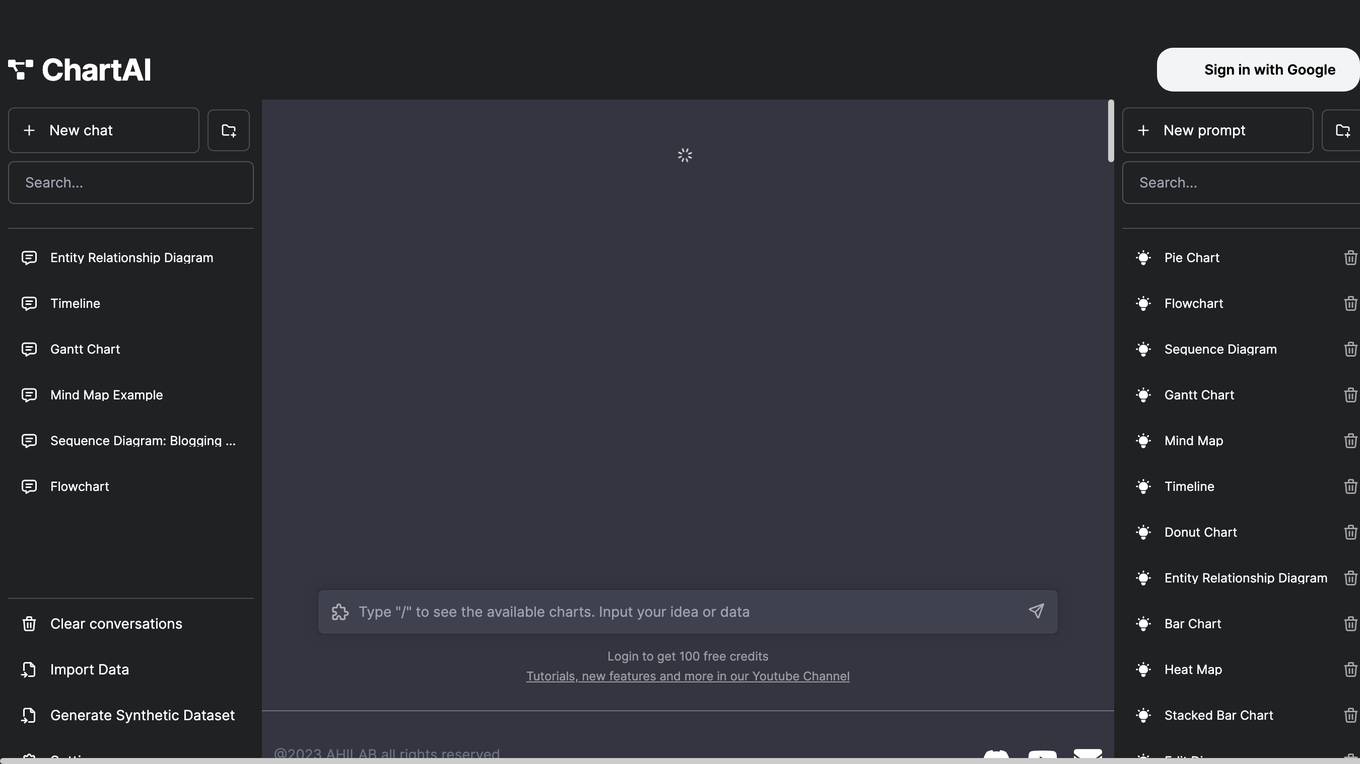
ChartAI
ChartAI is an AI-powered tool that helps you create beautiful charts and graphs from your data in seconds. With ChartAI, you can easily create bar charts, line charts, pie charts, and more. You can also customize your charts with different colors, fonts, and styles. ChartAI is the perfect tool for anyone who wants to create professional-looking charts and graphs quickly and easily.
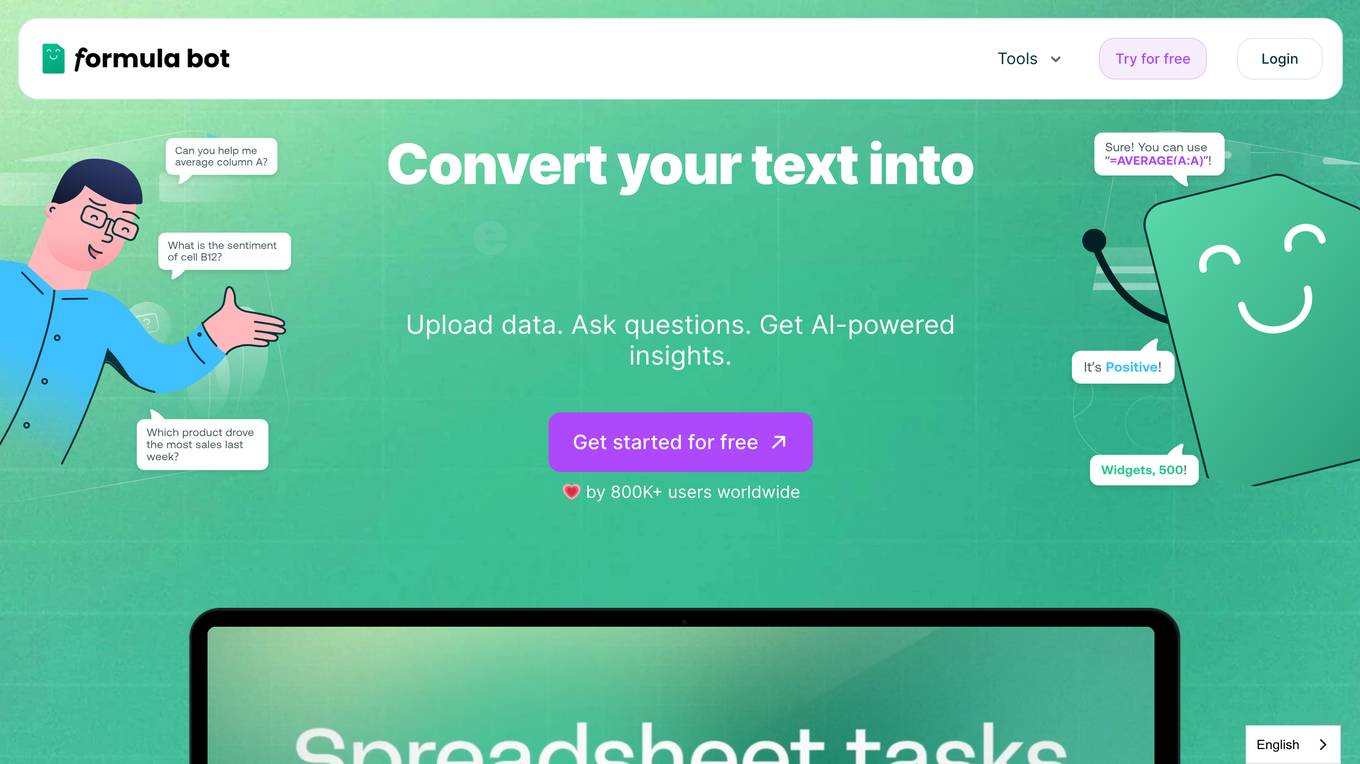
Formula Bot Tools
Formula Bot Tools is a website that provides AI-powered tools for working with data and spreadsheets. The website offers a variety of generators, including an Excel formula generator, a SQL query generator, and a spreadsheet generator. It also offers a data analyzer that can help users analyze their data through a simple conversation. Additionally, the website offers AI in spreadsheets, which can help users automate boring tasks. The website is trusted by Fortune 500, government, and small and medium-sized businesses.
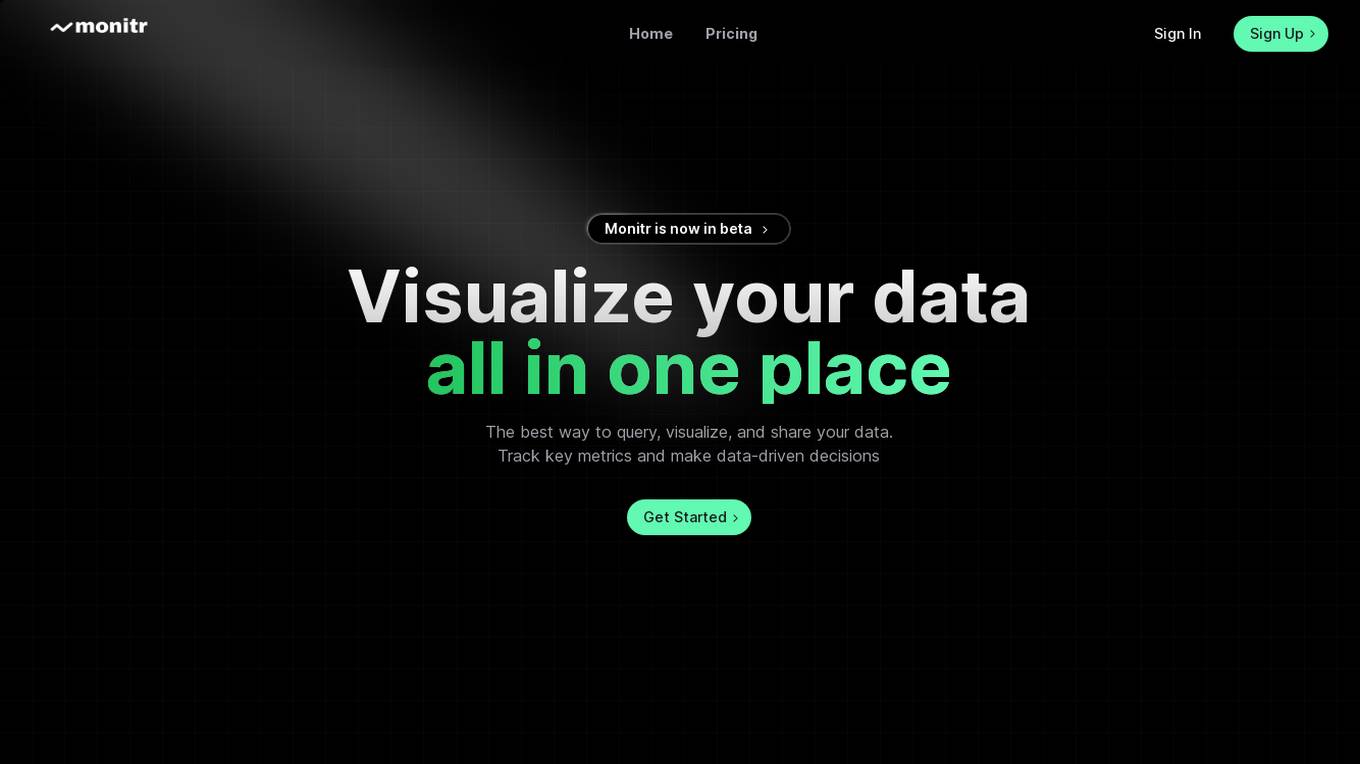
Monitr
Monitr is a data visualization and analytics platform that allows users to query, visualize, and share data in one place. It helps in tracking key metrics, making data-driven decisions, and breaking down data silos to provide a unified view of data from various sources. Users can create charts and dashboards, connect to different data sources like Postgresql and MySQL, and collaborate with teammates on SQL queries. Monitr's AI features are powered by Meta AI's Llama 3 LLM, enabling the development of powerful and flexible analytics tools for maximizing data utilization.
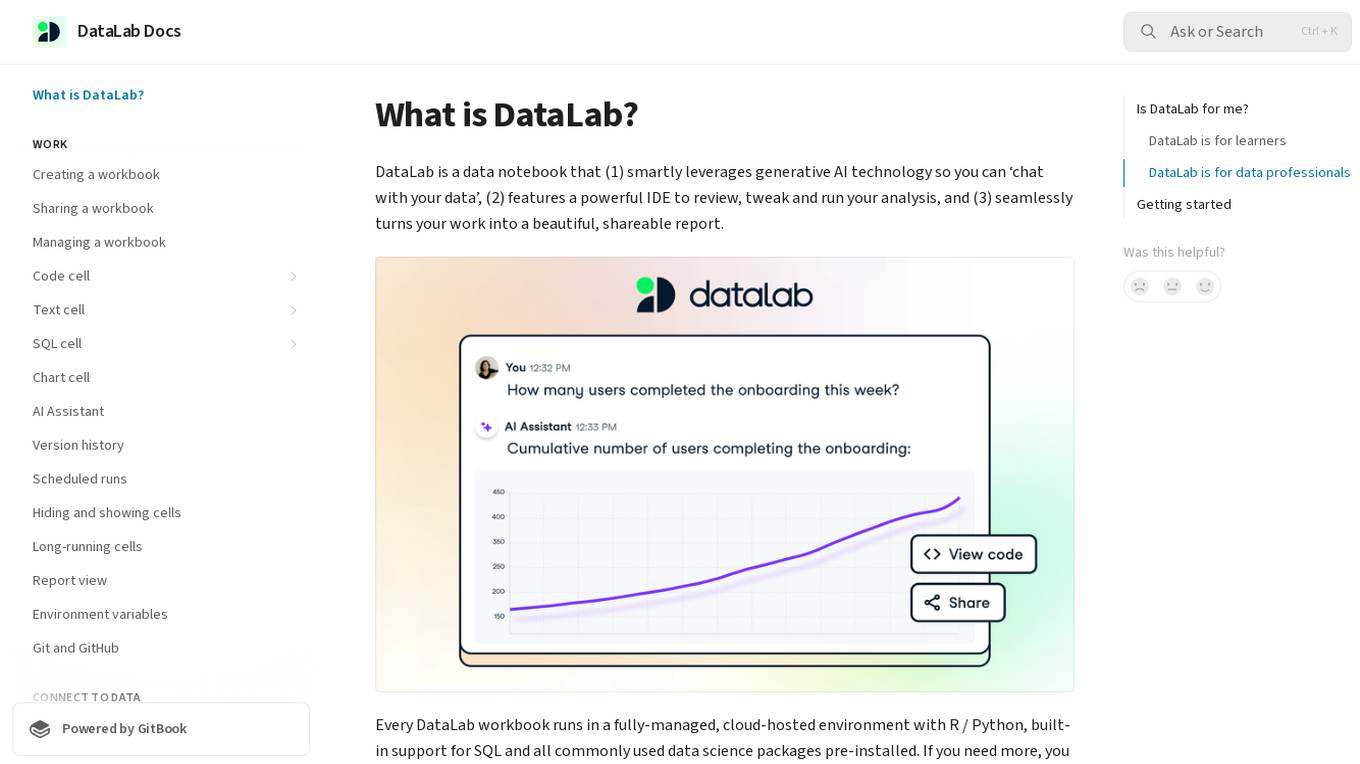
DataLab
DataLab is a data notebook that smartly leverages generative AI technology to enable users to 'chat with their data'. It features a powerful IDE for analysis, and seamlessly transforms work into shareable reports. The application runs in a cloud-hosted environment with support for R/Python, SQL, and various data science packages. Users can connect to external databases, collaborate in real-time, and utilize an AI Assistant for code generation and error correction.
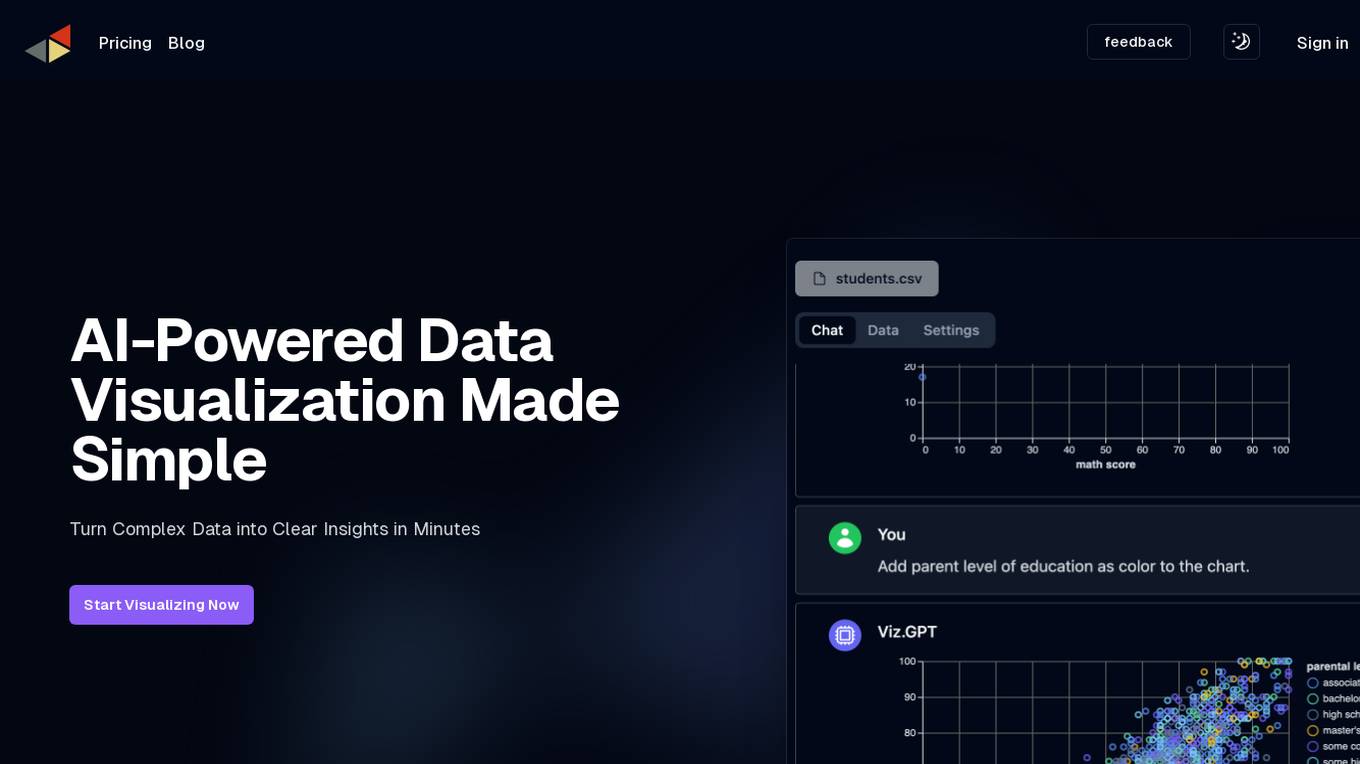
vizGPT
vizGPT is an AI-powered data visualization tool that simplifies the process of turning complex data into clear insights. The software offers contextual understanding, intelligent conversation, and natural language processing capabilities to help users quickly generate and understand complex visualizations. With real-time responses and contextual memory features, vizGPT provides a seamless data storytelling experience. Users can create visualizations using a no-code GUI with drag-and-drop functionality and leverage powerful data transformation and profiling tools. vizGPT aims to revolutionize data visualization by offering an intuitive and efficient solution for data analysis.
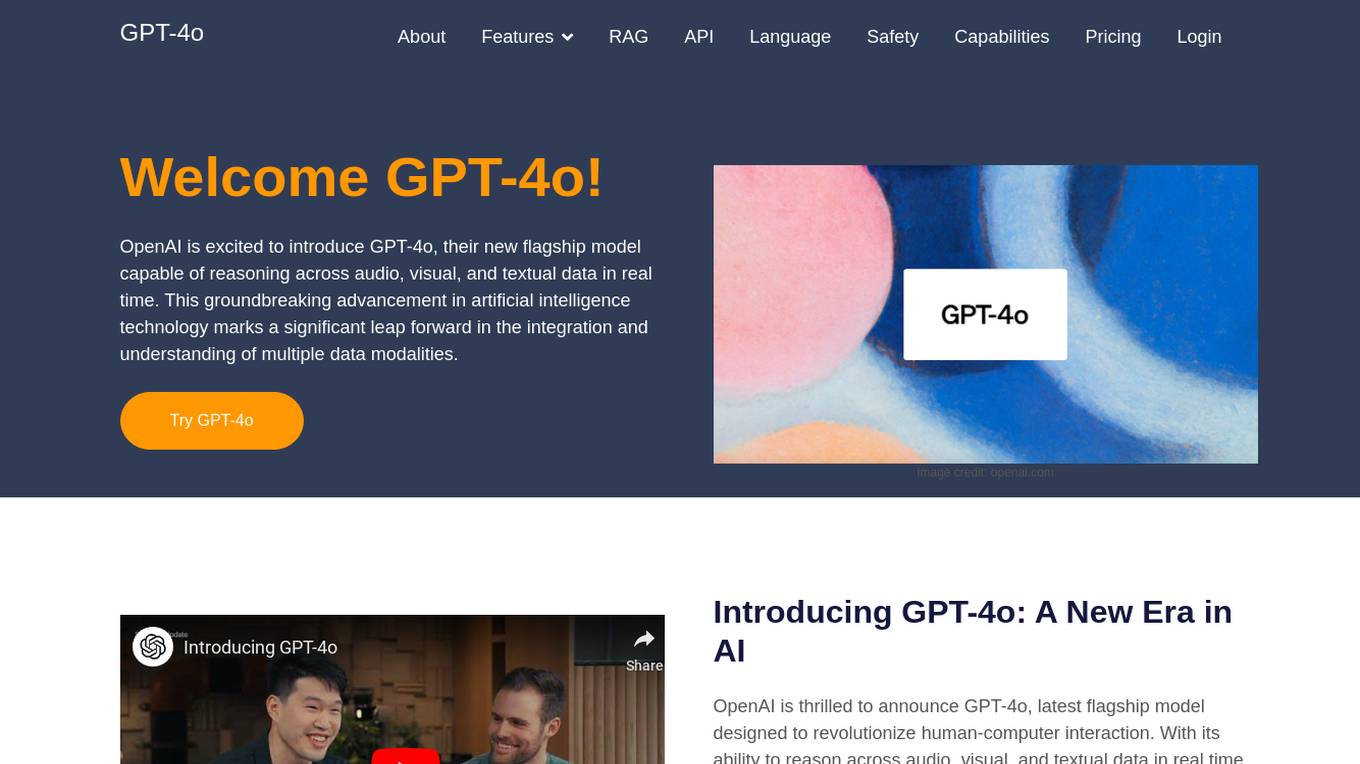
GPT-4o
GPT-4o is a state-of-the-art AI model developed by OpenAI, capable of processing and generating text, audio, and image outputs. It offers enhanced emotion recognition, real-time interaction, multimodal capabilities, improved accessibility, and advanced language capabilities. GPT-4o provides cost-effective and efficient AI solutions with superior vision and audio understanding. It aims to revolutionize human-computer interaction and empower users worldwide with cutting-edge AI technology.
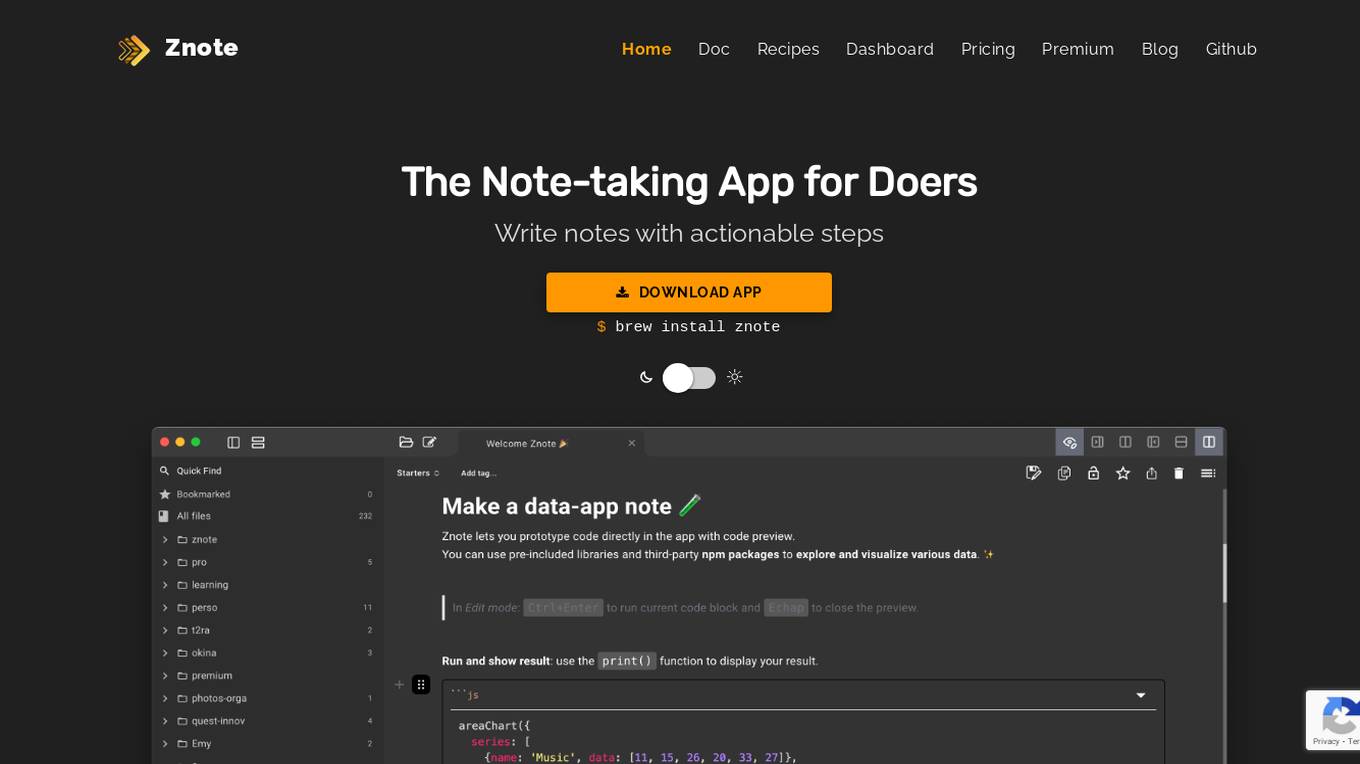
Znote
Znote is an innovative note-taking application designed for individuals who are action-oriented and seek to automate their processes incrementally. It allows users to write notes with actionable steps, add runnable code blocks for charts and actions, and automate tasks with templates and AI integration. Znote simplifies the process of working with files, running small pieces of code, and deploying notes and code blocks with ease. With features like transparent deployment, Markdown and JavaScript support, and compatibility with NPM/CDN dependencies, Znote is a versatile tool for boosting productivity and streamlining workflows.
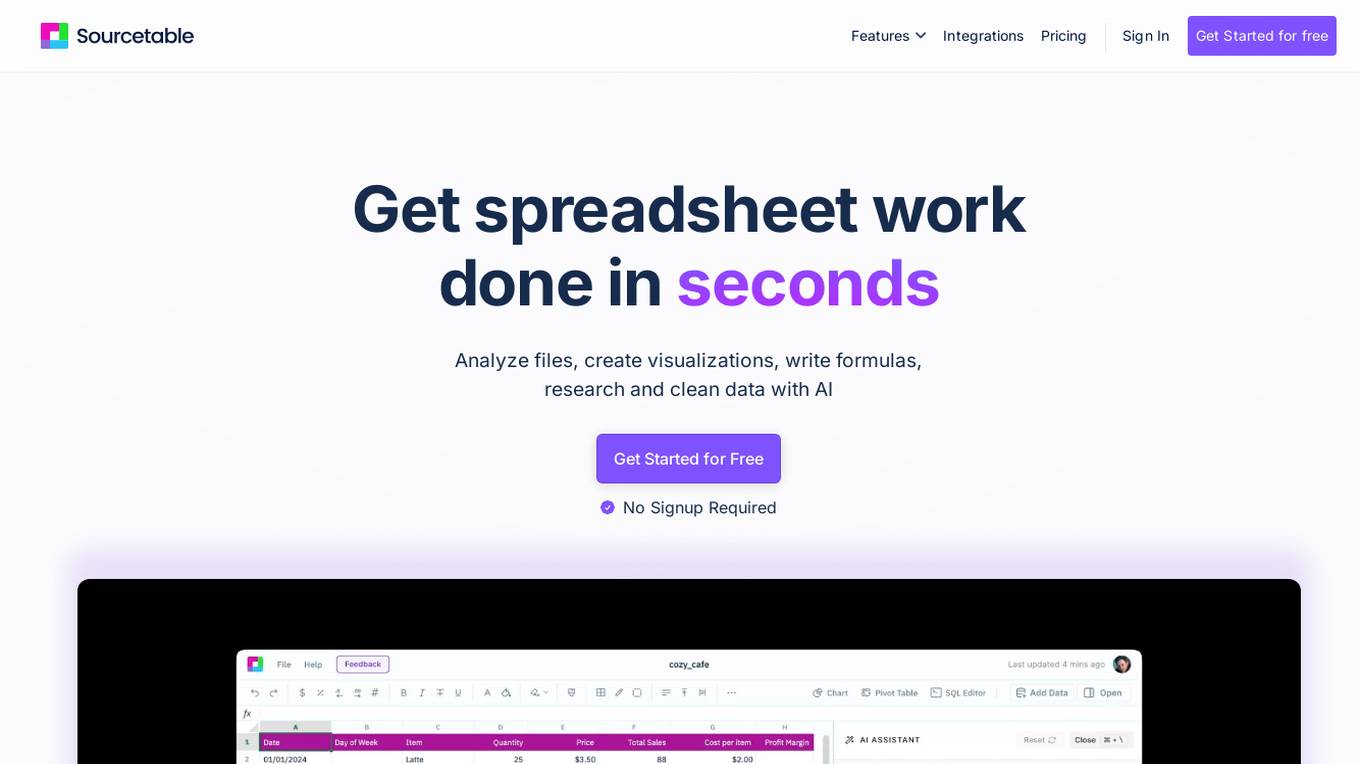
Sourcetable
Sourcetable is an AI-powered spreadsheet and data analysis tool that enables users to perform various tasks such as analyzing files, creating visualizations, writing formulas, researching, and cleaning data with the help of artificial intelligence. It offers features like AI Spreadsheet Assistant, AI Formula Generator, AI Chart Generator, AI Data Analysis, SQL Generator, and more to streamline data-related tasks efficiently.
Chartr
Chartr is an AI tool that quickly transforms information into graphics. It offers a user-friendly platform where users can easily create various types of visual representations such as flowcharts, timelines, mind maps, tables, and more. Chartr aims to simplify the process of visualizing data and making it more engaging and understandable for users across different industries.
6 - Open Source AI Tools
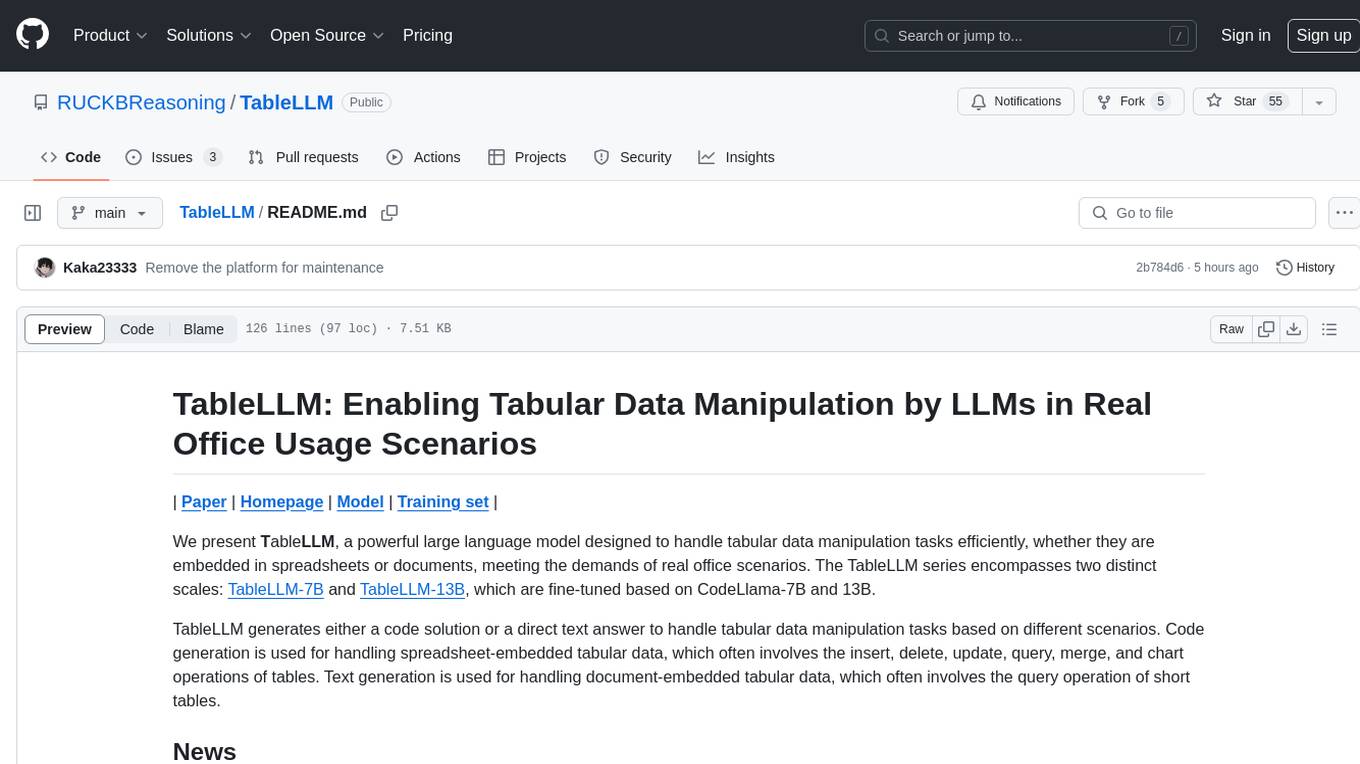
TableLLM
TableLLM is a large language model designed for efficient tabular data manipulation tasks in real office scenarios. It can generate code solutions or direct text answers for tasks like insert, delete, update, query, merge, and chart operations on tables embedded in spreadsheets or documents. The model has been fine-tuned based on CodeLlama-7B and 13B, offering two scales: TableLLM-7B and TableLLM-13B. Evaluation results show its performance on benchmarks like WikiSQL, Spider, and self-created table operation benchmark. Users can use TableLLM for code and text generation tasks on tabular data.
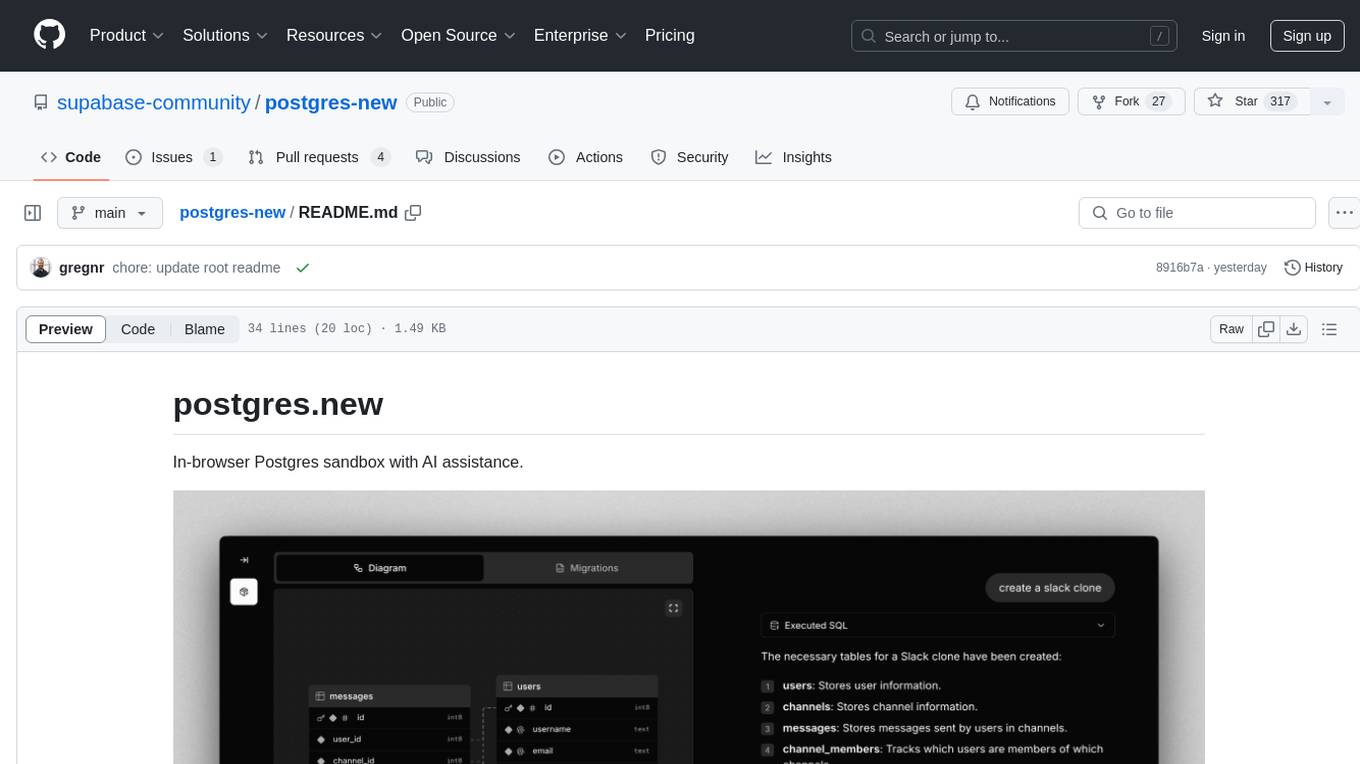
postgres-new
Postgres.new is an in-browser Postgres sandbox with AI assistance that allows users to spin up unlimited Postgres databases directly in the browser. Each database comes with a large language model (LLM) enabling features like drag-and-drop CSV import, report generation, chart creation, and database diagram building. The tool utilizes PGlite, a WASM version of Postgres, to run databases in the browser and store data in IndexedDB for persistence. The monorepo includes a frontend built with Next.js and a backend serving S3-backed PGlite databases over the PG wire protocol using pg-gateway.

ai-analyst
AI Analyst by E2B is an AI-powered code and data analysis tool built with Next.js and the E2B SDK. It allows users to analyze data with Meta's Llama 3.1, upload CSV files, and create interactive charts. The tool is powered by E2B Sandbox, Vercel's AI SDK, Next.js, and echarts library for interactive charts. Supported LLM providers include TogetherAI and Fireworks, with various chart types available for visualization.
xpert
Xpert is a powerful tool for data analysis and visualization. It provides a user-friendly interface to explore and manipulate datasets, perform statistical analysis, and create insightful visualizations. With Xpert, users can easily import data from various sources, clean and preprocess data, analyze trends and patterns, and generate interactive charts and graphs. Whether you are a data scientist, analyst, researcher, or student, Xpert simplifies the process of data analysis and visualization, making it accessible to users with varying levels of expertise.
doris
Doris is a lightweight and user-friendly data visualization tool designed for quick and easy exploration of datasets. It provides a simple interface for users to upload their data and generate interactive visualizations without the need for coding. With Doris, users can easily create charts, graphs, and dashboards to analyze and present their data in a visually appealing way. The tool supports various data formats and offers customization options to tailor visualizations to specific needs. Whether you are a data analyst, researcher, or student, Doris simplifies the process of data exploration and presentation.
clewdr
Clewdr is a collaborative platform for data analysis and visualization. It allows users to upload datasets, perform various data analysis tasks, and create interactive visualizations. The platform supports multiple users working on the same project simultaneously, enabling real-time collaboration and sharing of insights. Clewdr is designed to streamline the data analysis process and facilitate communication among team members. With its user-friendly interface and powerful features, Clewdr is suitable for data scientists, analysts, researchers, and anyone working with data to gain valuable insights and make informed decisions.
14 - OpenAI Gpts

Excelのショートカットキー答えられるかな?クイズジェネレーター
私はExcelのショートカットキーのクイズを出題するボットです。私の出した問題に正しく回答してください。採点します。
Sheets Expert
Master the art of Google Sheets with an assistant who can do everything from answer questions about basic features, explain functions in an eloquent and succinct manner, simplify the most complex formulas into easy steps, and help you identify techniques to effectively visualize your data.
VbaMaster!
Excel vba Assistant,Press ALT + F11 to paste the code onto the active sheet, and press the triangle play button.
Sheets Savvy - FinShift
Expert in Google Sheets, assisting with formulas, scripts, and more.
Plotter
Provide a hand-drawing or screenshot of your desired plot along with the data and I'll make the plot.