Best AI tools for< Build Dashboards >
15 - AI tool Sites
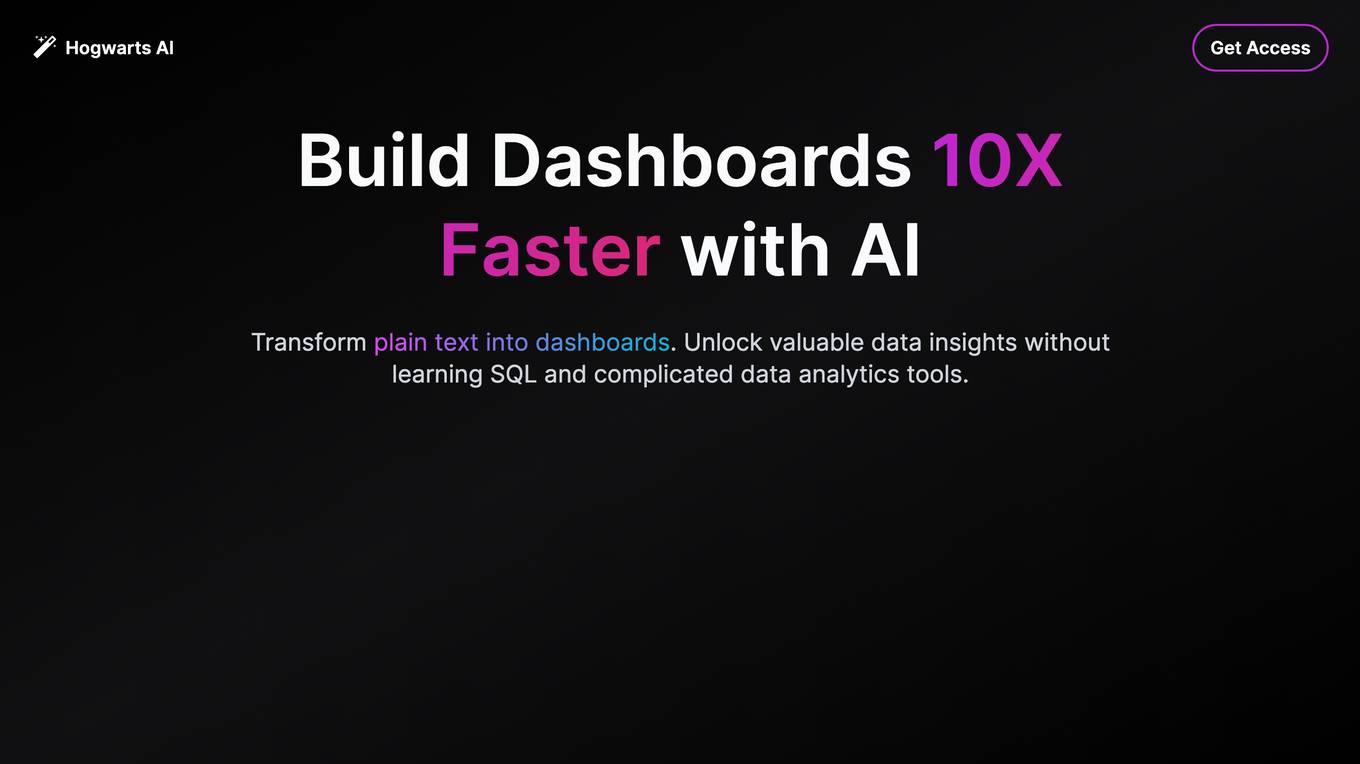
Hogwarts AI
Hogwarts AI empowers users to effortlessly build dashboards and unlock valuable data insights without the need for SQL or complex data analytics tools. Trained on a vast repository of queries and patterns, Hogwarts AI seamlessly transforms product data into intuitive charts and summaries. Its diverse data integration capabilities allow for effortless connection to various sources, including Postgres, Snowflake, Salesforce, Stripe, and even Excel tables. The AI Copilot feature enables users to create visually compelling charts with text in minutes, eliminating the need for SQL and DAX queries. Hogwarts AI also provides intelligent chart recommendations to facilitate deeper insights and enables the generation of shareable charts for product documentation and executive reviews.
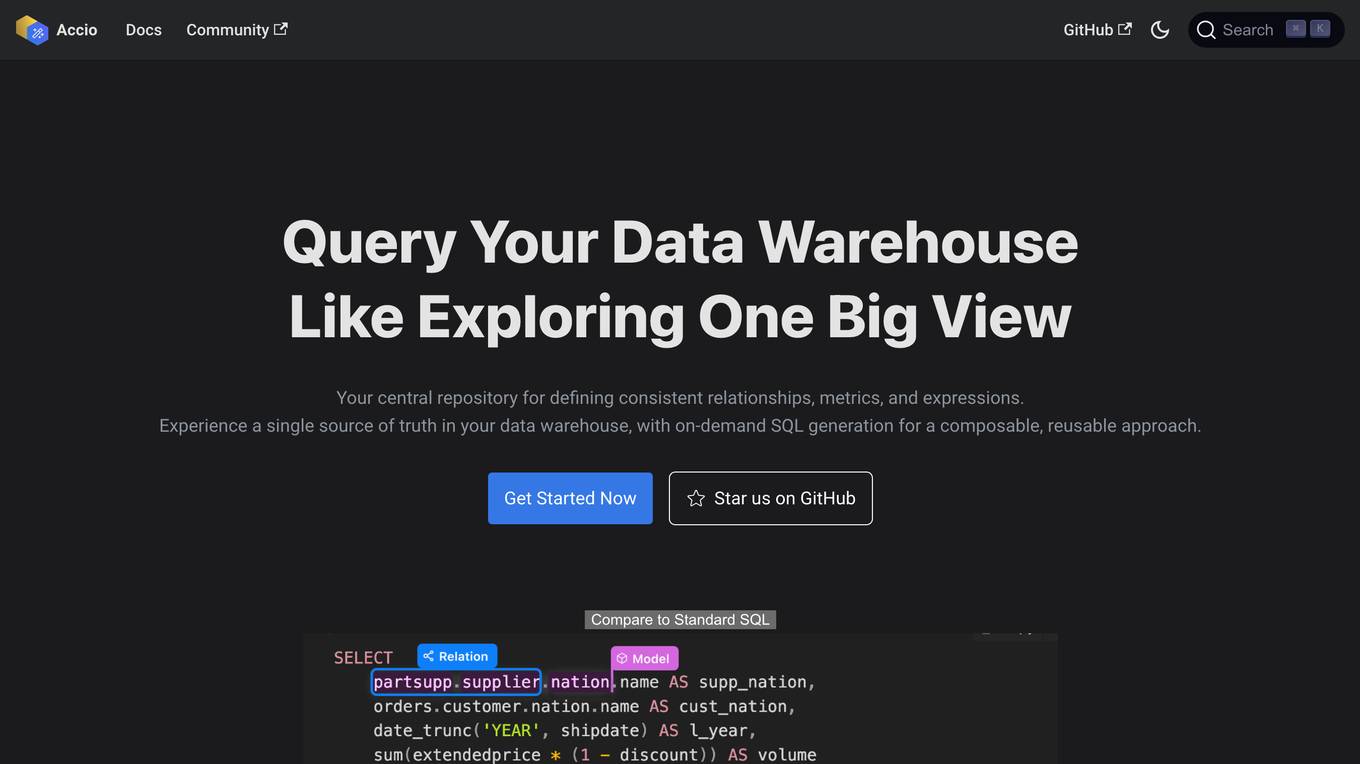
Accio
Accio is a data modeling tool that allows users to define consistent relationships, metrics, and expressions for on-the-fly computations in reports and dashboards across various BI tools. It provides a syntax similar to GraphQL that allows users to define models, relationships, and metrics in a human-readable format. Accio also offers a user-friendly interface that provides data analysts with a holistic view of the relationships between their data models, enabling them to grasp the interconnectedness and dependencies within their data ecosystem. Additionally, Accio utilizes DuckDB as a caching layer to accelerate query performance for BI tools.
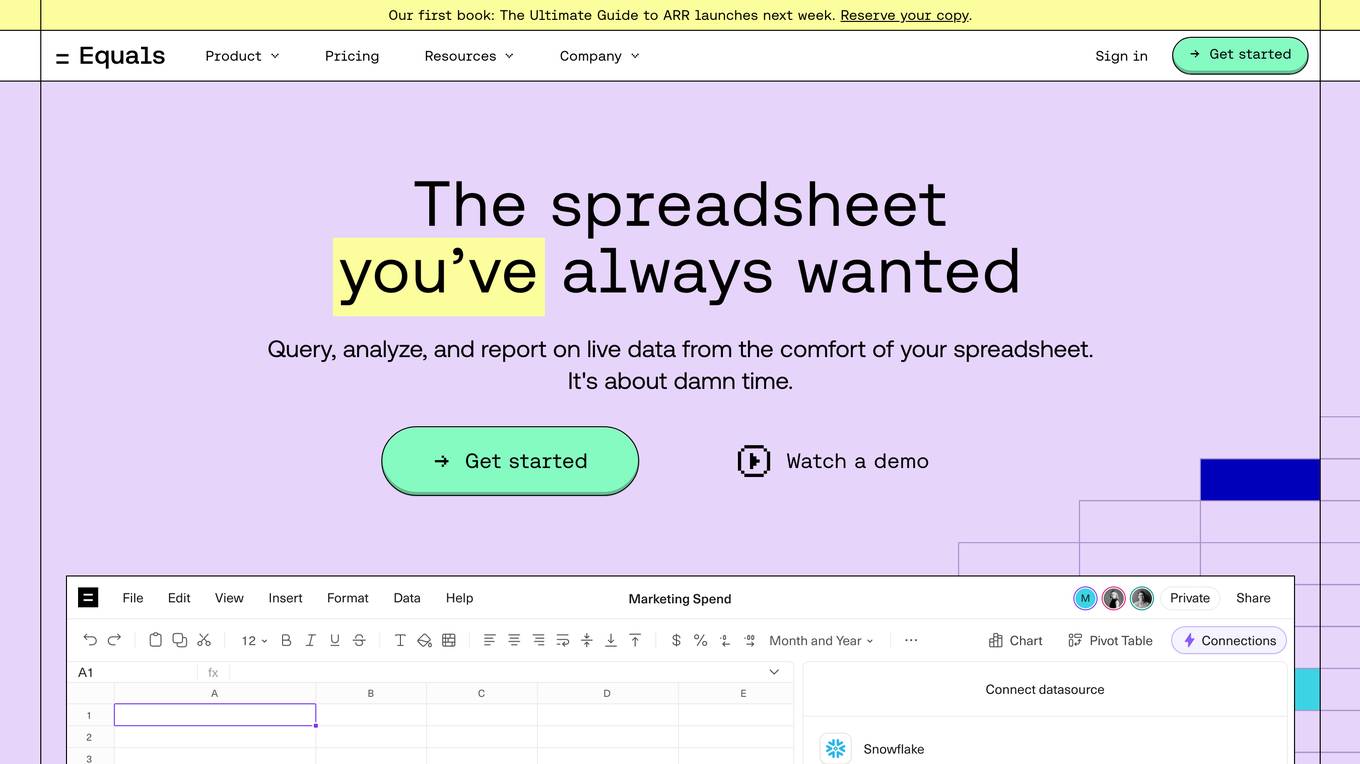
Equals
Equals is a next-generation analysis and reporting tool designed to help startups and businesses make better decisions with their data. It offers features such as live data connections, full-featured spreadsheets, and BI-grade dashboards. Equals bridges the gap between one-size-fits-all solutions and complex data platforms, providing users with a familiar and flexible environment for data exploration and reporting.
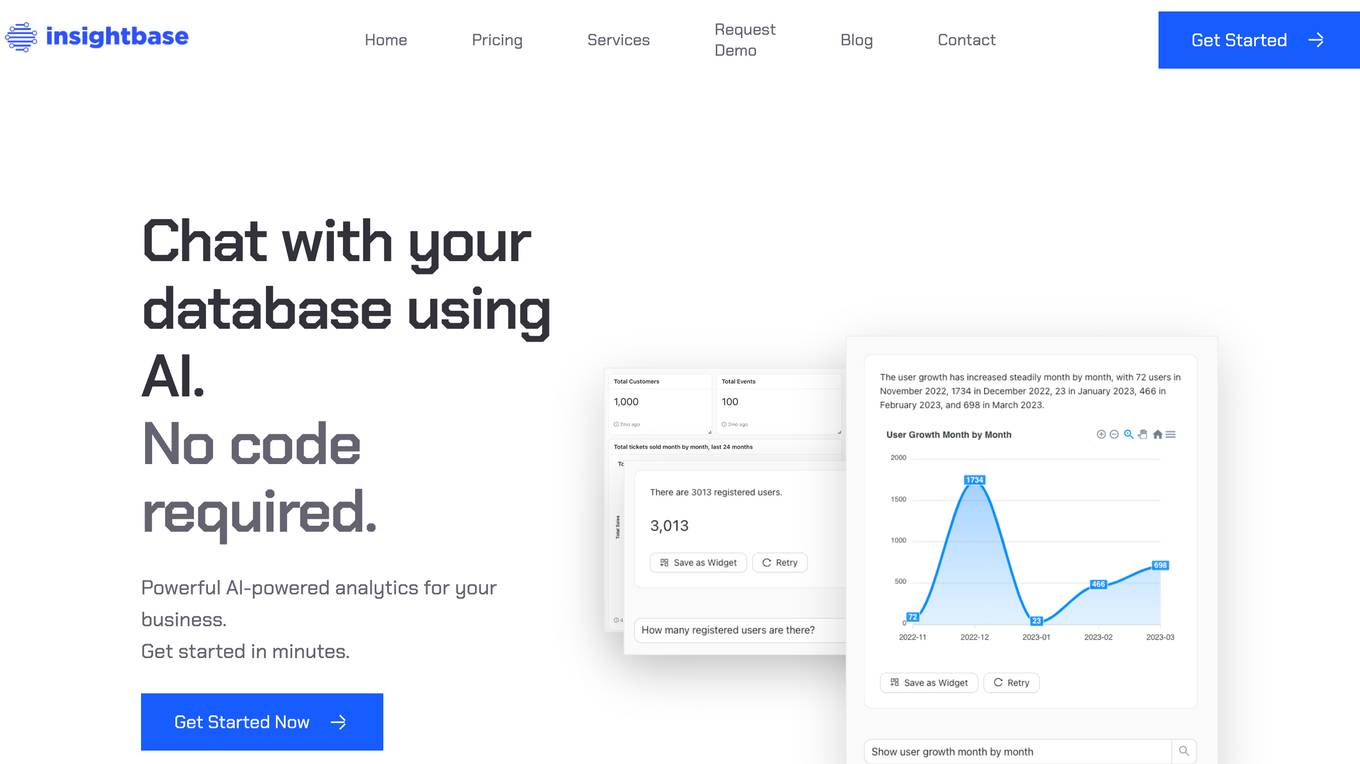
InsightBase
InsightBase is a powerful AI-powered analytics platform that makes it easy for everyone to get insights from their data. With InsightBase, you can ask questions in plain English and get answers in seconds, build powerful dashboards and reports in minutes, and get the most out of your data with the least amount of time, money, and resources.
Latitude
Latitude is an open-source framework for building interactive data apps using code. It provides a workspace for data analysts to streamline their workflow, connect to various data sources, perform data transformations, create visualizations, and collaborate with others. Latitude aims to simplify the data analysis process by offering features such as data snapshots, a data profiler, a built-in AI assistant, and tight integration with dbt.
Outerbase
Outerbase is an AI-powered database platform that allows users to view, query, visualize, and edit their data. It features an AI Copilot, EZQL™, that can answer questions and generate SQL queries, a table editor that makes it easy to work with data, and a variety of plugins and themes to customize the experience. Outerbase integrates with most popular databases, including Postgres, MySQL, BigQuery, and Snowflake.
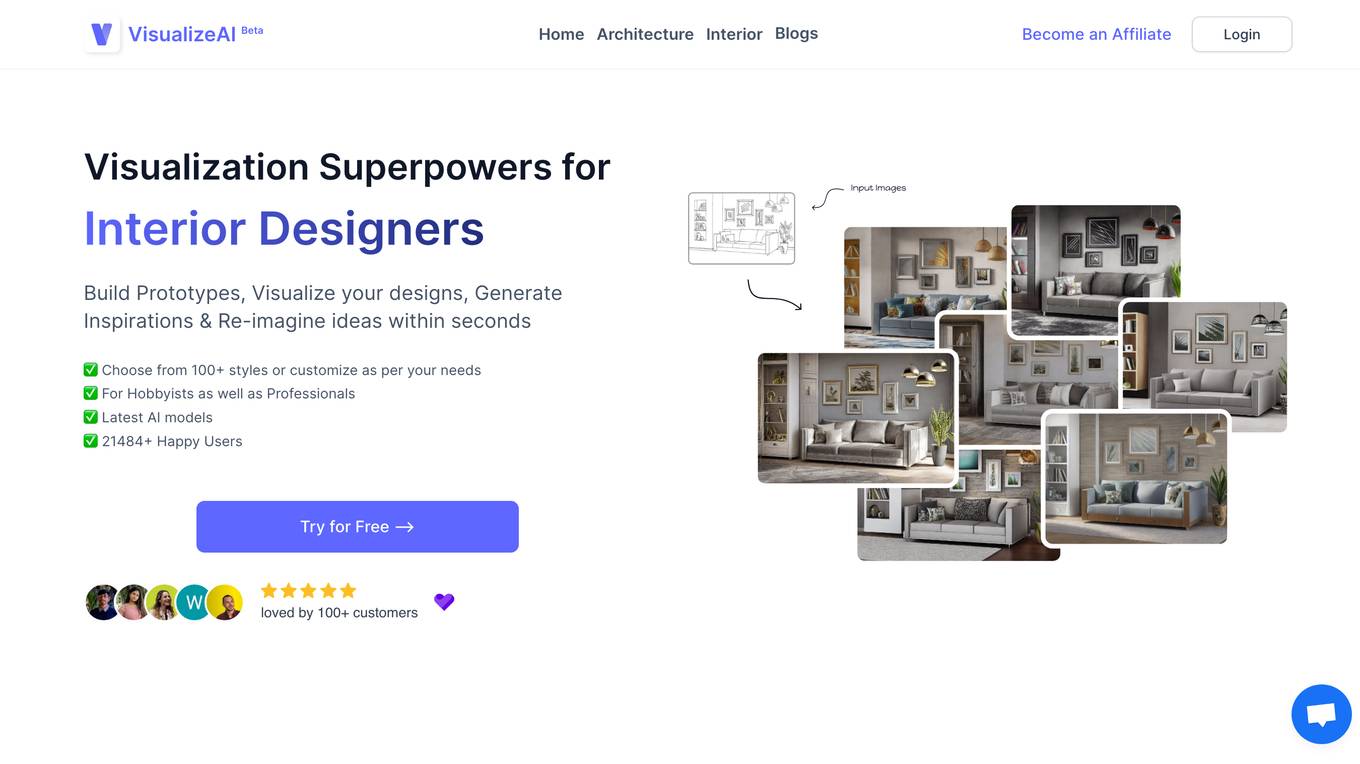
VisualizeAI
VisualizeAI is a powerful AI-powered platform that helps businesses visualize and analyze their data. With VisualizeAI, you can easily create stunning data visualizations, dashboards, and reports that will help you make better decisions. VisualizeAI is perfect for businesses of all sizes, from startups to large enterprises. It is easy to use and affordable, and it can help you save time and money while improving your decision-making.

Amazon Q in QuickSight
Amazon Q in QuickSight is a generative BI assistant that makes it easy to build and consume insights. With Amazon Q, BI users can build, discover, and share actionable insights and narratives in seconds using intuitive natural language experiences. Analysts can quickly build visuals and calculations and refine visuals using natural language. Business users can self-serve data and insights using natural language. Amazon Q is built with security and privacy in mind. It can understand and respect your existing governance identities, roles, and permissions and use this information to personalize its interactions. If a user doesn't have permission to access certain data without Amazon Q, they can't access it using Amazon Q either. Amazon Q in QuickSight is designed to meet the most stringent enterprise requirements from day one—none of your data or Amazon Q inputs and outputs are used to improve underlying models of Amazon Q for anyone but you.
Reform
Reform is a modern logistics software development platform that provides pre-built modules and AI capabilities to help teams build logistics applications quickly and efficiently. It offers features such as document AI for automating data capture, universal TMS integrations for seamless connectivity, embeddable customer dashboards for real-time data visibility, and more.
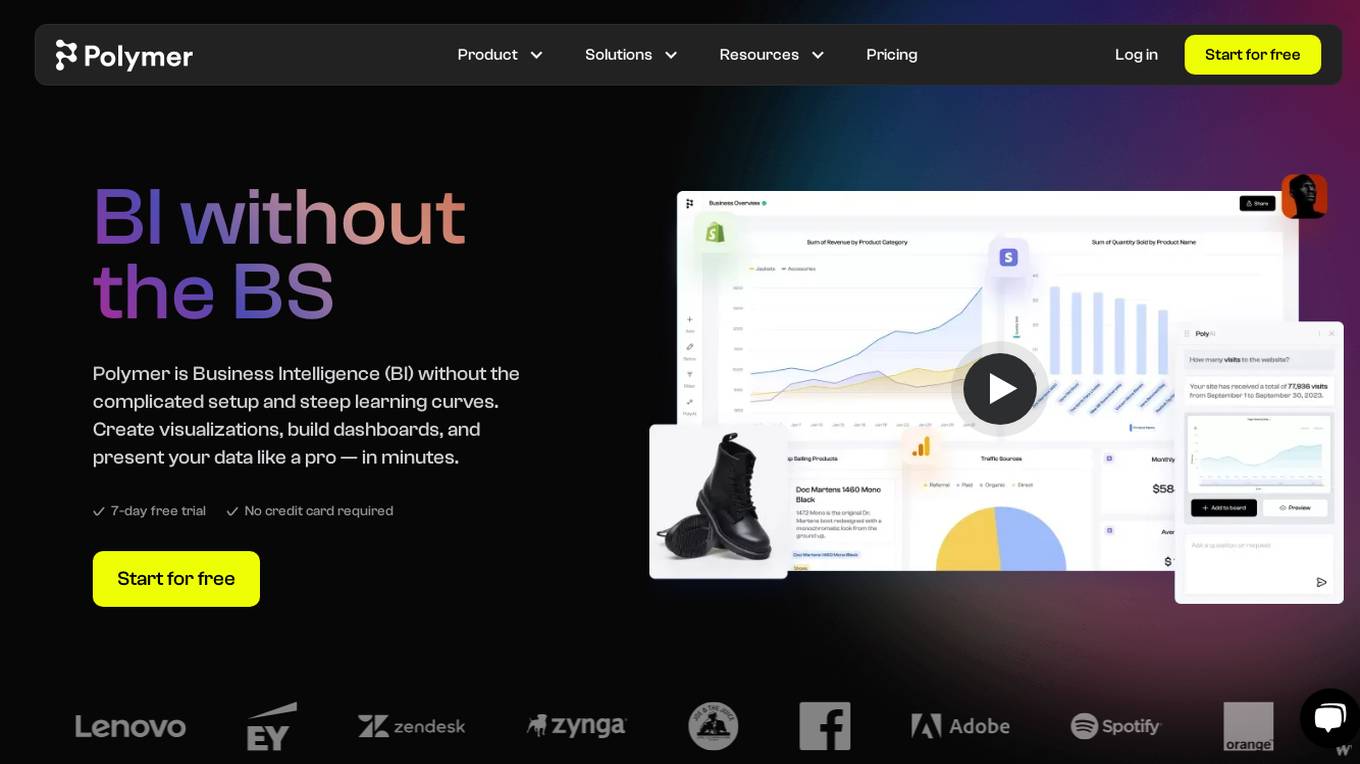
Polymer
Polymer is a business intelligence (BI) tool that makes it easy to connect to your data, build visualizations, and share insights. With Polymer, you don't need to be a data analyst to create beautiful dashboards and interactive reports. Polymer's AI-powered features make it easy to get started, even if you're new to BI. With Polymer, you can:
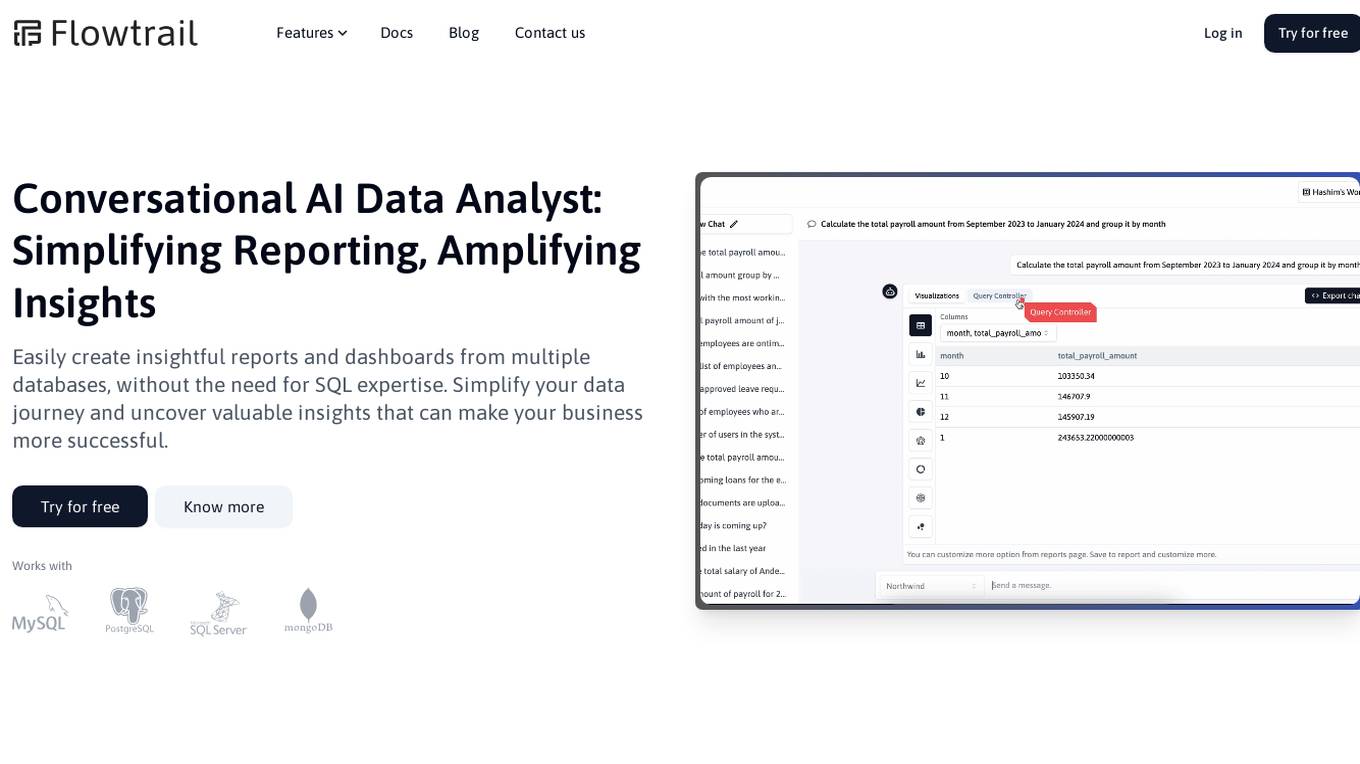
Flowtrail AI
Flowtrail AI is a powerful data analytics platform that simplifies reporting and amplifies insights for businesses. It allows users to effortlessly create insightful reports and dashboards from multiple databases without the need for SQL expertise. With features like AI-driven query building, natural language processing, and text-to-SQL conversion, Flowtrail AI transforms data into actionable insights, making data-driven decision-making more efficient and effective.
Looker
Looker is a business intelligence platform that offers embedded analytics and AI-powered BI solutions. Leveraging Google's AI-led innovation, Looker delivers intelligent BI by combining foundational AI, cloud-first infrastructure, industry-leading APIs, and a flexible semantic layer. It allows users to build custom data experiences, transform data into integrated experiences, and create deeply integrated dashboards. Looker also provides a universal semantic modeling layer for unified, trusted data sources and offers self-service analytics capabilities through Looker and Looker Studio. Additionally, Looker features Gemini, an AI-powered analytics assistant that accelerates analytical workflows and offers a collaborative and conversational user experience.
Walter Shields Data Academy
Walter Shields Data Academy is an AI-powered platform offering premium training in SQL, Python, and Excel. With over 200,000 learners, it provides curated courses from bestselling books and LinkedIn Learning. The academy aims to revolutionize data expertise and empower individuals to excel in data analysis and AI technologies.
Infogram
Infogram is an AI-powered platform that enables users to create interactive data visualizations, infographics, reports, maps, charts, tables, slides, and dashboards effortlessly. With a wide range of features such as AI chart recommendations, interactive content, embeds, custom maps, data import, and advanced editing tools, Infogram empowers users to craft compelling visual stories. The platform also offers content engagement analytics, real-time collaboration, and a brand kit for consistent branding. Trusted by over 10 million users worldwide, Infogram is a go-to tool for individuals, teams, and organizations looking to transform data into engaging visuals.
Manifold
Manifold is an AI data platform designed specifically for life sciences. It offers a collaborative workbench, data science tools, AI-powered cohort exploration, batch bioinformatics, data dashboards, data engineering solutions, access control, and more. The platform aims to enable faster collaboration and research in the life sciences field by providing a comprehensive suite of tools and features. Trusted by leading institutions, Manifold helps streamline data collection, analysis, and collaboration to accelerate scientific research.
7 - Open Source AI Tools
supersonic
SuperSonic is a next-generation BI platform that integrates Chat BI (powered by LLM) and Headless BI (powered by semantic layer) paradigms. This integration ensures that Chat BI has access to the same curated and governed semantic data models as traditional BI. Furthermore, the implementation of both paradigms benefits from the integration: * Chat BI's Text2SQL gets augmented with context-retrieval from semantic models. * Headless BI's query interface gets extended with natural language API. SuperSonic provides a Chat BI interface that empowers users to query data using natural language and visualize the results with suitable charts. To enable such experience, the only thing necessary is to build logical semantic models (definition of metric/dimension/tag, along with their meaning and relationships) through a Headless BI interface. Meanwhile, SuperSonic is designed to be extensible and composable, allowing custom implementations to be added and configured with Java SPI. The integration of Chat BI and Headless BI has the potential to enhance the Text2SQL generation in two dimensions: 1. Incorporate data semantics (such as business terms, column values, etc.) into the prompt, enabling LLM to better understand the semantics and reduce hallucination. 2. Offload the generation of advanced SQL syntax (such as join, formula, etc.) from LLM to the semantic layer to reduce complexity. With these ideas in mind, we develop SuperSonic as a practical reference implementation and use it to power our real-world products. Additionally, to facilitate further development we decide to open source SuperSonic as an extensible framework.
sqlcoder
Defog's SQLCoder is a family of state-of-the-art large language models (LLMs) designed for converting natural language questions into SQL queries. It outperforms popular open-source models like gpt-4 and gpt-4-turbo on SQL generation tasks. SQLCoder has been trained on more than 20,000 human-curated questions based on 10 different schemas, and the model weights are licensed under CC BY-SA 4.0. Users can interact with SQLCoder through the 'transformers' library and run queries using the 'sqlcoder launch' command in the terminal. The tool has been tested on NVIDIA GPUs with more than 16GB VRAM and Apple Silicon devices with some limitations. SQLCoder offers a demo on their website and supports quantized versions of the model for consumer GPUs with sufficient memory.
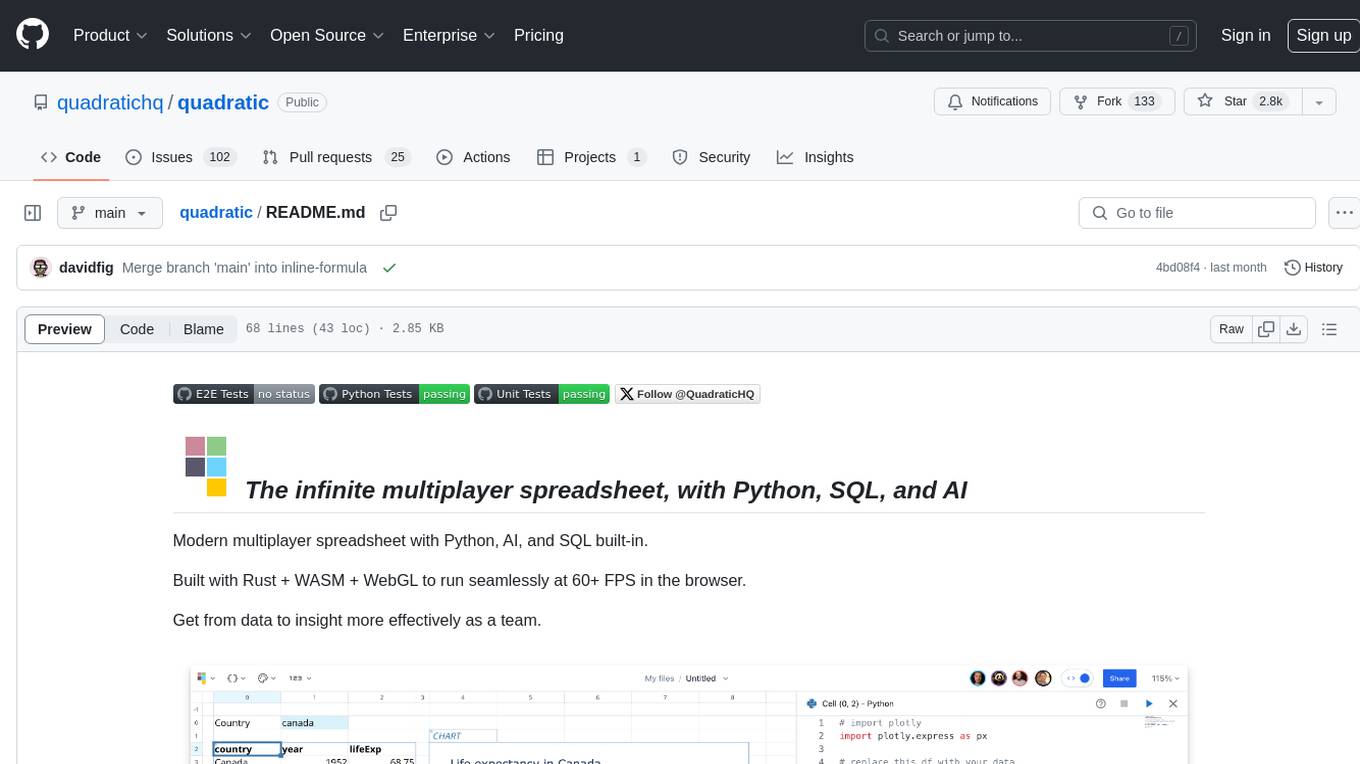
quadratic
Quadratic is a modern multiplayer spreadsheet application that integrates Python, AI, and SQL functionalities. It aims to streamline team collaboration and data analysis by enabling users to pull data from various sources and utilize popular data science tools. The application supports building dashboards, creating internal tools, mixing data from different sources, exploring data for insights, visualizing Python workflows, and facilitating collaboration between technical and non-technical team members. Quadratic is built with Rust + WASM + WebGL to ensure seamless performance in the browser, and it offers features like WebGL Grid, local file management, Python and Pandas support, Excel formula support, multiplayer capabilities, charts and graphs, and team support. The tool is currently in Beta with ongoing development for additional features like JS support, SQL database support, and AI auto-complete.
buster
Buster is a modern analytics platform designed with AI in mind, focusing on self-serve experiences powered by Large Language Models. It addresses pain points in existing tools by advocating for AI-centric app development, cost-effective data warehousing, improved CI/CD processes, and empowering data teams to create powerful, user-friendly data experiences. The platform aims to revolutionize AI analytics by enabling data teams to build deep integrations and own their entire analytics stack.
Ivy-Framework
Ivy-Framework is a powerful tool for building internal applications with AI assistance using C# codebase. It provides a CLI for project initialization, authentication integrations, database support, LLM code generation, secrets management, container deployment, hot reload, dependency injection, state management, routing, and external widget framework. Users can easily create data tables for sorting, filtering, and pagination. The framework offers a seamless integration of front-end and back-end development, making it ideal for developing robust internal tools and dashboards.
doris
Doris is a lightweight and user-friendly data visualization tool designed for quick and easy exploration of datasets. It provides a simple interface for users to upload their data and generate interactive visualizations without the need for coding. With Doris, users can easily create charts, graphs, and dashboards to analyze and present their data in a visually appealing way. The tool supports various data formats and offers customization options to tailor visualizations to specific needs. Whether you are a data analyst, researcher, or student, Doris simplifies the process of data exploration and presentation.
qwery-core
Qwery is a platform for querying and visualizing data using natural language without technical knowledge. It seamlessly integrates with various datasources, generates optimized queries, and delivers outcomes like result sets, dashboards, and APIs. Features include natural language querying, multi-database support, AI-powered agents, visual data apps, desktop & cloud options, template library, and extensibility through plugins. The project is under active development and not yet suitable for production use.
13 - OpenAI Gpts
Streamlit Assistant
This GPT can read all Streamlit Documantation and helps you about Streamlit.

Vicky Vega
Generates Vega-Lite JSON code for Power BI visuals from data and descriptions.
Addy™ for Power BI Data Analytics
Advisor for Power BI Analytics, aiding in solution planning, design, and construction. Ask Hi or type /help for how to get started.