Best AI tools for< Analyze Graphs >
20 - AI tool Sites
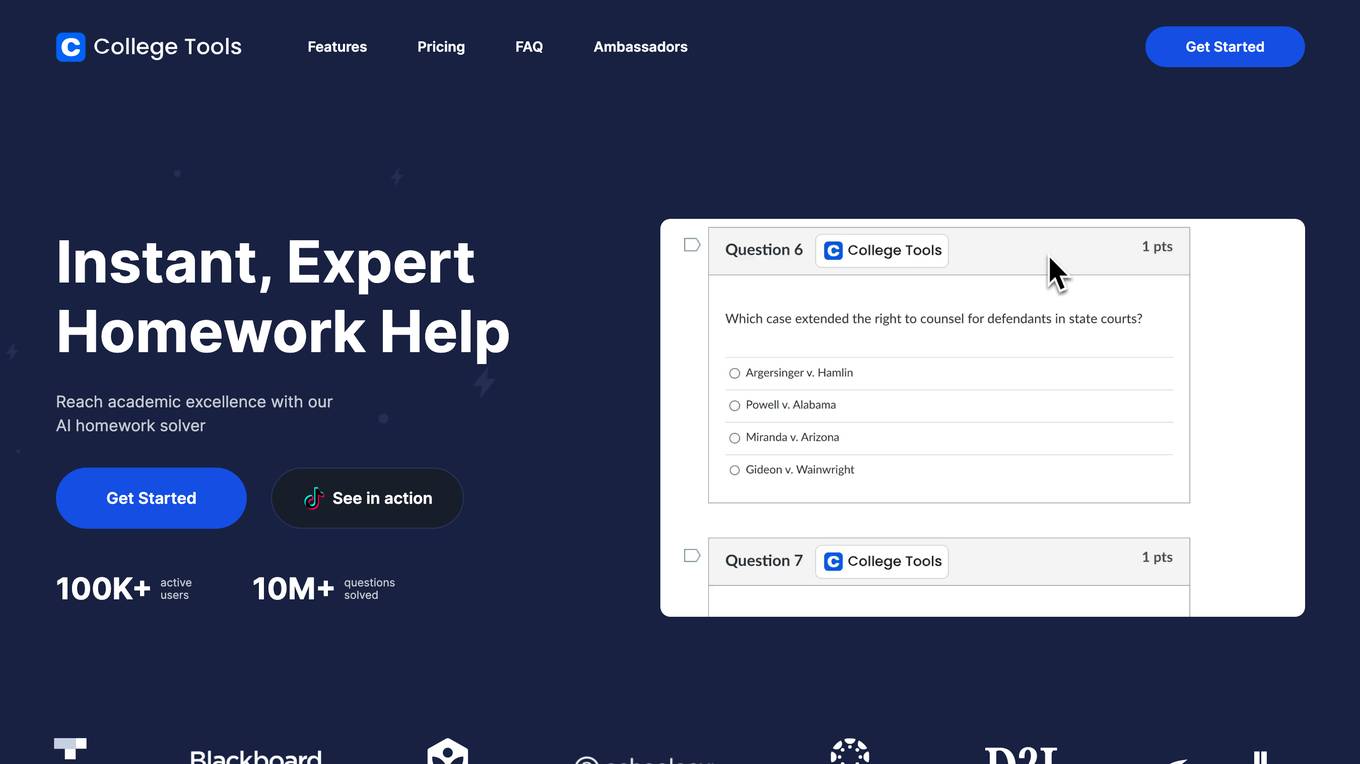
College Tools
College Tools is an AI-powered homework solver that provides instant, expert help to students. It can answer questions from any website, including those without specialized support, and is fully integrated with Learning Management Systems (LMS) such as McGraw Hill Connect, Blackboard, Canvas, Smartbook, Moodle, and many others. College Tools also offers advanced recognition features that allow users to capture and analyze graphs and image-based questions, and provides detailed step-by-step guidance for each question. The tool is designed to help students improve their understanding and academic results.
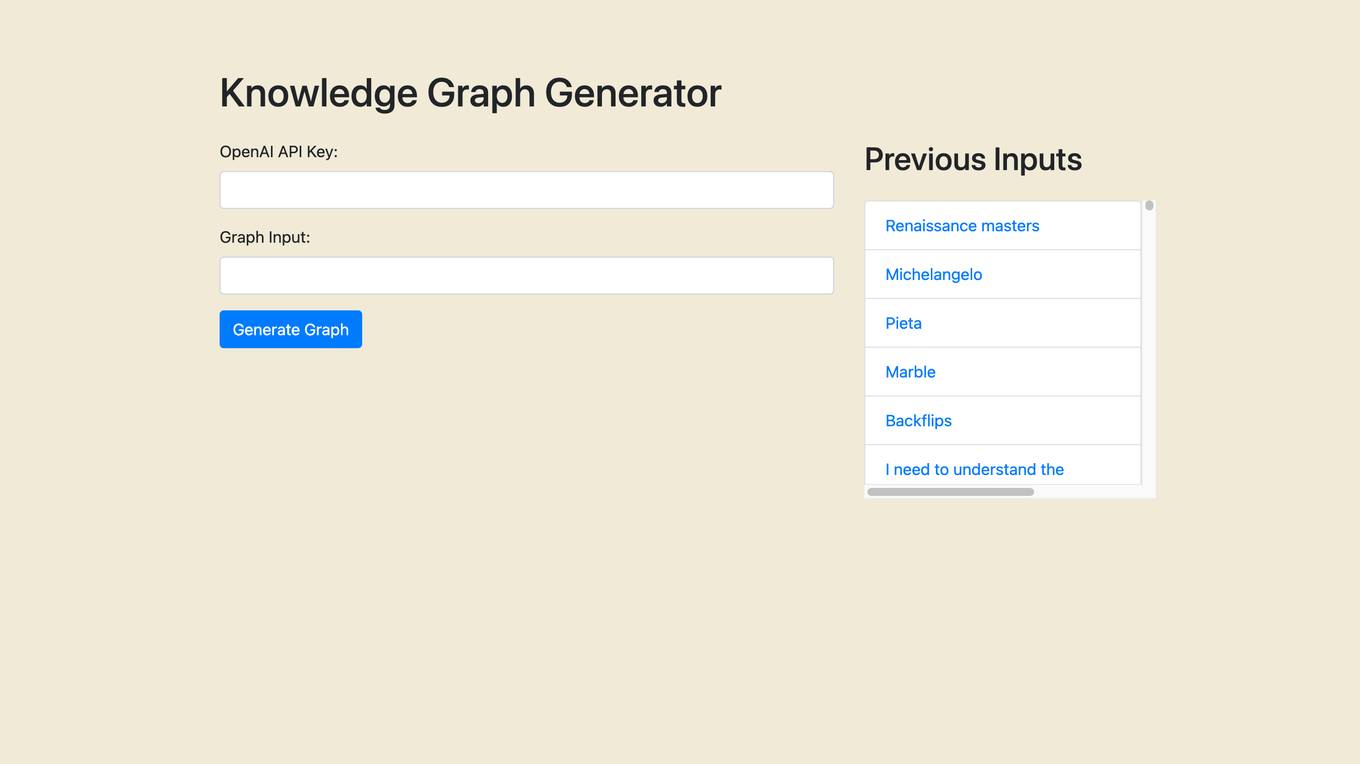
Knowledge Graph Generator
The website is an AI tool designed to generate a knowledge graph based on input text. It uses advanced algorithms and machine learning capabilities to streamline operations, deliver personalized experiences, and unlock new possibilities. Users can input text related to various topics, and the tool processes the information to create a structured knowledge graph.

Julius AI
Julius AI is an advanced AI data analyst tool that allows users to analyze data with computational AI, chat with files to get expert-level insights, create sleek data visualizations, perform modeling and predictive forecasting, solve math, physics, and chemistry problems, generate polished analyses and summaries, save time by automating data work, and unlock statistical modeling without complexity. It offers features like generating visualizations, asking data questions, effortless cleaning, instant data export, creating animations, and supercharging data analysis. Julius AI is loved by over 1,200,000 users worldwide and is designed to help knowledge workers make the most out of their data.
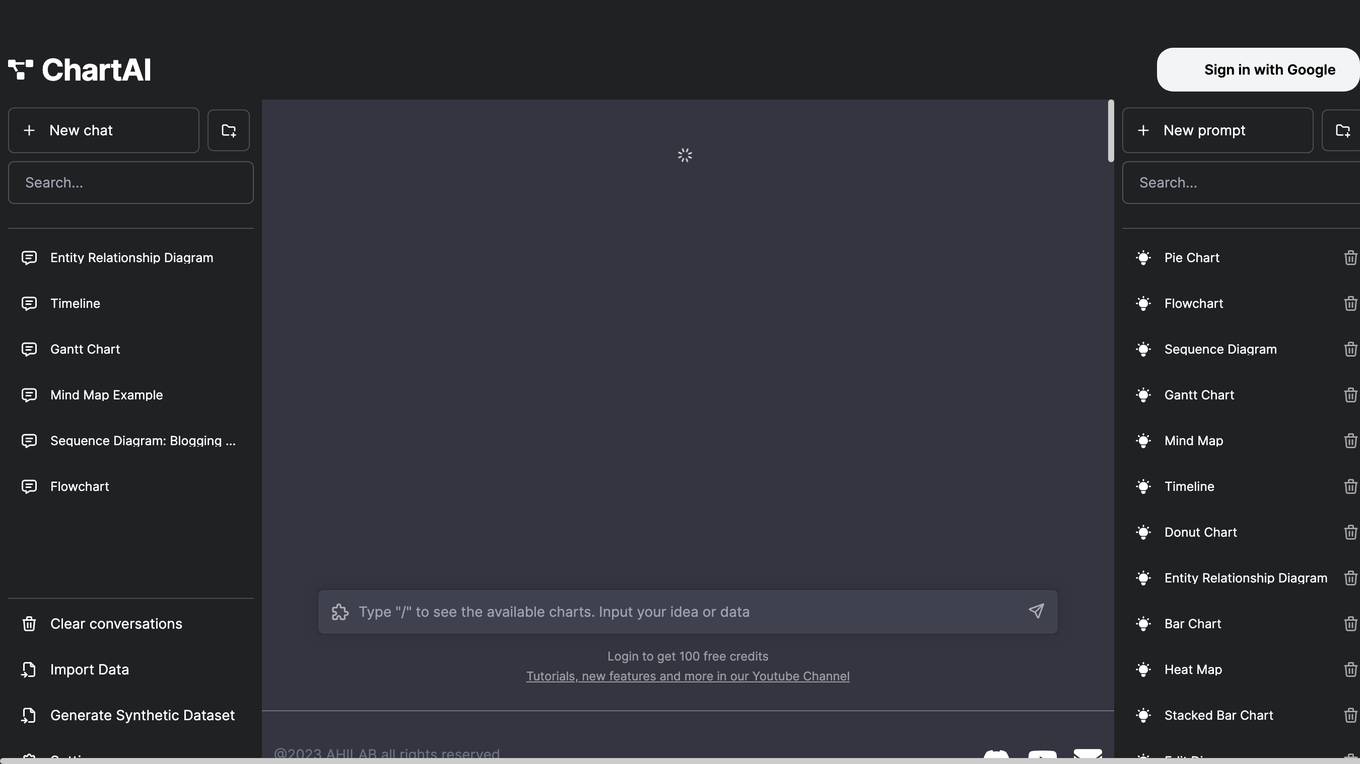
ChartAI
ChartAI is an AI-powered tool that helps you create beautiful charts and graphs from your data in seconds. With ChartAI, you can easily create bar charts, line charts, pie charts, and more. You can also customize your charts with different colors, fonts, and styles. ChartAI is the perfect tool for anyone who wants to create professional-looking charts and graphs quickly and easily.
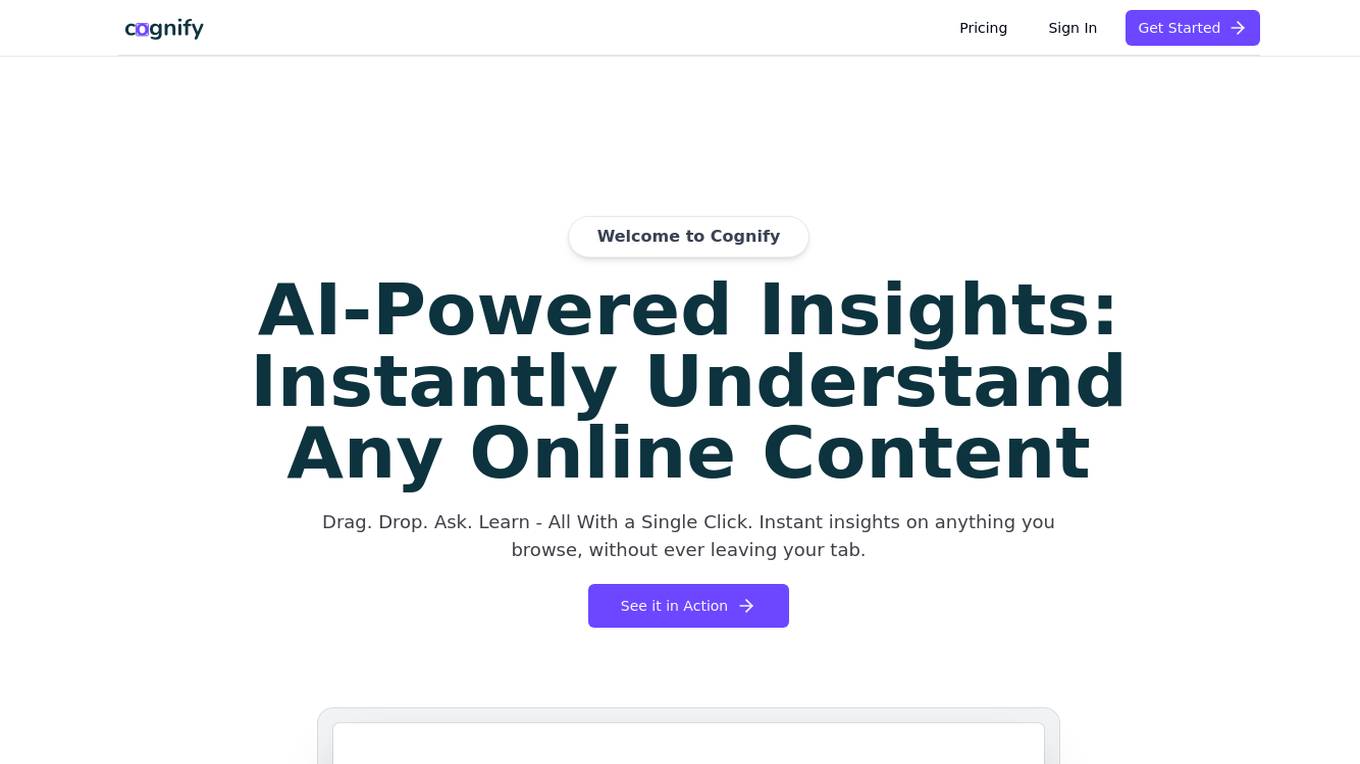
Cognify Insights
Cognify Insights is an AI-powered research assistant that provides instant understanding of online content such as text, diagrams, tables, and graphs. With a simple drag and drop feature, users can quickly analyze any type of content without leaving their browsing tab. The tool offers valuable insights and helps users unlock information efficiently.
Lychee
Lychee is an all-in-one data platform designed to streamline the data workflow process, from data collection to analysis, visualization, and sharing. It offers powerful features such as instant graph generation, AI data analysis, website deployment, social media sharing, and team collaboration. Lychee aims to simplify complex data tasks and help users make faster progress in their data-related projects.
ChartFast
ChartFast is an AI Data Analyzer tool that automates data visualization and analysis tasks, powered by GPT-4 technology. It allows users to generate precise and sleek graphs in seconds, process vast amounts of data, and provide interactive data queries and quick exports. With features like specialized internal libraries for complex graph generation, customizable visualization code, and instant data export, ChartFast aims to streamline data work and enhance data analysis efficiency.
SheetBot AI
SheetBot AI is an AI data analyst tool that enables users to analyze data quickly without the need for coding. It automates repetitive and time-consuming data tasks, making data visualization and analysis more efficient. With SheetBot AI, users can generate accurate and visually appealing graphs in seconds, streamlining the data analysis process.
Eczemaless
Eczemaless is an AI-powered eczema management app that helps users track and manage their condition. The app offers a variety of features, including eczema severity scoring, real-time weather alerts, food tracking, user-friendly graphs, and customized care routines. Eczemaless is available in five languages and has been downloaded over 15,000 times.
Hepta AI
Hepta AI is an AI-powered statistics tool designed for scientific research. It simplifies the process of statistical analysis by allowing users to easily input their data and receive comprehensive results, including tables, graphs, and statistical analysis. With a focus on accuracy and efficiency, Hepta AI aims to streamline the research process for scientists and researchers, providing valuable insights and data visualization. The tool offers a user-friendly interface and advanced AI algorithms to deliver precise and reliable statistical outcomes.
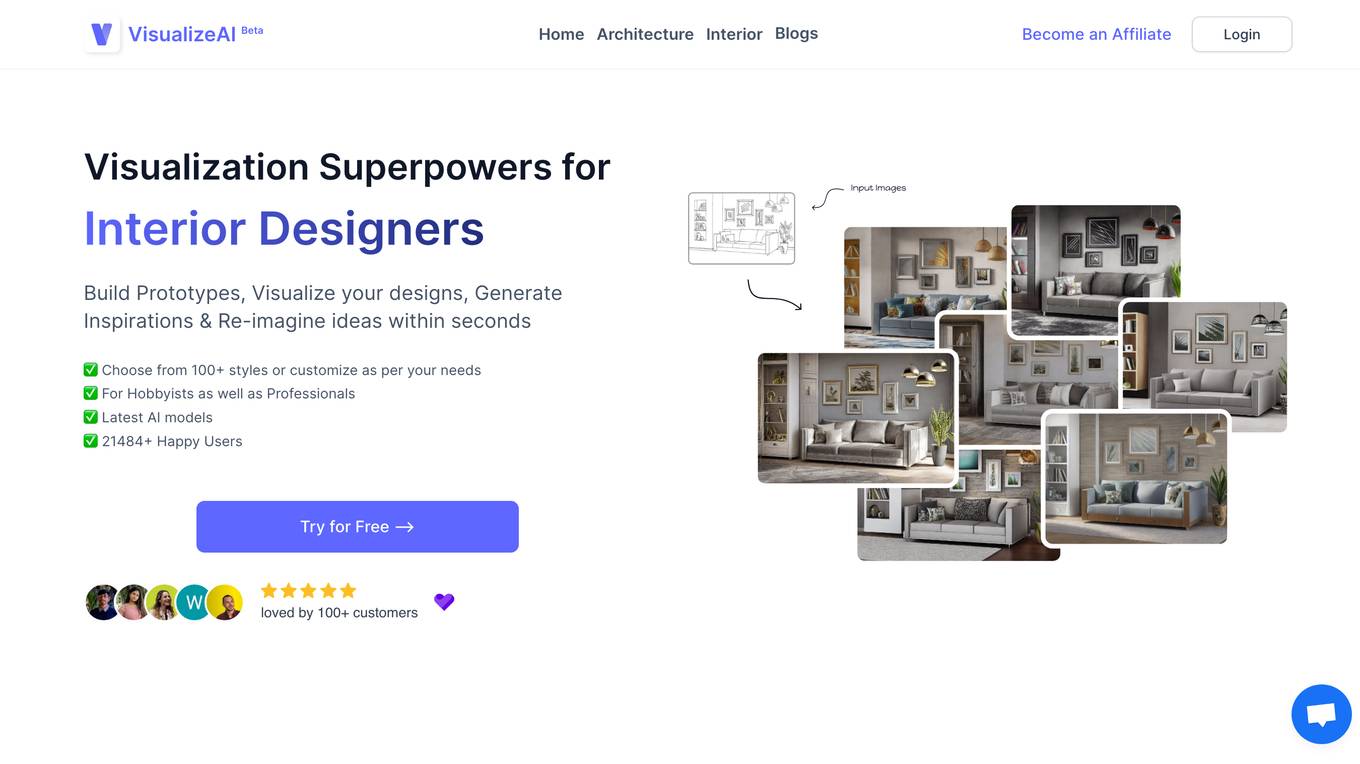
VisualizeAI
VisualizeAI is a powerful AI-powered platform that helps businesses visualize and analyze their data. With VisualizeAI, you can easily create stunning data visualizations, dashboards, and reports that will help you make better decisions. VisualizeAI is perfect for businesses of all sizes, from startups to large enterprises. It is easy to use and affordable, and it can help you save time and money while improving your decision-making.
DevRev
DevRev is an AI-native modern support platform that offers a comprehensive solution for customer experience enhancement. It provides data engineering, knowledge graph, and customizable LLMs to streamline support, product management, and software development processes. With features like in-browser analytics, consumer-grade social collaboration, and global scale API calls, DevRev aims to bring together different silos within a company to drive efficiency and collaboration. The platform caters to support people, product managers, and developers, automating tasks, assisting in decision-making, and elevating collaboration levels. DevRev is designed to empower digital product teams to assimilate customer feedback in real-time, ultimately powering the next generation of technology companies.
Wizdom.ai
Wizdom.ai is an AI-powered research intelligence platform that provides comprehensive insights into the global research ecosystem. It continuously monitors billions of data points to generate analytics about scientific developments, helping users make informed decisions and progress research further and faster. Wizdom.ai offers a range of features, including:
Quanty
Quanty is an AI-driven financial knowledge graph application that provides market insights on crypto and stocks news through advanced algorithms and knowledge graphs. It offers a GraphQL API for deep market understanding, smart data classification, current market insights, entity and relationship extraction, and dynamic GraphQL access. Users can access a wide range of financial news, insights, and analytics seamlessly through Quanty's robust GraphQL API.

xAI Grok
xAI Grok is a visual analytics platform that helps users understand and interpret machine learning models. It provides a variety of tools for visualizing and exploring model data, including interactive charts, graphs, and tables. xAI Grok also includes a library of pre-built visualizations that can be used to quickly get started with model analysis.

Electe
Electe is an AI-powered platform that empowers businesses to leverage the potential of artificial intelligence for data analysis and insights. With its intuitive interface and advanced AI algorithms, Electe enables users to extract valuable insights from their data, visualize data through intuitive graphs and customizable dashboards, generate personalized notes based on customer order analysis, monitor and compare competitor performance, and automate data extraction and classification using machine learning techniques. The platform also offers features like Q&A Document interaction, advanced presentations generation, daily email reports, and mobile app access. Electe is designed to cater to businesses of all sizes, providing scalable plans with essential functionalities, advanced analysis tools, and premium support.
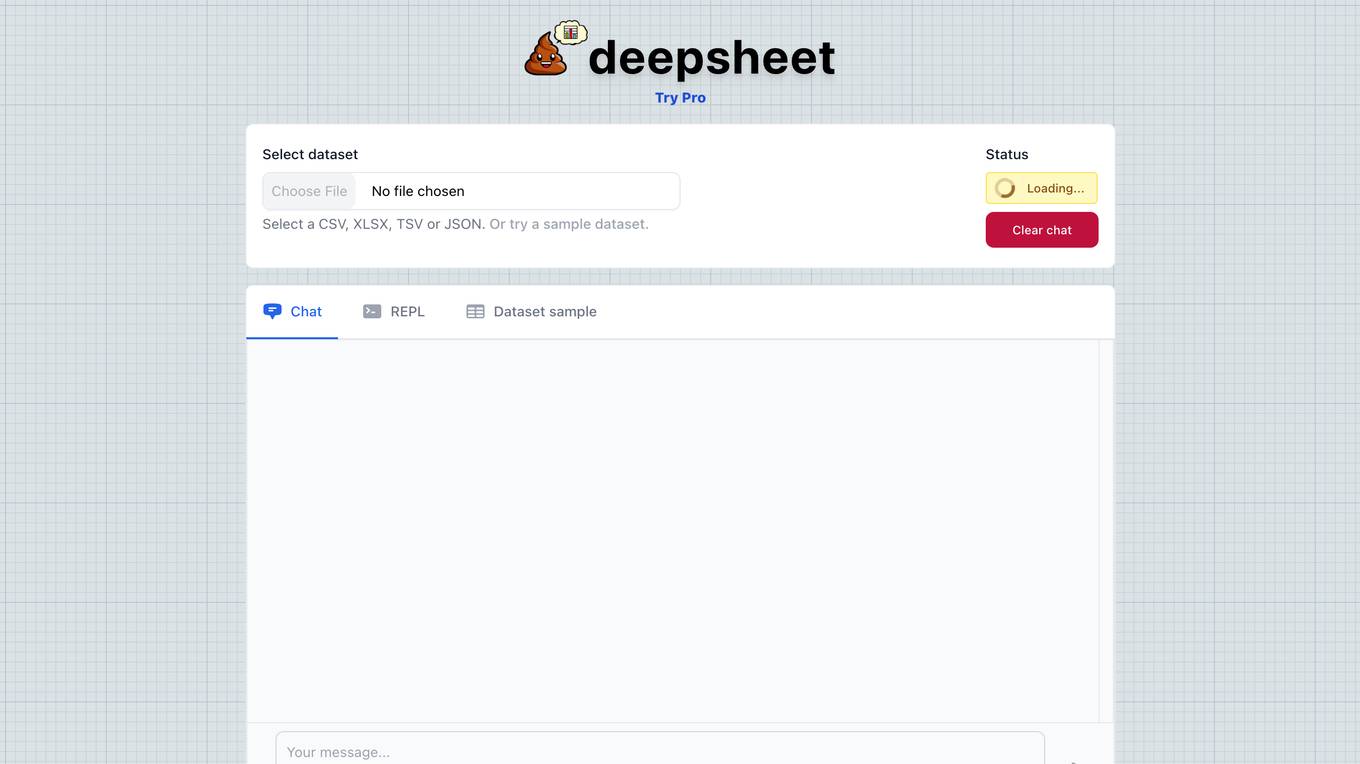
Deepsheet
Deepsheet is a cloud-based spreadsheet application that uses artificial intelligence to help users analyze and visualize data. It offers a variety of features, including the ability to import data from a variety of sources, create charts and graphs, and perform data analysis. Deepsheet is designed to be easy to use, even for users with no prior experience with spreadsheets.
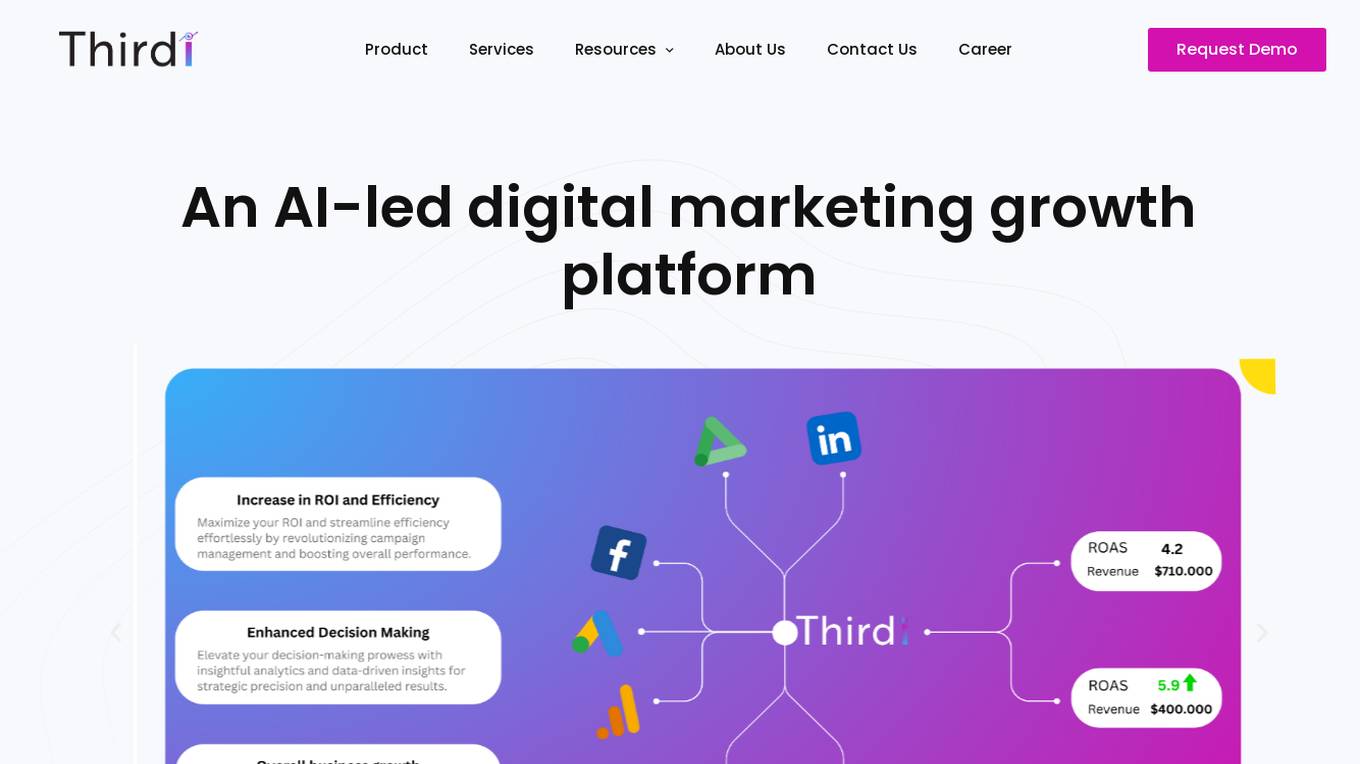
ThirdI
ThirdI is an AI-led digital marketing growth platform that simplifies marketing campaigns, realizes ROI, and saves man hours by generating meaningful insights and impactful recommendations. The platform offers maximum insights with minimal distracting graphs, AI-led recommendations, and instant impact reports for quick actions. ThirdI excels at solving business problems with full-funnel understanding, marketing automation for efficiency, and improved visibility into marketing spend. The platform stands out with features like deep data analysis, simplified marketing campaigns, and enhanced decision-making capabilities.
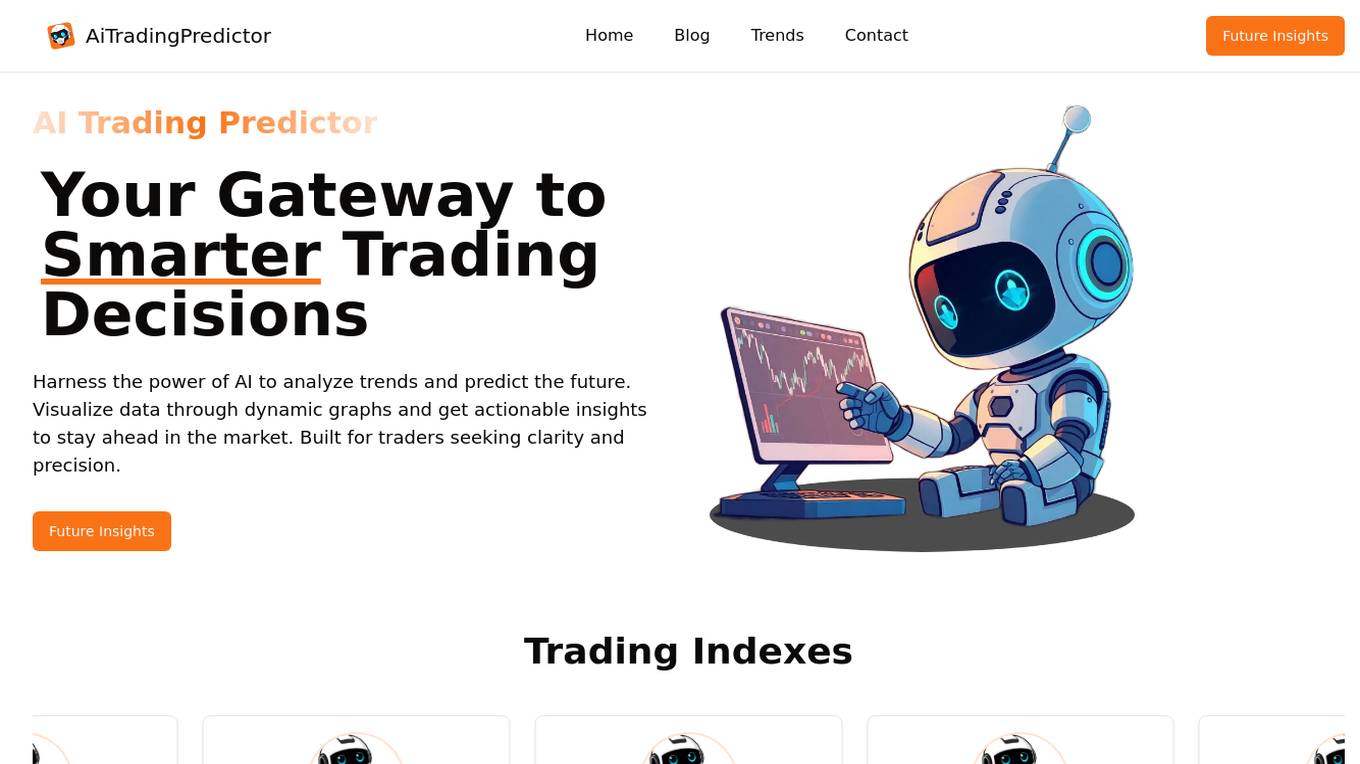
AiTradingPredictor
AiTradingPredictor is an AI-powered platform designed to assist traders in making smarter trading decisions by harnessing the power of AI to analyze trends and predict the future. The platform allows users to visualize data through dynamic graphs, providing actionable insights to stay ahead in the market. It is built for traders seeking clarity and precision, offering predictions for various asset classes such as stocks, cryptocurrencies, and commodities across different time frames.
pl.aiwright
pl.aiwright is an AI-powered dialogue generation tool designed for interactive narratives. It offers features such as analyzing and clustering large dialogue graphs, dialogue generation using a mix of code and natural language, playtests for gathering user feedback, and tools for experimental analysis. The tool enables users to create engaging dialogues for various applications, such as games, virtual simulations, and interactive storytelling.
4 - Open Source AI Tools
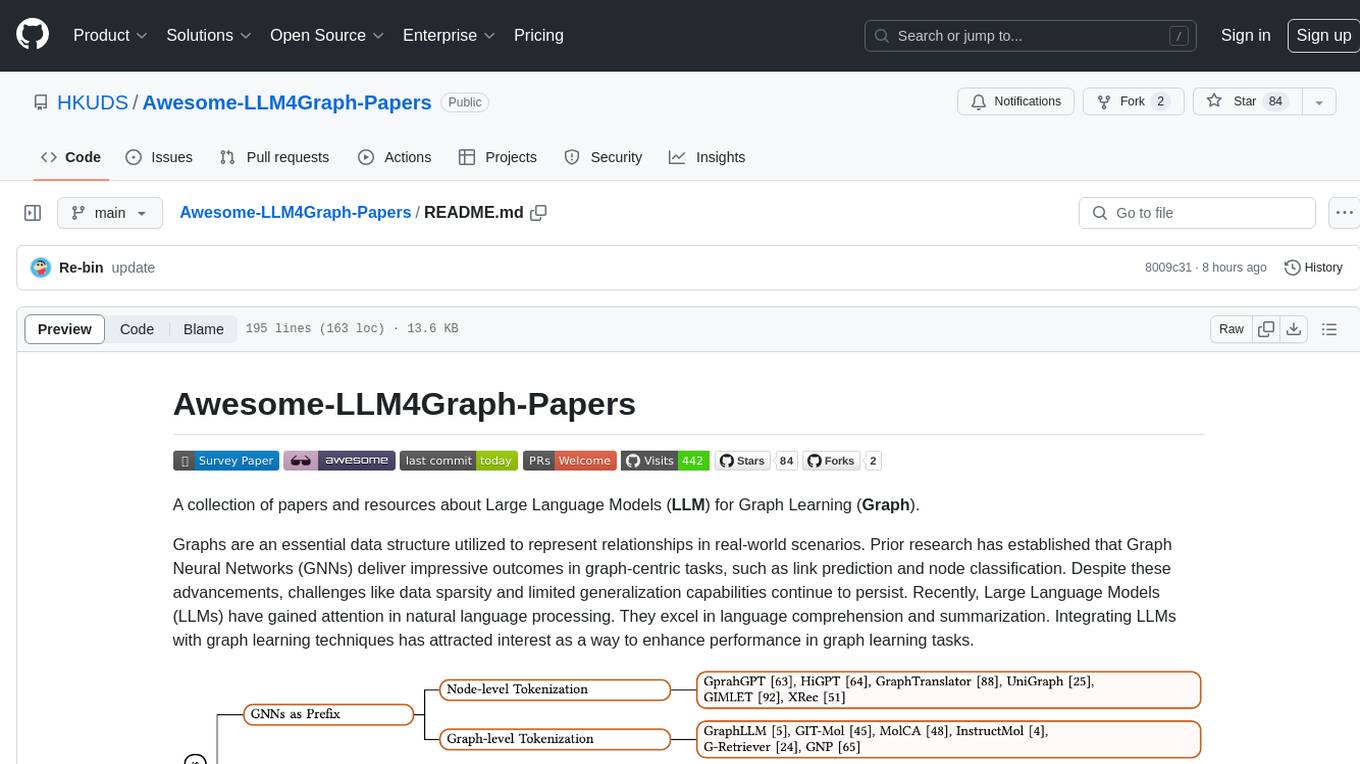
Awesome-LLM4Graph-Papers
A collection of papers and resources about Large Language Models (LLM) for Graph Learning (Graph). Integrating LLMs with graph learning techniques to enhance performance in graph learning tasks. Categorizes approaches based on four primary paradigms and nine secondary-level categories. Valuable for research or practice in self-supervised learning for recommendation systems.
Graph-CoT
This repository contains the source code and datasets for Graph Chain-of-Thought: Augmenting Large Language Models by Reasoning on Graphs accepted to ACL 2024. It proposes a framework called Graph Chain-of-thought (Graph-CoT) to enable Language Models to traverse graphs step-by-step for reasoning, interaction, and execution. The motivation is to alleviate hallucination issues in Language Models by augmenting them with structured knowledge sources represented as graphs.
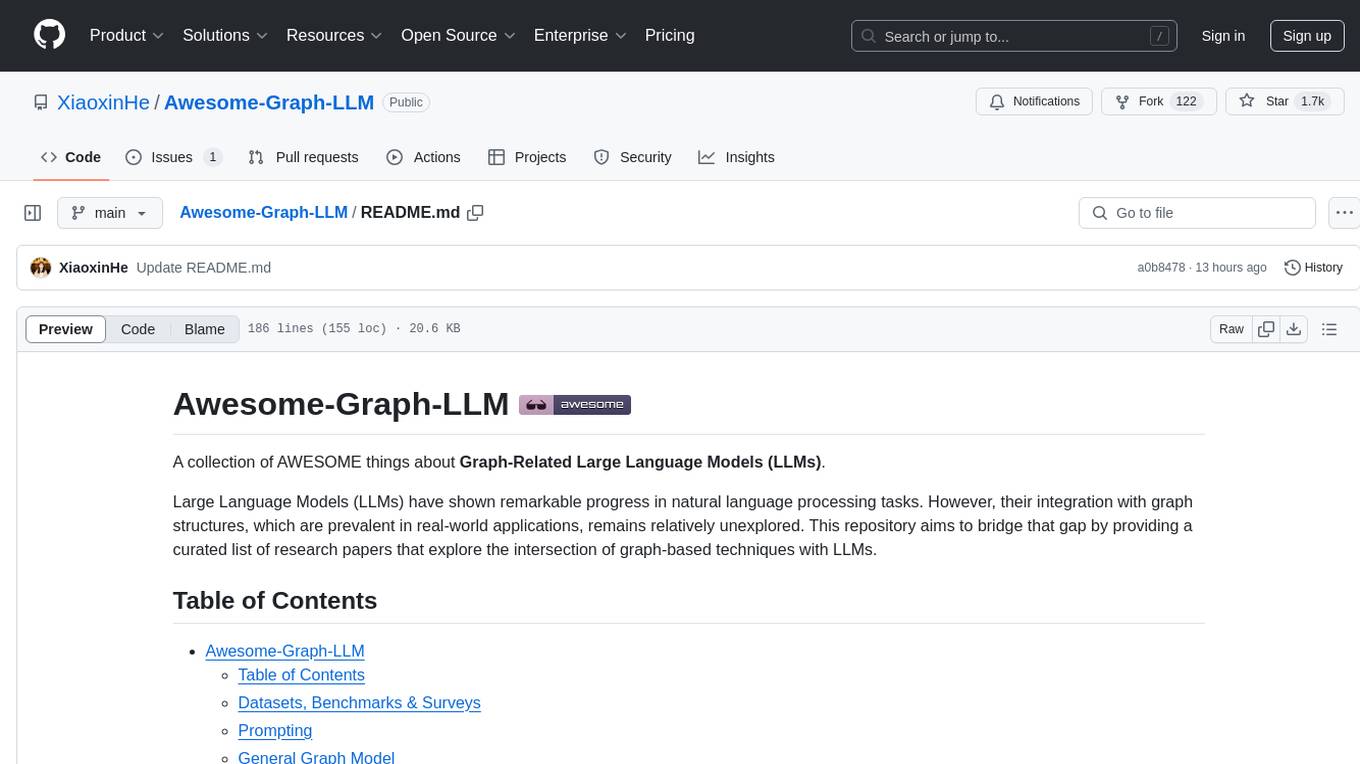
Awesome-Graph-LLM
Awesome-Graph-LLM is a curated collection of research papers exploring the intersection of graph-based techniques with Large Language Models (LLMs). The repository aims to bridge the gap between LLMs and graph structures prevalent in real-world applications by providing a comprehensive list of papers covering various aspects of graph reasoning, node classification, graph classification/regression, knowledge graphs, multimodal models, applications, and tools. It serves as a valuable resource for researchers and practitioners interested in leveraging LLMs for graph-related tasks.
all-in-rag
All-in-RAG is a comprehensive repository for all things related to Randomized Algorithms and Graphs. It provides a wide range of resources, including implementations of various randomized algorithms, graph data structures, and visualization tools. The repository aims to serve as a one-stop solution for researchers, students, and enthusiasts interested in exploring the intersection of randomized algorithms and graph theory. Whether you are looking to study theoretical concepts, implement algorithms in practice, or visualize graph structures, All-in-RAG has got you covered.
20 - OpenAI Gpts
EconoGraph
Expert in Micro Economics, interprets graphs, explains concepts, avoids direct exam answers.
DGL coding assistant
Assists with DGL coding, focusing on edge classification and link prediction.
News Bias Analyzer
Fetch and Analyze the Latest News! 📊💡 Get unbiased summaries, detailed bias graphs, and engaging word clouds. Dive into the world of news with a fresh perspective! 🌍📰 Our upgraded News Bias Analyzer GPT is your go-to for insightful analysis of the latest headlines and in-depth articles.

Projeto BRAPEL Digital
Faça perguntas, analise dados e crie gráficos da história dos jogos do clássico BRAPEL (Grêmio Esportivo Brasil e Esporte Clube Pelotas)
YELL-O! - My Pee Frequently Analyst
Ask: "What graphs can you create from MY pee times data file (.xlsx)?" Show to your Urologist.
Graphene Explorer AI
Leading AI in graphene research, offering innovative insights and solutions, powered by OpenAI.
Art Engineer
Analyze and reverse engineer images. Receive style descriptions and image re-creation prompts.
Good Design Advisor
As a Good Design Advisor, I provide consultation and advice on design topics and analyze designs that are provided through documents or links. I can also generate visual representations myself to illustrate design concepts.

DirectX 12 Graphics Programming Helper
Helps beginners understand DirectX 12 concepts and terminology