ChartPixel
Visualize your data in 30 seconds
Description:
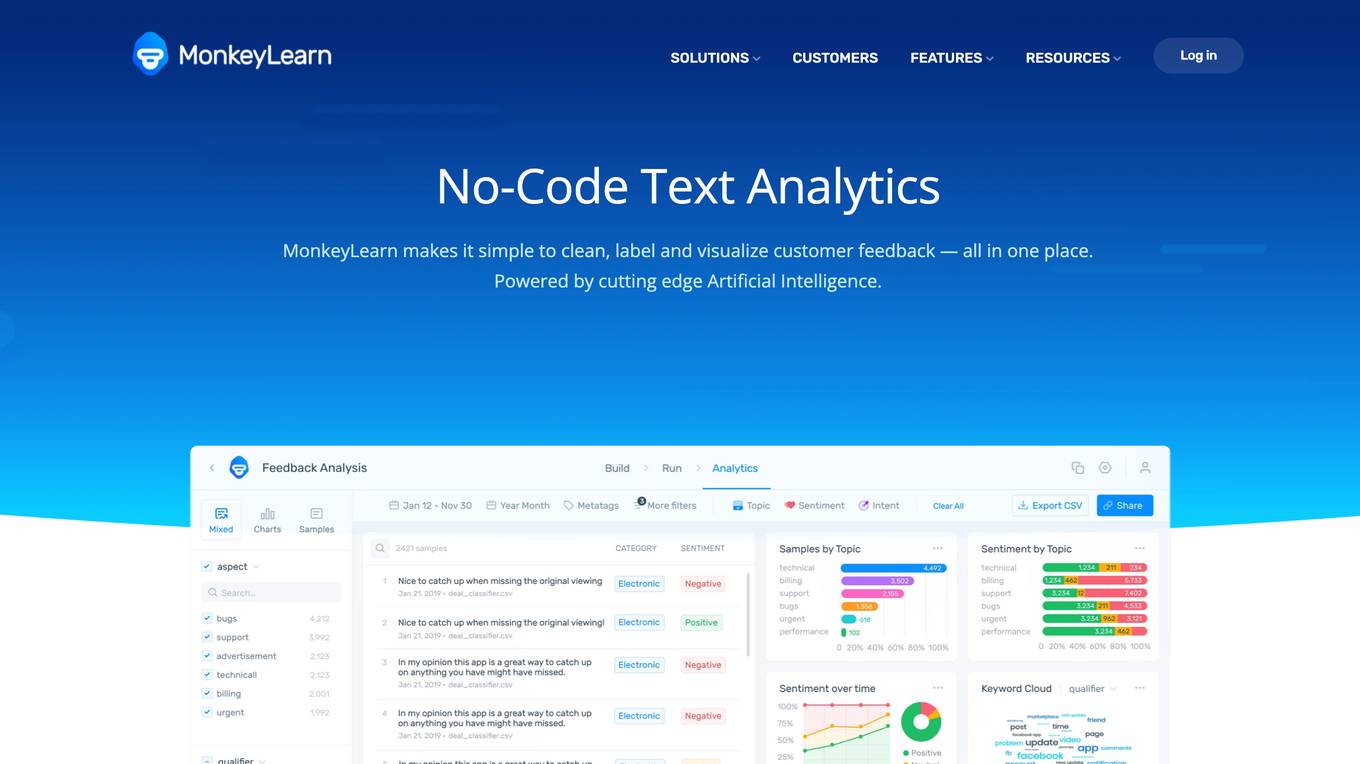
ChartPixel is an AI-powered data analysis tool that helps users visualize and understand their data in seconds. With ChartPixel, you can upload your data file or questionnaire and let the AI auto-generate a gallery of charts with insightfully written AI-assisted annotations and statistics. This makes it easy to explore the quirks and patterns in your data, even if you're a data novice. ChartPixel also offers a variety of features to help you save time and effort, such as data cleaning, formatting charts, extracting trends and insights, and presenting and collaborating. With ChartPixel, you can get data-driven insights in seconds, without the need for steep learning curve.
For Tasks:
For Jobs:
Features
- AI-assisted charts & actionable insights
- Auto-selects the most relevant columns and chart types
- Cleans messy data
- Engineers interesting new features
- Guides you through the data analysis process
- Keyword search tool that finds and transforms web data into beautiful charts
- Exports charts and insights in one click into PowerPoint for a ready-made presentation
- Shares your charts or publishes your entire project through a link
Advantages
- Saves time and effort
- Makes data analysis accessible to everyone, regardless of skill level
- Provides AI-assisted insights and descriptions, backed up by statistics
- Offers a variety of chart types and visualizations
- Can be used for a variety of tasks, from data exploration to presentations
Disadvantages
- May not be as powerful as some more complex data analysis tools
- Can be expensive for some users
- May not be suitable for all types of data
Frequently Asked Questions
-
Q:What is ChartPixel?
A:ChartPixel is an AI-powered data analysis tool that helps users visualize and understand their data in seconds. -
Q:How does ChartPixel work?
A:ChartPixel uses AI to auto-generate a gallery of charts with insightfully written AI-assisted annotations and statistics. This makes it easy to explore the quirks and patterns in your data, even if you're a data novice. -
Q:What are the benefits of using ChartPixel?
A:ChartPixel can save you time and effort, make data analysis accessible to everyone, regardless of skill level, provide AI-assisted insights and descriptions, backed up by statistics, offer a variety of chart types and visualizations, and can be used for a variety of tasks, from data exploration to presentations. -
Q:How much does ChartPixel cost?
A:ChartPixel offers a free beta version, as well as a paid subscription. -
Q:Is ChartPixel right for me?
A:ChartPixel is a great option for anyone who wants to save time and effort on data analysis, or who wants to make data analysis more accessible. It is also a good option for anyone who wants to get AI-assisted insights and descriptions of their data.
Alternative AI tools for ChartPixel
Similar sites
Owlbot
Get instant answers for you, your customers, or your team with your own AI powered chatbots
