Graphy
The fastest way to visualize and share your data
Description:
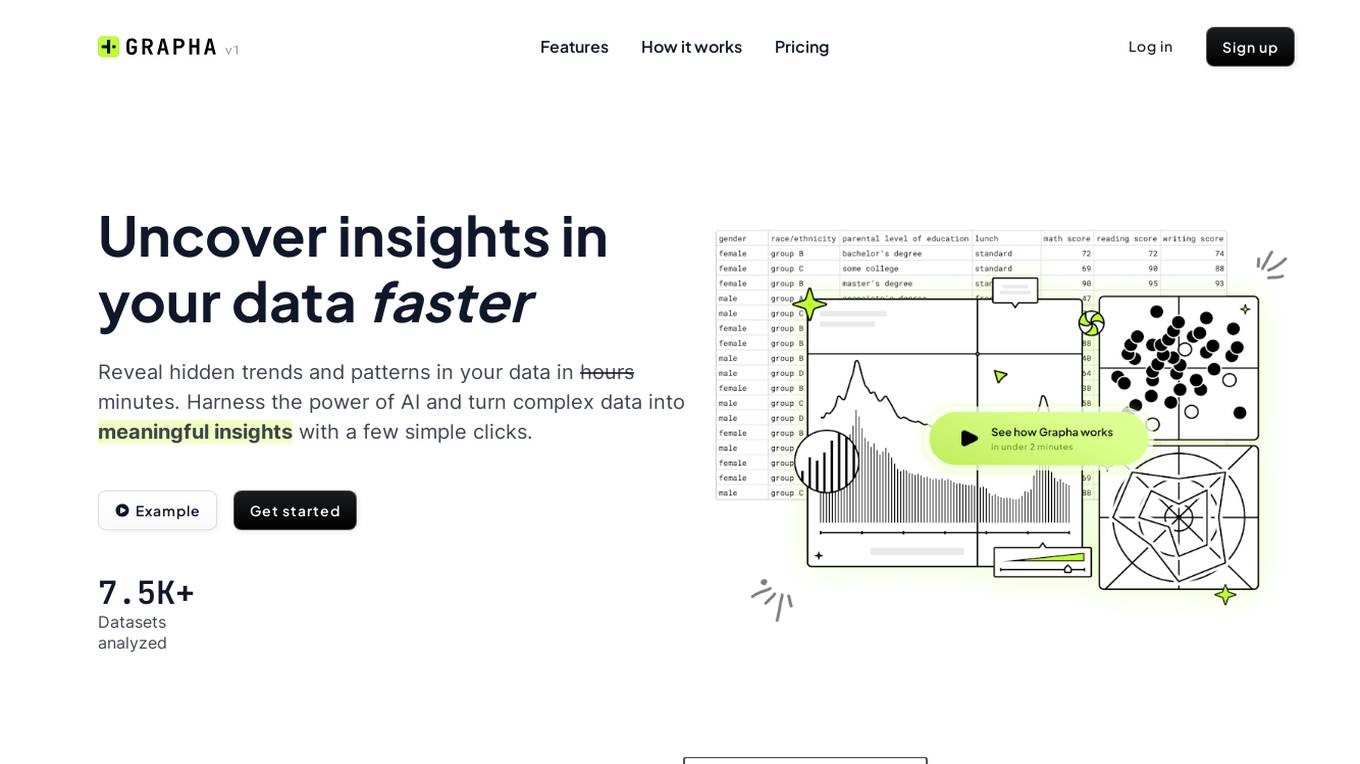
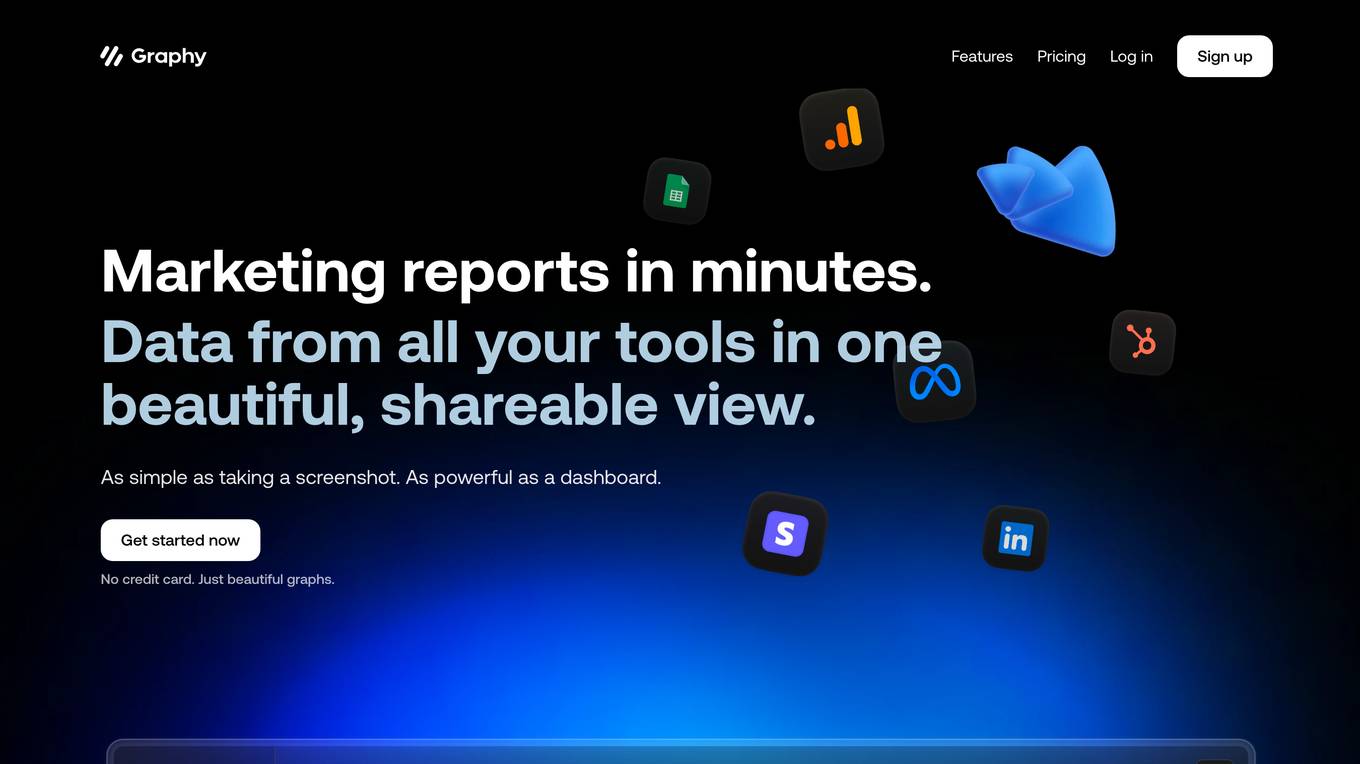
Graphy is a data visualization and reporting tool that helps marketers create beautiful, interactive reports in minutes. It is powered by AI to increase productivity and make data more accessible and understandable. With Graphy, you can unify your data from all your tools into a single, shareable view. You can also explore data in the tools you've already mastered, then save it in Graphy to tell your data story with AI Insights, comments, annotations, goals, trend lines, and even emojis.
For Tasks:
For Jobs:
Features
- One-click to import data from Hubspot, Google Analytics, Google Search Console, LinkedIn Ads, Meta Ads, Google Sheets, and more into a single, interactive view.
- No complex integrations, no data analysts, no learning curve, just magic.
- Explore data in the tools you've already mastered, then save it in Graphy to tell your data story with AI Insights, comments, annotations, goals, trend lines, and even emojis.
- Share interactive boards via email, Slack or Teams, embed in Notion, Canva or Tome, or drop consistent, high-quality images into Slides or PowerPoint.
- Create beautiful, interactive graphs and boards, instantly. One click to get your data in. One click to share with your audience.
Advantages
- Save time creating reports by 80%.
- Create stunning charts from disparate sources with the context and commentary your stakeholders need to better understand the numbers.
- Wow your stakeholders with beautiful, interactive reports.
- Empower teammates, managers and even external clients with access to siloed data.
- Make your data shine with stunning interactive boards that will wow your audience.
Disadvantages
- May not be suitable for very large or complex datasets.
- Can be expensive for some users.
- May require some training to use effectively.
Frequently Asked Questions
-
Q:What is Graphy?
A:Graphy is a data visualization and reporting tool that helps marketers create beautiful, interactive reports in minutes. -
Q:How does Graphy work?
A:Graphy imports data from all your tools into a single, interactive view. You can then explore data, add AI Insights, comments, annotations, goals, trend lines, and even emojis to tell your data story. -
Q:What are the benefits of using Graphy?
A:Graphy can save you time creating reports, help you create stunning charts from disparate sources, wow your stakeholders with beautiful, interactive reports, empower teammates, managers and even external clients with access to siloed data, and make your data shine with stunning interactive boards that will wow your audience. -
Q:How much does Graphy cost?
A:Graphy offers a free plan and paid plans starting at $12 per month. -
Q:Is Graphy easy to use?
A:Yes, Graphy is designed to be easy to use, with a simple and intuitive interface.
Alternative AI tools for Graphy
For similar tasks
Polymath Robotics
Effortlessly add autonomous navigation to any industrial vehicle, so you can focus on what makes your customers tick.
Shakespeare
Your Ai marketing co-pilot, working 24 hours a day, 7 days a week. It's not human - it's better.
