Best AI tools for< Visualize Business Proposals And Product Introductions >
20 - AI tool Sites
Breadcrumb.ai
Breadcrumb.ai is an AI data analytics platform that enables users to combine, analyze, and chat with their files using AI data analytic agents. The platform is designed to be intuitive, eliminating the need for coding or data expertise. Breadcrumb's AI agents integrate and clean data, allowing users to ask questions in plain language and generate dashboards effortlessly. The tool provides a visual analytic canvas for exploring data, facilitating communication and collaboration across teams in real-time. With Breadcrumb, users can streamline operations, accelerate sales, and drive marketing decisions with evidence-based insights.
Beebzi.AI
Beebzi.AI is an all-in-one AI content creation platform that offers a wide array of tools for generating various types of content such as articles, blogs, emails, images, voiceovers, and more. The platform utilizes advanced AI technology and behavioral science to empower businesses and individuals in their marketing and sales endeavors. With features like AI Article Wizard, AI Room Designer, AI Landing Page Generator, and AI Code Generation, Beebzi.AI revolutionizes content creation by providing customizable templates, multiple language support, and real-time data insights. The platform also offers various subscription plans tailored for individual entrepreneurs, teams, and businesses, with flexible pricing models based on word count allocations. Beebzi.AI aims to streamline content creation processes, enhance productivity, and drive organic traffic through SEO-optimized content.
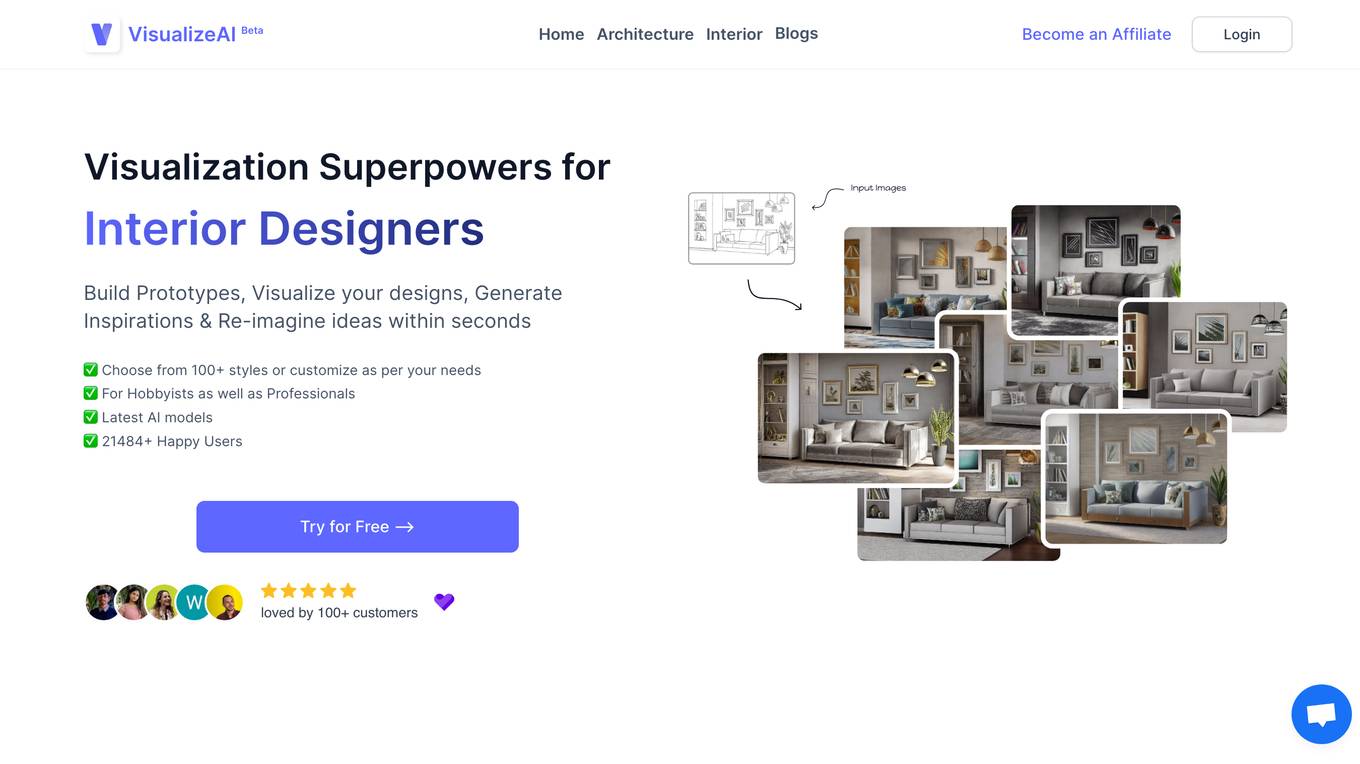
VisualizeAI
VisualizeAI is a powerful AI-powered platform that helps businesses visualize and analyze their data. With VisualizeAI, you can easily create stunning data visualizations, dashboards, and reports that will help you make better decisions. VisualizeAI is perfect for businesses of all sizes, from startups to large enterprises. It is easy to use and affordable, and it can help you save time and money while improving your decision-making.
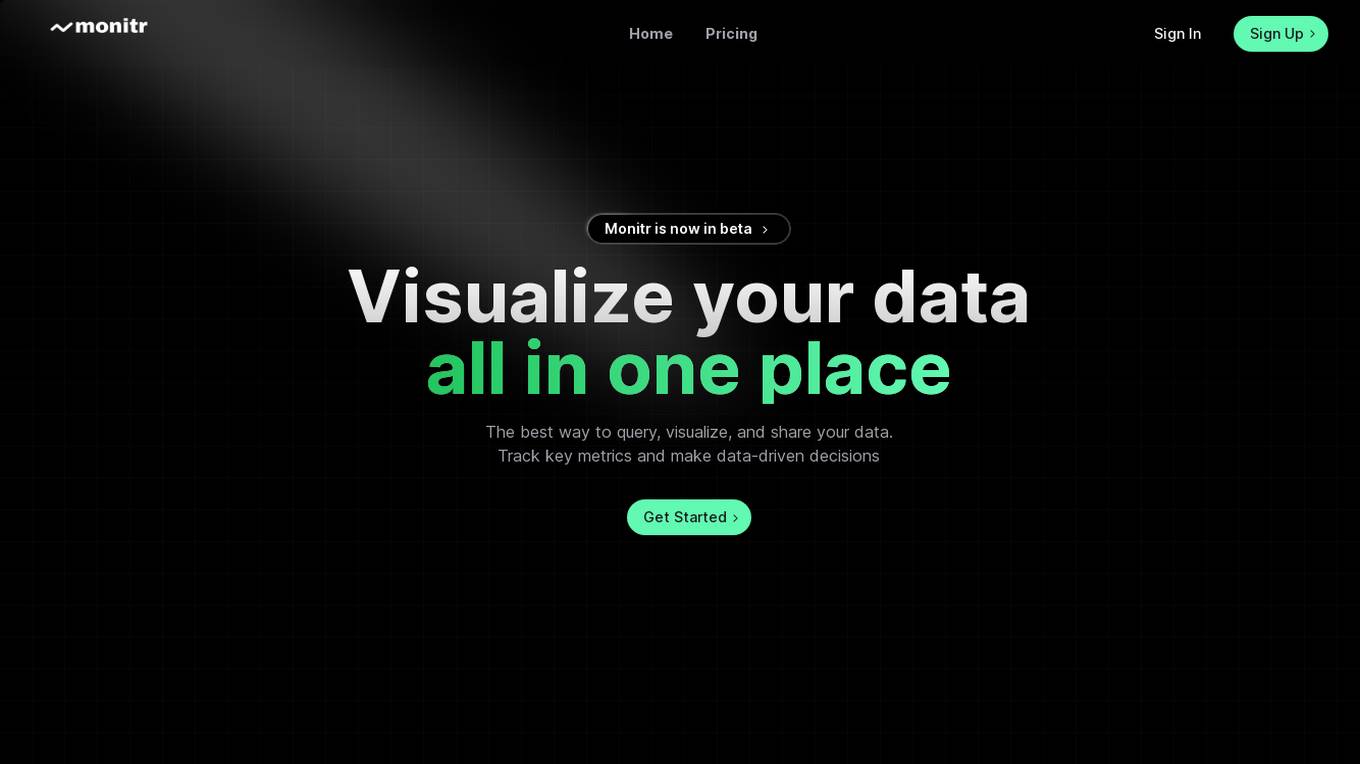
Monitr
Monitr is a data visualization and analytics platform that allows users to query, visualize, and share data in one place. It helps in tracking key metrics, making data-driven decisions, and breaking down data silos to provide a unified view of data from various sources. Users can create charts and dashboards, connect to different data sources like Postgresql and MySQL, and collaborate with teammates on SQL queries. Monitr's AI features are powered by Meta AI's Llama 3 LLM, enabling the development of powerful and flexible analytics tools for maximizing data utilization.
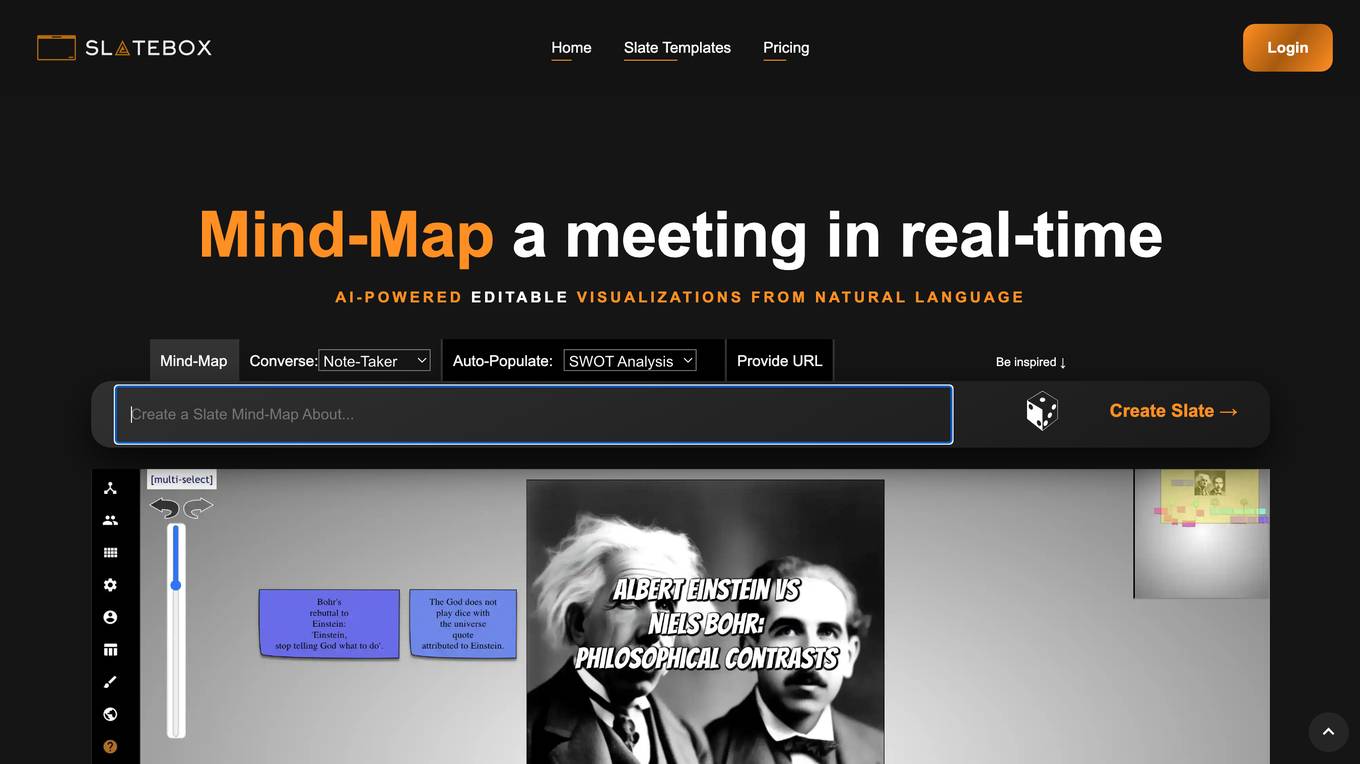
Slatebox
Slatebox is an AI-powered visualization platform that allows users to create editable visualizations from natural language. With Slatebox, users can create mind maps, flowcharts, diagrams, and more, simply by providing a text prompt or URL. Slatebox also offers a variety of templates and features to help users get started, including real-time collaboration, auto-population, and API integration.
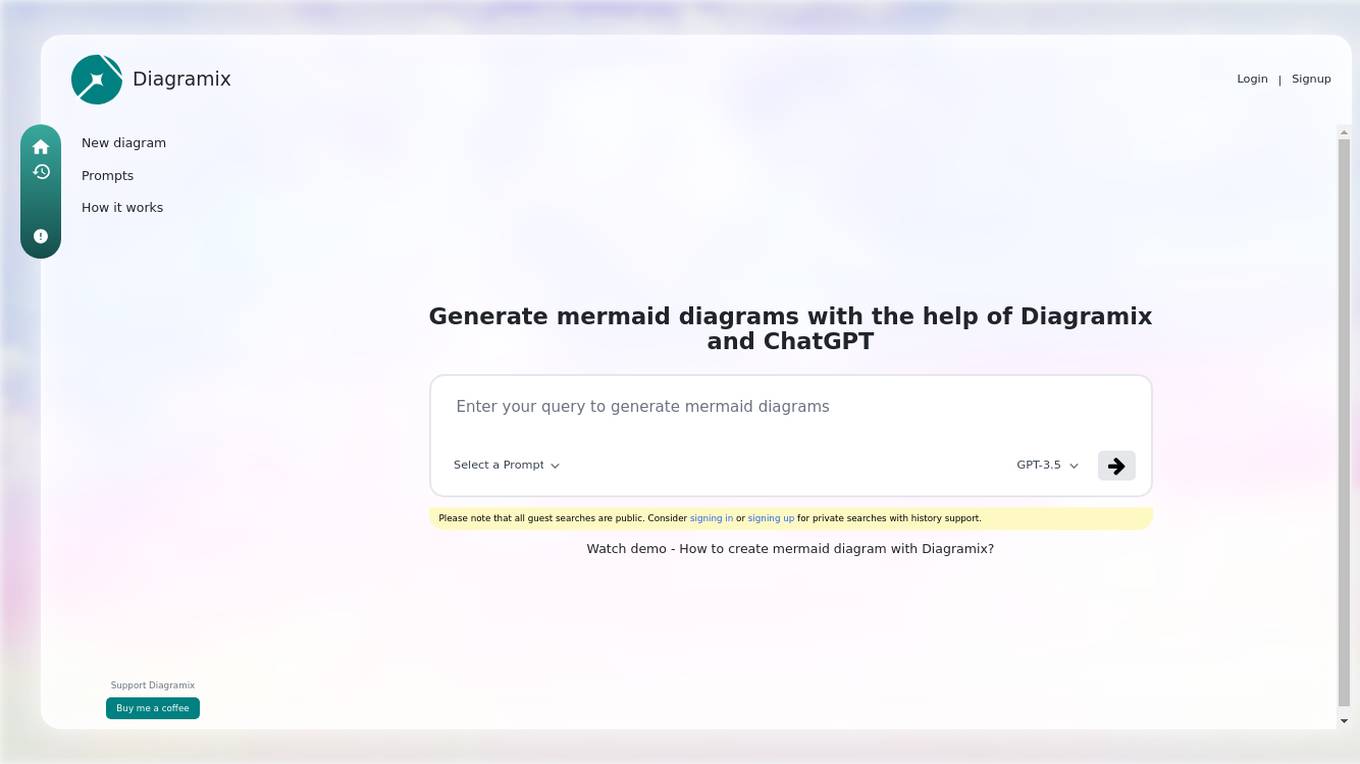
Diagramix
Diagramix is an AI-powered tool that allows users to generate various types of diagrams, such as sequence diagrams, flowcharts, state diagrams, ER diagrams, user journey diagrams, class diagrams, mind maps, and use case diagrams. Users can create these diagrams easily and efficiently with the help of Diagramix and ChatGPT. The tool provides a user-friendly interface for creating visual representations of complex systems and processes, making it ideal for professionals, students, and anyone who needs to visualize information.
Graphy
Graphy is a data visualization and reporting tool that helps marketers create beautiful, interactive reports in minutes. It is powered by AI to increase productivity and make data more accessible and understandable. With Graphy, you can unify your data from all your tools into a single, shareable view. You can also explore data in the tools you've already mastered, then save it in Graphy to tell your data story with AI Insights, comments, annotations, goals, trend lines, and even emojis.
Vizio AI
Vizio AI is an advanced data analytics and automation services provider that empowers businesses with real-time data and AI insights. They offer services such as data app development, automated reporting, RPA bot development, dashboard development, and generative AI. Vizio AI collaborates with clients to connect and visualize data from various sources, automate tasks, and make AI-powered decisions with ease. Their expert data engineers and analysts work on data app development, dashboard creation, and RPA bot development to streamline business operations and enhance decision-making processes.

DealGraph
DealGraph is an AI-powered platform that helps users explore business networks by leveraging hidden relationships among organizations. By analyzing unstructured texts and images, DealGraph provides Relationship Intelligence, allowing users to gain instant knowledge of connections their prospects, customers, or competitors have with other organizations. The platform offers Relationship Alerts to notify users of new relationships, enabling them to uncover crucial insights and opportunities without the need for extensive research. DealGraph also features a Relationship Graph that visualizes organization networks through interactive graphs, answering key questions about market dynamics, customer relationships, industry trends, and supply chain structures. It caters to various users, including sales teams for prospecting, investors for company research, and corporate development teams for market overviews.
Ajelix BI
Ajelix BI is a powerful yet easy-to-use data visualization platform that helps small business owners and non-technical teams create professional-looking reports with a dash of AI data analytics. With Ajelix BI, you can upload your spreadsheet files and create dashboards to share with colleagues, without the need for complex setups or database integrations. Ajelix BI also offers a suite of AI-powered tools for Excel, including an Excel formula generator, VBA & Google Apps code creator, Excel template builder, file translator, and Excel & Google Sheets add-on. These tools can help you automate tasks, improve productivity, and gain insights from your data.

ShiftX
ShiftX is a collaborative business process tool designed to help organizations optimize operations, ensure compliance, and increase customer satisfaction. It offers a range of features to help users manage processes, including the ability to create visual process maps, assign roles and tasks, and collaborate with colleagues. ShiftX is also committed to security and reliability, with features such as GDPR compliance, encrypted connections, and SAML single sign-on.
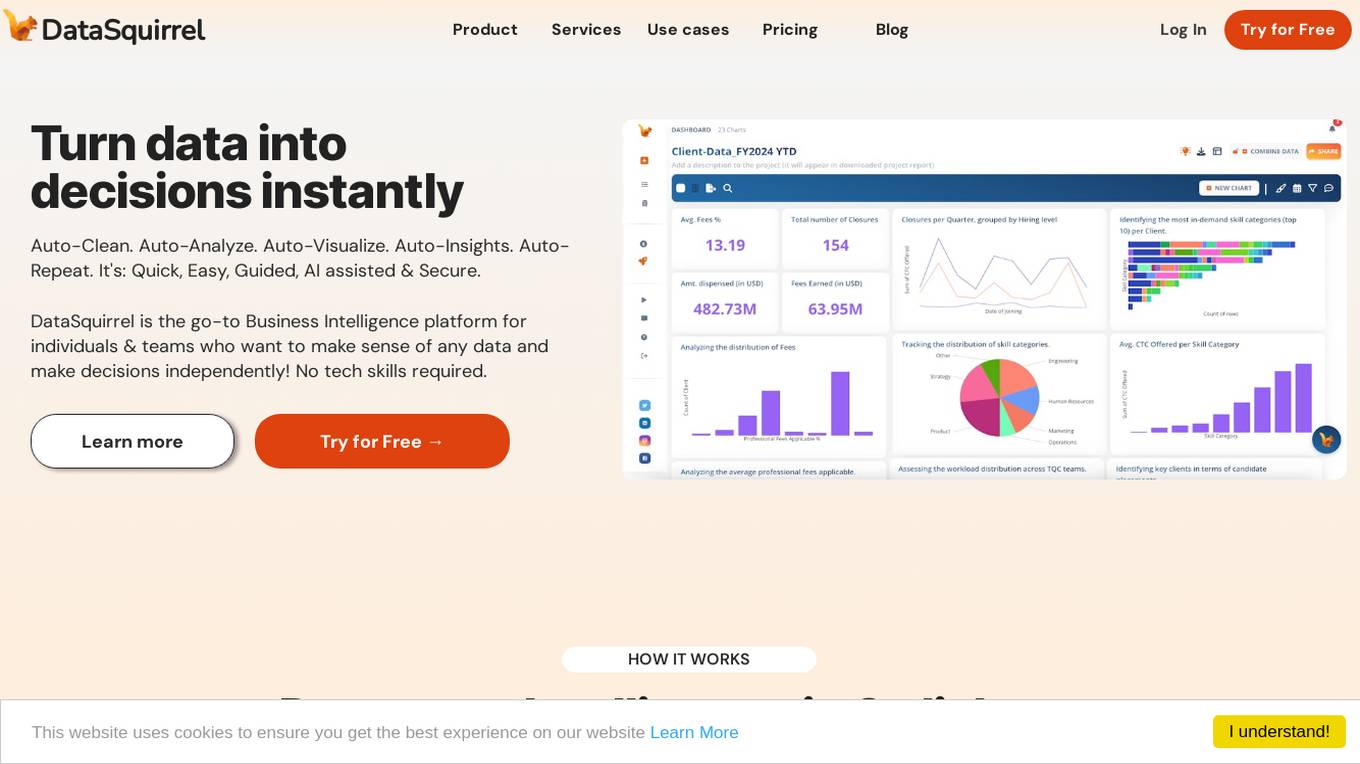
DataSquirrel.ai
DataSquirrel.ai is an AI tool designed to provide data intelligence solutions for non-technical business managers. It offers both guided and fully automatic features to help users make data-driven decisions and optimize business performance. The tool simplifies complex data analysis processes and empowers users to extract valuable insights from their data without requiring advanced technical skills.
Sertis
Sertis is a leading AI solutions provider in Thailand, offering a comprehensive suite of end-to-end solutions encompassing AI, data analytics, data science, and data engineering. Their services include data analytics, predictive analytics, machine learning, data visualization, AI and data science consulting, and big data engineering. Sertis's mission is to help businesses unlock the full potential of their data and drive growth and innovation across multiple industries.
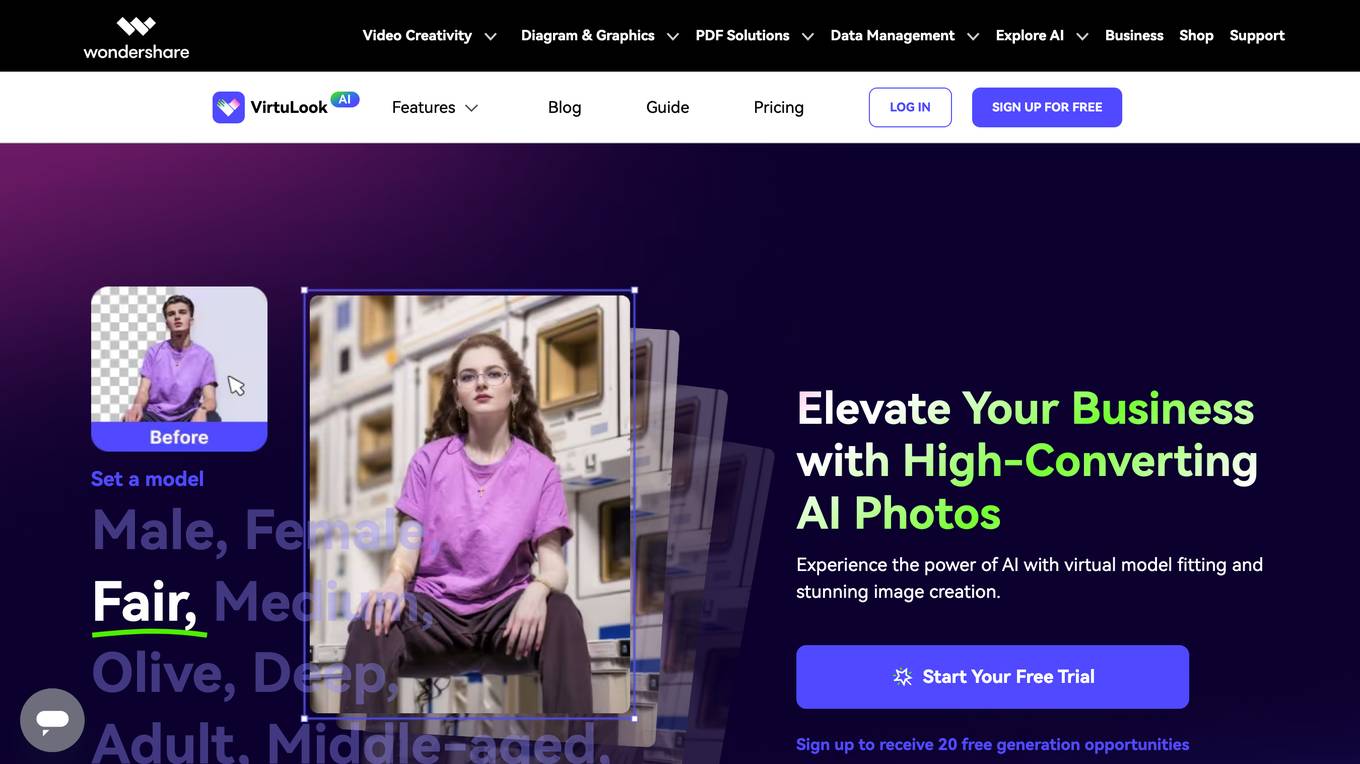
VirtuLook Product Photo Generator
VirtuLook Product Photo Generator is an AI-powered tool that revolutionizes product photography by generating high-quality images using cutting-edge AI algorithms. It offers features like fashion model generation, product background generation, and text-based photo generation. The tool helps businesses enhance their online presence, drive sales conversions, and reduce production costs by providing visually appealing product images. Users can easily create lifelike photos of virtual models, experiment with different looks, and visualize clothing creations without the need for physical prototypes or expensive photo shoots.
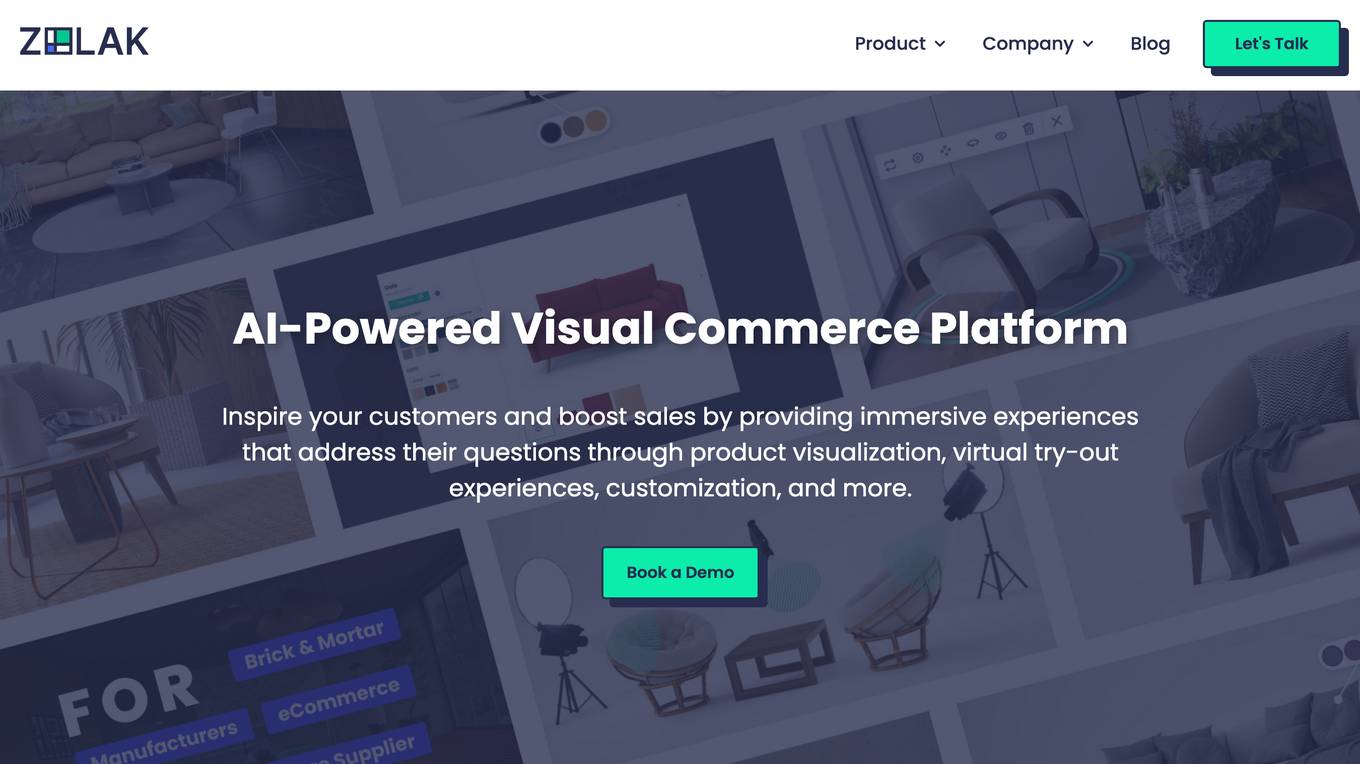
Zolak
Zolak is an AI-powered visual commerce platform designed for the furniture industry. It offers immersive experiences through product visualization, virtual try-out experiences, customization, and more. Zolak enables businesses to bridge physical and digital experiences, empowering e-commerce, manufacturing, and distribution sectors. The platform provides tools for creating high-quality visuals, personalized virtual showrooms, product customization, and AI room visualization, enhancing customer engagement and driving sales.
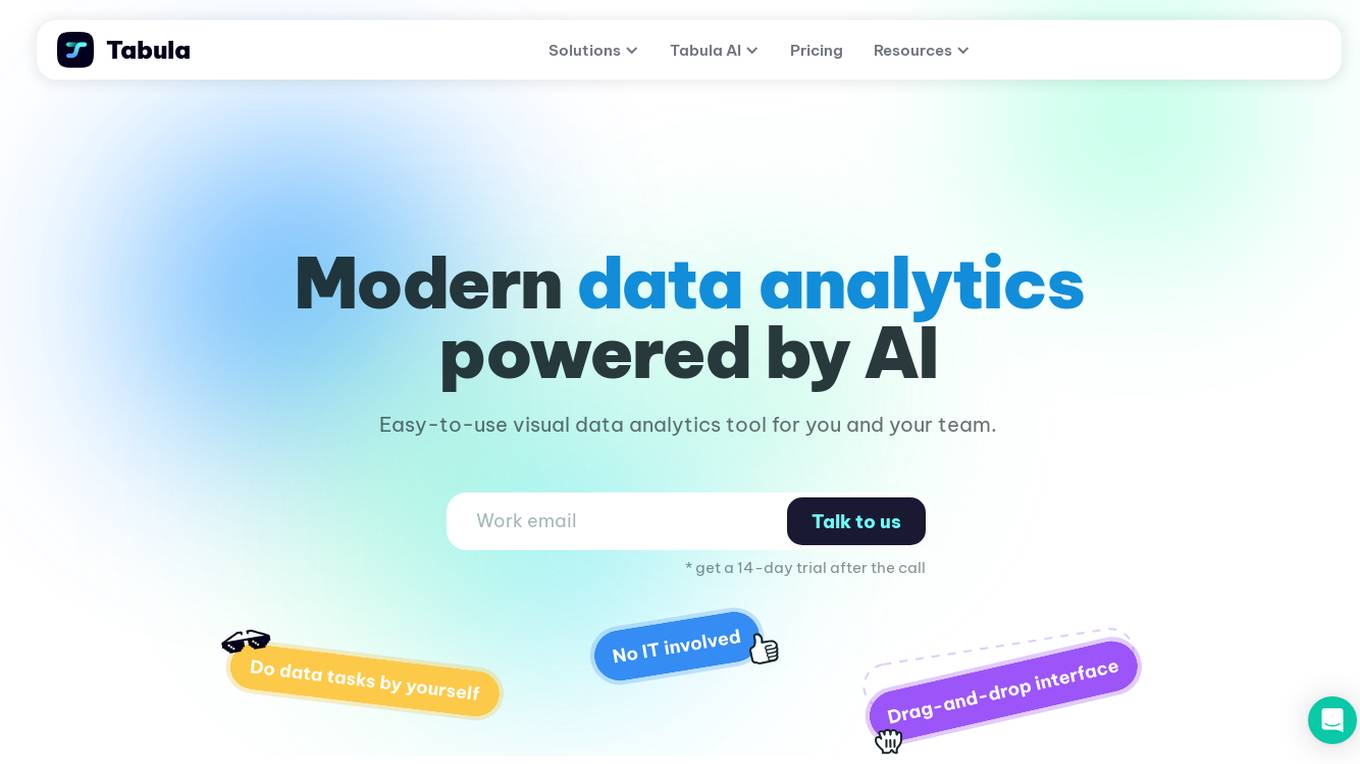
Tabula
Tabula is a visual data analytics tool that uses AI to help businesses get insights from their data. It is easy to use and can be used by anyone, regardless of their technical expertise. Tabula can be used to access and unify data from a variety of sources, standardize and blend datasets, add custom metrics, build stunning reports, and automate repetitive tasks. Tabula is integrated with a variety of data sources and platforms, making it easy to get started.
Infogram
Infogram is an AI-powered platform that enables users to create interactive data visualizations, infographics, reports, maps, charts, tables, slides, and dashboards effortlessly. With a wide range of features such as AI chart recommendations, interactive content, embeds, custom maps, data import, and advanced editing tools, Infogram empowers users to craft compelling visual stories. The platform also offers content engagement analytics, real-time collaboration, and a brand kit for consistent branding. Trusted by over 10 million users worldwide, Infogram is a go-to tool for individuals, teams, and organizations looking to transform data into engaging visuals.
HomeStage
HomeStage is an AI-powered virtual furnishing tool that allows users to instantly visualize how their space would look with different furniture and decor items. With just one click, users can transform their empty rooms into beautifully furnished spaces, helping them make informed decisions about interior design and furniture placement. HomeStage leverages advanced AI algorithms to accurately place virtual furniture in real-time, providing a realistic and immersive experience for users. Whether you're a homeowner, interior designer, or real estate agent, HomeStage is the perfect solution to bring your design ideas to life.
Vizly
Vizly is an AI-powered data analysis tool that empowers users to make the most of their data. It allows users to chat with their data, visualize insights, and perform complex analysis. Vizly supports various file formats like CSV, Excel, and JSON, making it versatile for different data sources. The tool is free to use for up to 10 messages per month and offers a student discount of 50%. Vizly is suitable for individuals, students, academics, and organizations looking to gain actionable insights from their data.
HEAVY.AI
HEAVY.AI is a cutting-edge analytics and location intelligence platform that empowers users to make time-sensitive, high-impact decisions over vast datasets. The platform offers Conversational Analytics, enabling users to ask questions about their data in natural language and view actionable visualizations instantly. With HeavyEco, the platform also supports emergency response efforts by streamlining the management of weather events. HEAVY.AI combines interactive visual analytics, hardware-accelerated SQL, and advanced analytics & data science framework to uncover hidden opportunities and risks within enterprise datasets.
1 - Open Source AI Tools
banana-slides
Banana-slides is a native AI-powered PPT generation application based on the nano banana pro model. It supports generating complete PPT presentations from ideas, outlines, and page descriptions. The app automatically extracts attachment charts, uploads any materials, and allows verbal modifications, aiming to truly 'Vibe PPT'. It lowers the threshold for creating PPTs, enabling everyone to quickly create visually appealing and professional presentations.
20 - OpenAI Gpts
Sheets Expert
Master the art of Google Sheets with an assistant who can do everything from answer questions about basic features, explain functions in an eloquent and succinct manner, simplify the most complex formulas into easy steps, and help you identify techniques to effectively visualize your data.

Data Analysis Report Creator
Creates full DOCX data analysis reports with integrated visualizations
Illuminous - The Data Exploration AI
Expert in data analysis, visualizations, and predictions.
Emmi Data Analysis and Visualizer
Expert in data analysis and visualization, offering clear explanations and guidance.
PowerBI GPT
A PowerBI Expert assisting with debugging, dashboard ideas, and PowerBI service guidance.
Vicky Vega
Generates Vega-Lite JSON code for Power BI visuals from data and descriptions.
Qlik Sense Inphinity Forms Writeback Extension
Get help with Qlik Sense Inphinity Forms Writeback Extension.
Time Tracker Visualizer (See Stats from Toggl)
I turn Toggl data into insightful visuals. Get your data from Settings (in Toggl Track) -> Data Export -> Export Time Entries. Ask for bonus analyses and plots :)