Graphy
The fastest way to visualize and share your data
Graphy is a data visualization and reporting tool that helps marketers create beautiful, interactive reports in minutes. It is powered by AI to increase productivity and make data more accessible and understandable. With Graphy, you can unify your data from all your tools into a single, shareable view. You can also explore data in the tools you've already mastered, then save it in Graphy to tell your data story with AI Insights, comments, annotations, goals, trend lines, and even emojis.
For Tasks:
Click tags to check more tools for each tasksFor Jobs:
Features
Advantages
Disadvantages
Frequently Asked Questions
Alternative AI tools for Graphy
Similar sites
Graphy
Graphy is a data visualization and reporting tool that helps marketers create beautiful, interactive reports in minutes. It is powered by AI to increase productivity and make data more accessible and understandable. With Graphy, you can unify your data from all your tools into a single, shareable view. You can also explore data in the tools you've already mastered, then save it in Graphy to tell your data story with AI Insights, comments, annotations, goals, trend lines, and even emojis.
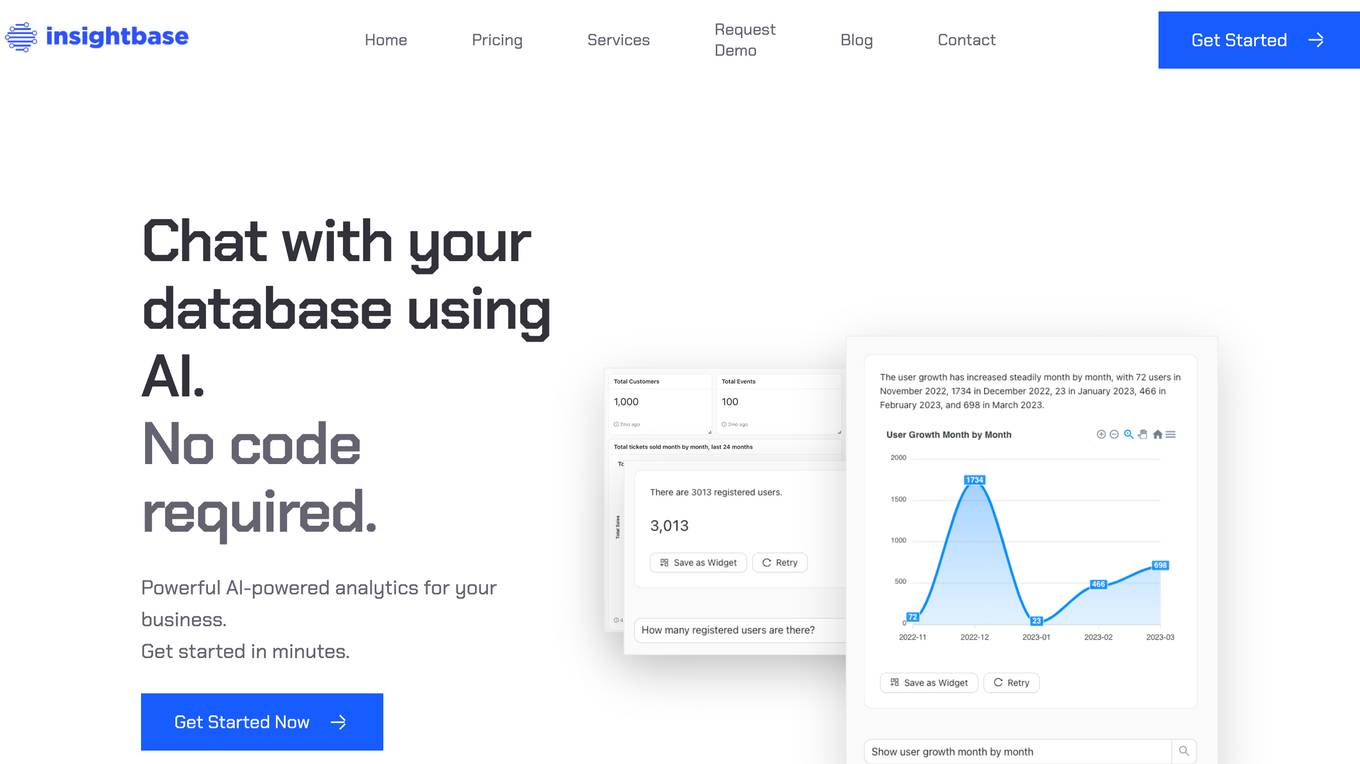
InsightBase
InsightBase is a powerful AI-powered analytics platform that makes it easy for everyone to get insights from their data. With InsightBase, you can ask questions in plain English and get answers in seconds, build powerful dashboards and reports in minutes, and get the most out of your data with the least amount of time, money, and resources.
ChartPixel
ChartPixel is an AI-assisted data analysis platform that empowers users to effortlessly generate charts, insights, and actionable statistics in just 30 seconds. The platform is designed to demystify data and analysis, making it accessible to users of all skill levels. ChartPixel combines the power of AI with domain expertise to provide secure and reliable output, ensuring trustworthy results without compromising data privacy. With user-friendly features and educational tools, ChartPixel helps users clean, wrangle, visualize, and present data with ease, catering to both beginners and professionals.
Tableau
Tableau is a visual analytics platform that helps people see, understand, and act on data. It is used by organizations of all sizes to solve problems, make better decisions, and improve operations. Tableau's platform is intuitive and easy to use, making it accessible to people of all skill levels. It also offers a wide range of features and capabilities, making it a powerful tool for data analysis and visualization.
Vizly
Vizly is an AI-powered data analysis tool that empowers users to make the most of their data. It allows users to chat with their data, visualize insights, and perform complex analysis. Vizly supports various file formats like CSV, Excel, and JSON, making it versatile for different data sources. The tool is free to use for up to 10 messages per month and offers a student discount of 50%. Vizly is suitable for individuals, students, academics, and organizations looking to gain actionable insights from their data.
Raw Query
Raw Query is a revolutionary tool that allows you to interact with your database using natural language, just like you would chat with a colleague. It's designed to save you time and effort, and make it easier than ever to access and manage your data. With Raw Query, you can query your data, add new data, and update your data, all through a simple chat interface. It's the perfect tool for anyone who wants to get more out of their data, without having to learn complex SQL queries or spend hours building custom tools.
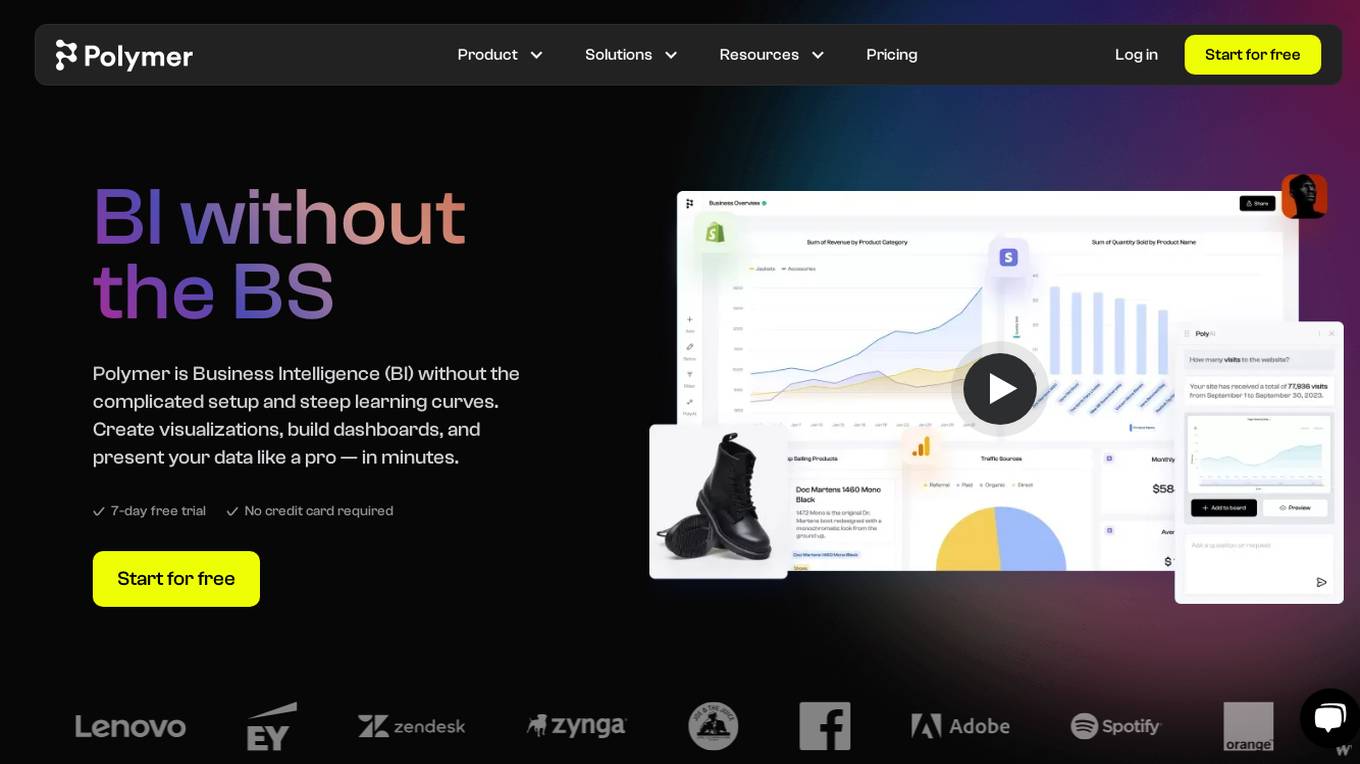
Polymer
Polymer is a business intelligence (BI) tool that makes it easy to connect to your data, build visualizations, and share insights. With Polymer, you don't need to be a data analyst to create beautiful dashboards and interactive reports. Polymer's AI-powered features make it easy to get started, even if you're new to BI. With Polymer, you can:
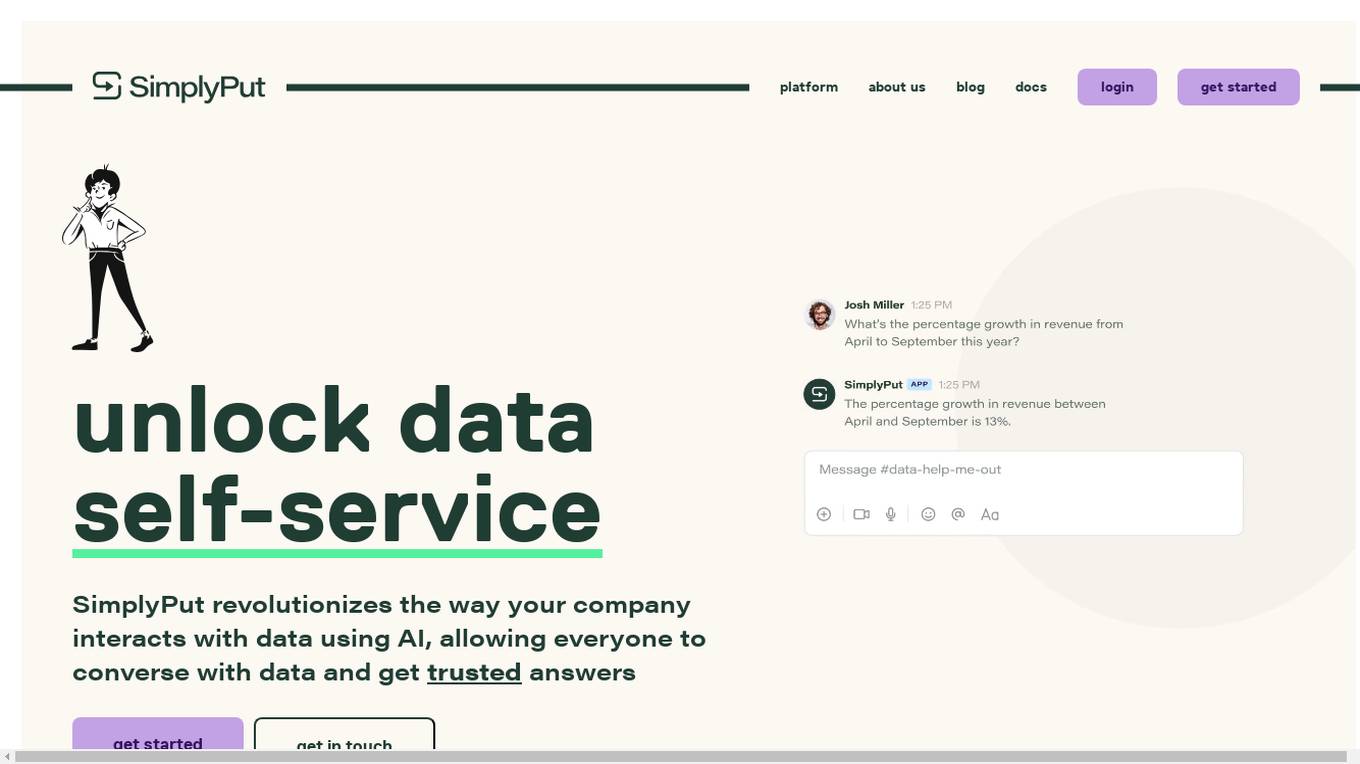
SimplyPut
SimplyPut is an AI-powered data analytics platform that allows users to ask questions about their data in natural language and get instant answers. It is designed to be intuitive and easy to use, and it can be integrated with a variety of data sources. SimplyPut is used by businesses of all sizes to improve their data literacy and make better decisions.

Numerous.ai
Numerous.ai is a powerful tool that allows you to use AI to write content, product descriptions, SEO keywords, and more in bulk. It also allows you to prompt ChatGPT inside your cells, analyze customer reviews, translate in bulk, enrich your spreadsheets with real information, extract information in bulk, and clean your data. Numerous.ai is a great tool for anyone who wants to save time and improve their productivity.
MyReport
MyReport is an AI-powered tool that helps users create automated reports in minutes. It uses advanced NLP technology to navigate the web and gather relevant information based on a user's input. The tool offers appealing full reports with professional outcomes, including images, graphs, tables, citations, quotes, and references. It also allows users to work with their own data by sharing a drive folder with their documents. MyReport is private and secure, and the user's information is not shared with third parties. The tool is available for professional users and offers fast generation and instant link sharing.
Scrol.ai
Scrol.ai is a powerful AI-powered tool that allows users to search, analyze, and generate data from various sources. It utilizes advanced language models like GPT-4 and ChatGPT to provide users with a seamless and efficient way to extract insights, summarize information, and create new content. With its user-friendly interface and robust features, Scrol.ai empowers users to streamline their workflow, enhance productivity, and make informed decisions.
Kanaries
Kanaries is an augmented analytics platform that uses AI to automate the process of data exploration and visualization. It offers a variety of features to help users quickly and easily find insights in their data, including: * **RATH:** An AI-powered engine that can automatically generate insights and recommendations based on your data. * **Graphic Walker:** A visual analytics tool that allows you to explore your data in a variety of ways, including charts, graphs, and maps. * **Data Painter:** A data cleaning and transformation tool that makes it easy to prepare your data for analysis. * **Causal Analysis:** A tool that helps you identify and understand the causal relationships between variables in your data. Kanaries is designed to be easy to use, even for users with no prior experience with data analysis. It is also highly scalable, so it can be used to analyze large datasets. Kanaries is a valuable tool for anyone who wants to quickly and easily find insights in their data. It can be used by businesses of all sizes, and it is particularly well-suited for organizations that are looking to improve their data-driven decision-making.
WhyHive
WhyHive is an AI-powered data analysis tool that helps users find and code key themes in their data, then visualize their findings with beautiful, shareable charts. It is designed to be easy to use, even for those with no prior experience with data analysis. WhyHive can analyze thousands of rows of data in minutes, saving users hours of manual coding time. It can also be used to analyze both quantitative and qualitative data, making it a versatile tool for a variety of research projects.
Charm
Charm is an AI-powered spreadsheet assistant that helps users clean messy data, create content, summarize feedback, classify sales leads, and generate dummy data. It is a Google Sheets add-on that automates tasks that are impossible to do with traditional formulas. Charm is used by hundreds of analysts, marketers, product managers, and more.
Basejump AI
Basejump AI is an AI-powered data access tool that allows users to interact with their database using natural language queries. It empowers teams to access data quickly and easily, providing instant insights and eliminating the need to navigate through complex dashboards. With Basejump AI, users can explore data, save relevant information, create custom collections, and refine datapoints to meet their specific requirements. The tool ensures data accuracy by allowing users to compare datapoints side by side. Basejump AI caters to various industries such as healthcare, HR, and software, offering real-time insights and analytics to streamline decision-making processes and optimize workflow efficiency.
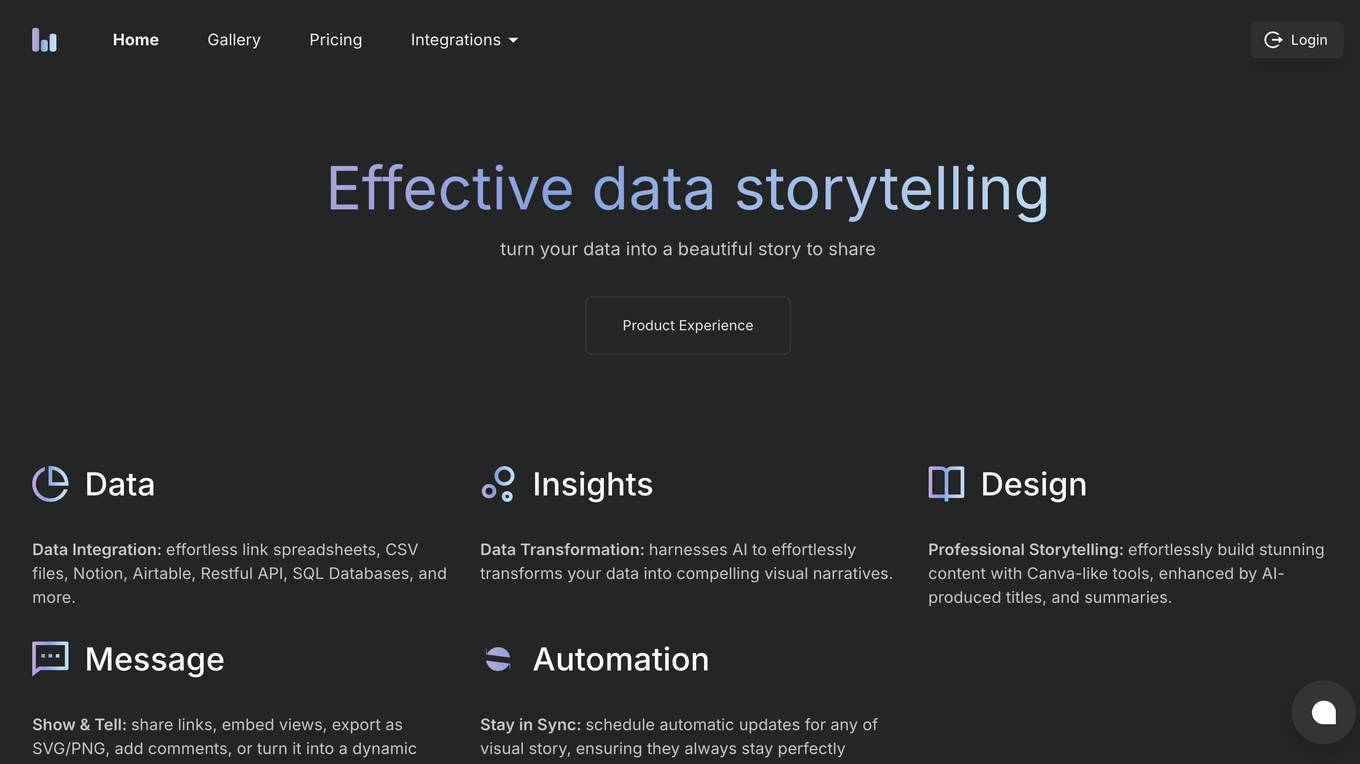
Columns
Columns is an AI tool that automates data storytelling. It enables users to create compelling narratives and visualizations from their data without the need for manual intervention. With Columns, users can easily transform raw data into engaging stories, making data analysis more accessible and impactful. The tool leverages advanced algorithms to analyze data sets, identify patterns, and generate insights that can be presented in a visually appealing format. Columns streamlines the process of data storytelling, saving users time and effort while enhancing the effectiveness of their data-driven communication.
For similar tasks

Rationale
Rationale is a cutting-edge decision-making AI tool that leverages the power of the latest GPT technology and in-context learning. It is designed to assist users in making informed decisions by providing valuable insights and recommendations based on the data provided. With its advanced algorithms and machine learning capabilities, Rationale aims to streamline the decision-making process and enhance overall efficiency.
Talpa.ai
Talpa.ai is an AI-powered platform that offers advanced solutions for data analytics and automation. The platform leverages cutting-edge artificial intelligence technologies to provide businesses with valuable insights and streamline their operations. Talpa.ai helps organizations make data-driven decisions, optimize processes, and enhance overall efficiency. With its user-friendly interface and powerful features, Talpa.ai is a reliable partner for businesses looking to harness the power of AI for growth and success.
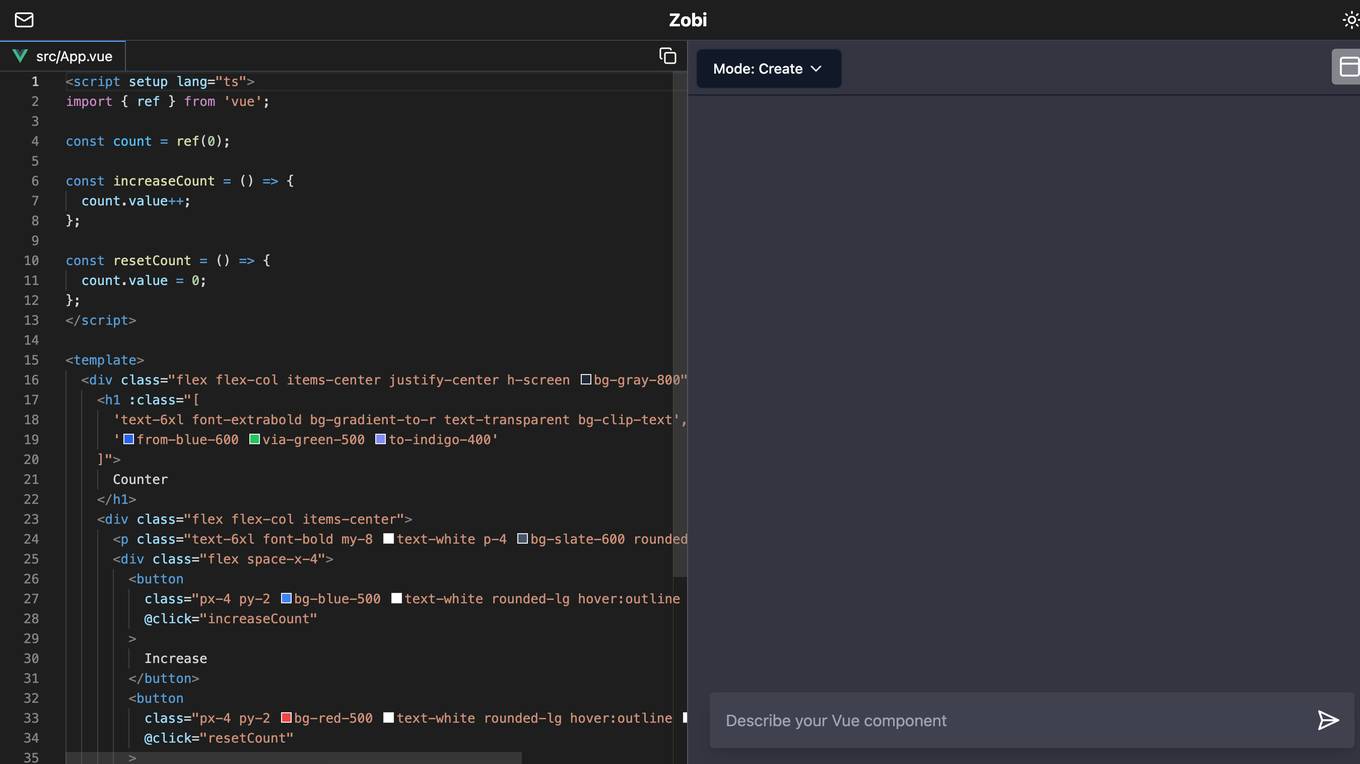
Zobi
The website Zobi is a web application that allows users to create a counter mode. Users can increment and reset the count using the provided functions. The interface is designed with a modern and user-friendly layout, making it easy for users to interact with the application.
Unlearn.ai
Unlearn.ai is an AI-powered platform that streamlines clinical trials by leveraging digital twins of patients. The platform replaces traditional siloed workflows with a unified workspace for trial design, planning, and analysis. By utilizing digital twins, data, and AI, Unlearn.ai helps teams achieve alignment faster, test assumptions earlier, and move forward with confidence in clinical development.
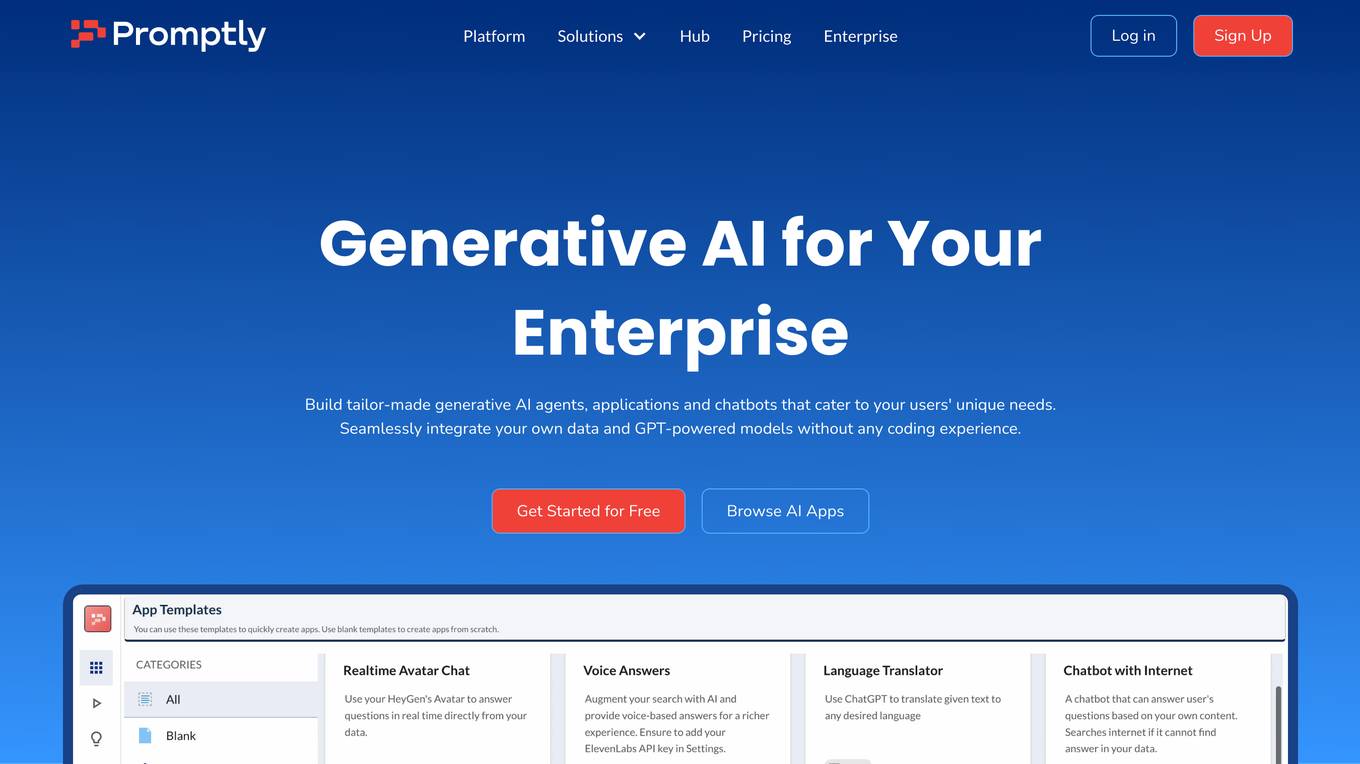
Promptly
Promptly is a generative AI platform designed for enterprises to build custom AI agents, applications, and chatbots without any coding experience. The platform allows users to seamlessly integrate their own data and GPT-powered models, supporting a wide variety of data sources. With features like model chaining, developer-friendly tools, and collaborative app building, Promptly empowers teams to quickly prototype and scale AI applications for various use cases. The platform also offers seamless integrations with popular workflows and tools, ensuring limitless possibilities for AI-powered solutions.
BlockSurvey
BlockSurvey is an AI-powered survey assistant that offers a comprehensive platform for creating, analyzing, and optimizing surveys with advanced AI capabilities. It prioritizes user data privacy and security, providing end-to-end encryption and compliance with industry standards. The platform features AI survey creation, analysis, thematic analysis, sentiment analysis, adaptive questioning, and sample responses generation. It also offers features like data encoding, survey optimization, secure surveys, anonymous surveys, and customization options. BlockSurvey caters to various industries and functions, ensuring privacy-first surveys with zero knowledge and decentralized survey capabilities.
Baseboard
Baseboard is an AI tool designed to help users generate insights from their data quickly and efficiently. With Baseboard, users can create visually appealing charts and visualizations for their websites or publications with the assistance of an AI-powered designer. The tool aims to streamline the data visualization process and provide users with valuable insights to make informed decisions.
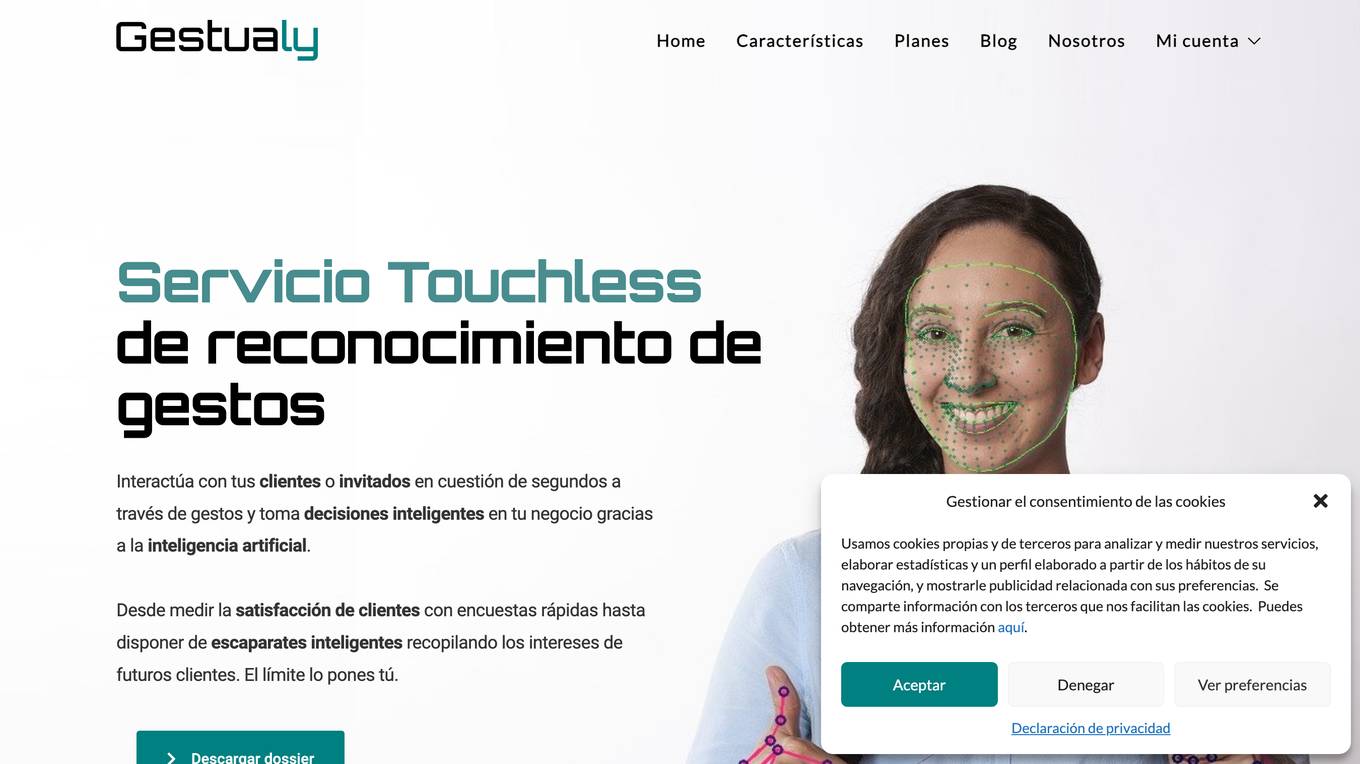
Gestualy
Gestualy is an AI tool designed to measure and improve customer satisfaction and mood quickly and easily through gestures. It eliminates the need for cumbersome satisfaction surveys by allowing interactions with customers or guests through gestures. The tool uses artificial intelligence to make intelligent decisions in businesses. Gestualy generates valuable statistical reports for businesses, including satisfaction levels, gender, mood, and age, all while ensuring data protection and privacy compliance. It offers touchless interaction, immediate feedback, anonymized reports, and various services such as gesture recognition, facial analysis, gamification, and alert systems.
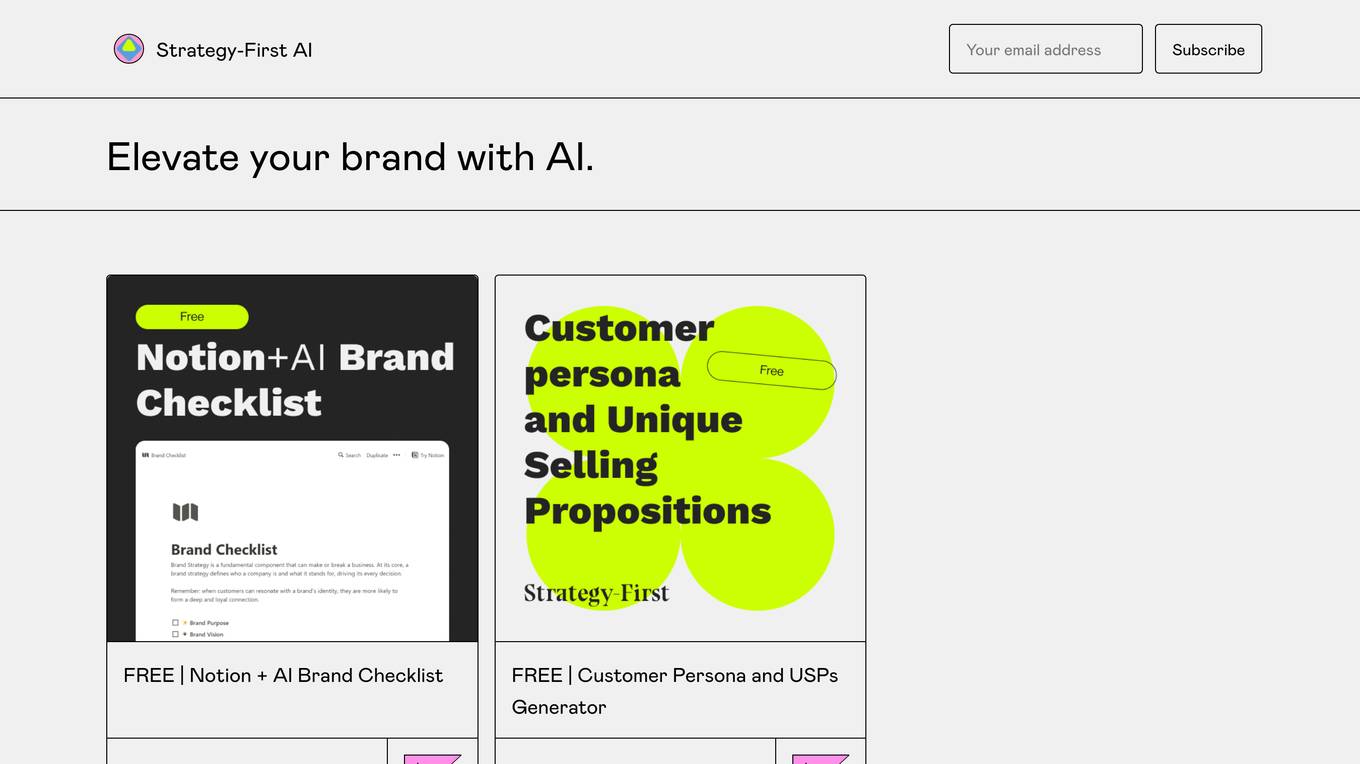
Strategy-First AI
Strategy-First AI is an AI tool designed to help businesses elevate their brand using artificial intelligence technology. The tool focuses on implementing strategic AI solutions to enhance brand performance and competitiveness in the market. With a user-friendly interface and advanced AI algorithms, Strategy-First AI provides businesses with valuable insights and recommendations to optimize their branding strategies and achieve business goals.
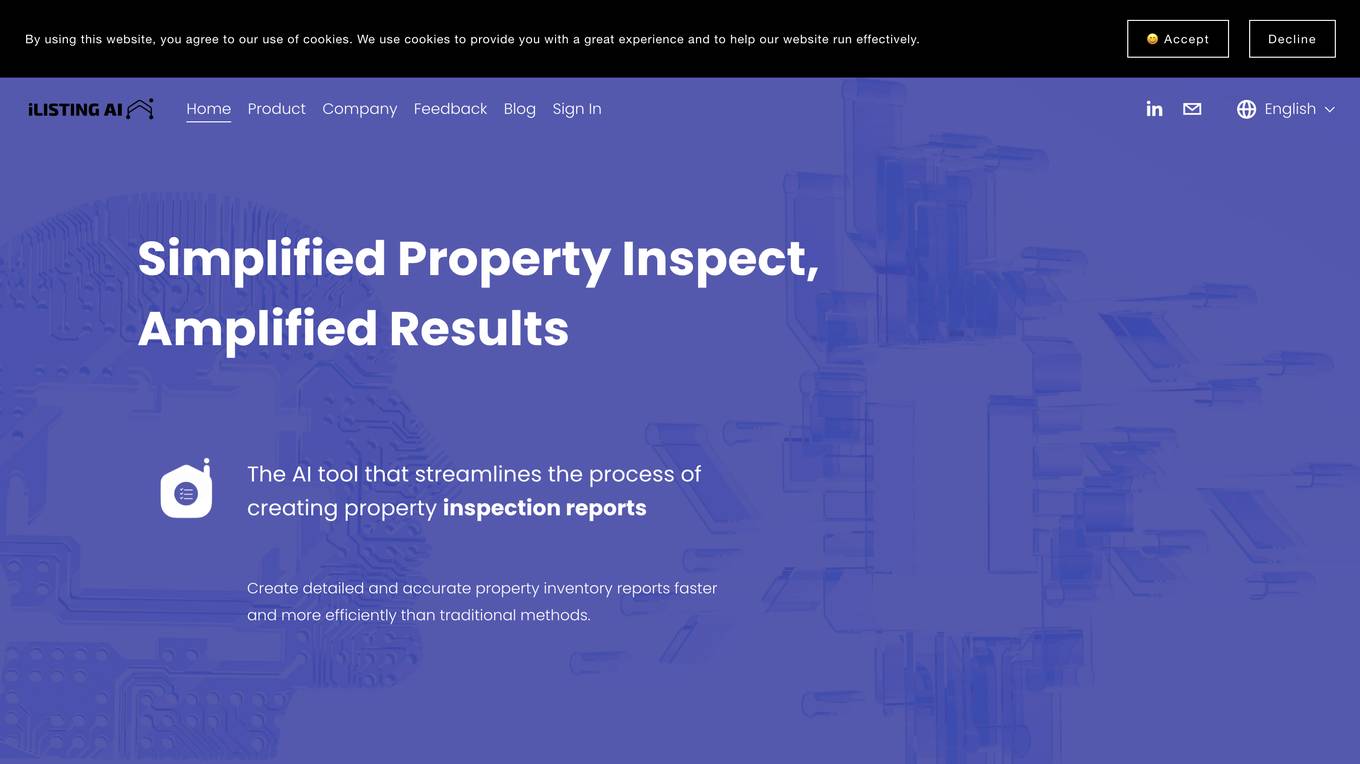
iListingAI
iListingAI is the UK's leading inventory software designed to streamline property inspection reports using AI technology. The application offers a user-friendly interface that combines vision, voice, and video to generate professional and legally compliant inventories 10x faster. With features like AI analysis, instant report generation, voice-first workflow, and ghost mode comparison, iListingAI revolutionizes the property inspection process for independent clerks and agencies.
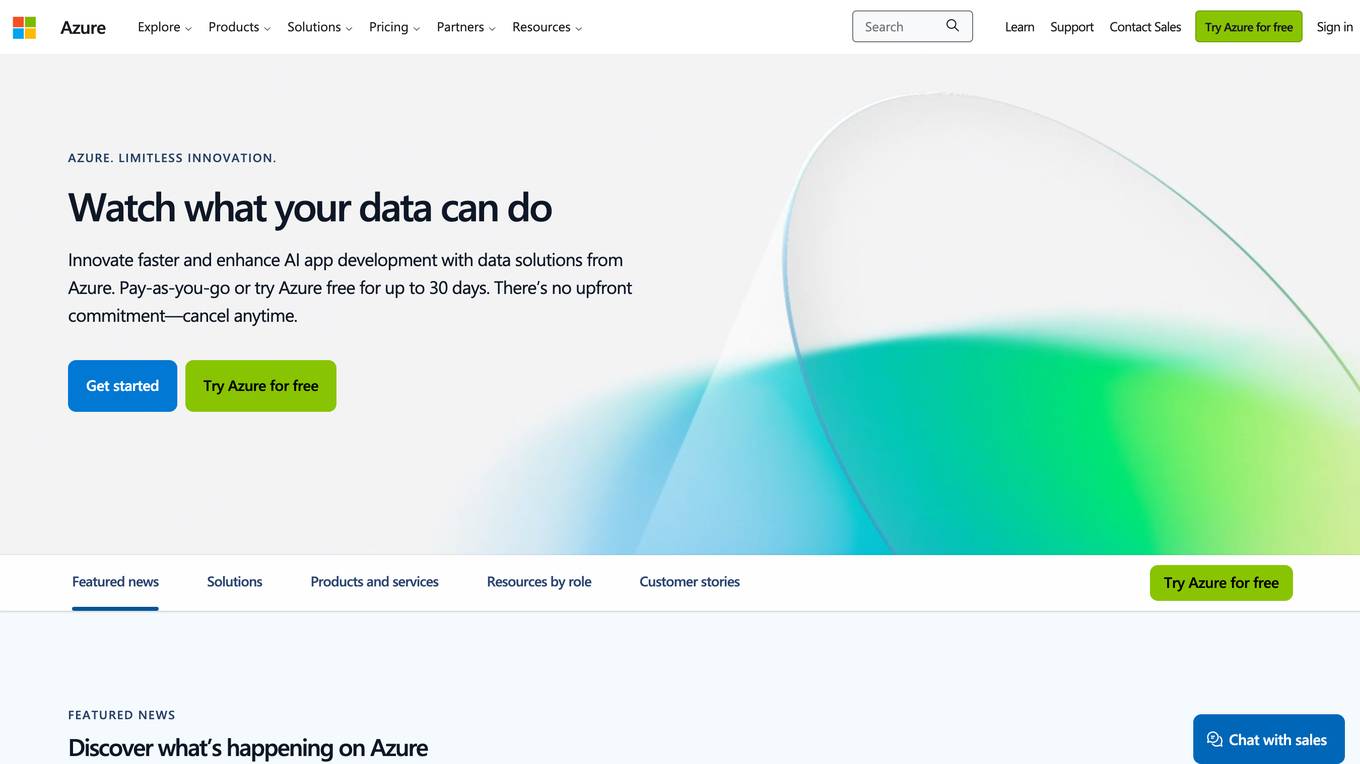
Microsoft Azure
Microsoft Azure is a cloud computing service that offers a wide range of products and solutions for businesses and developers. It provides services such as databases, analytics, compute, containers, hybrid cloud, AI, application development, and more. Azure aims to help organizations innovate, modernize, and scale their operations by leveraging the power of the cloud. With a focus on flexibility, performance, and security, Azure is designed to support a variety of workloads and use cases across different industries.

Wizu
Wizu is an AI-powered platform that offers conversational surveys to enhance customer feedback. It helps businesses collect meaningful feedback, analyze AI-powered insights, and take clear actions based on the data. The platform utilizes AI technology to drive engagement, deliver better response rates, and provide richer insights for businesses to make data-driven decisions.
Lexum.ai
Lexum.ai is an AI-powered legal research and summaries tool designed to assist legal professionals in conducting efficient and accurate legal research. The tool utilizes advanced artificial intelligence algorithms to analyze vast amounts of legal data and provide users with comprehensive summaries and insights. By leveraging cutting-edge technology, Lexum.ai aims to streamline the legal research process and enhance the productivity of legal practitioners.
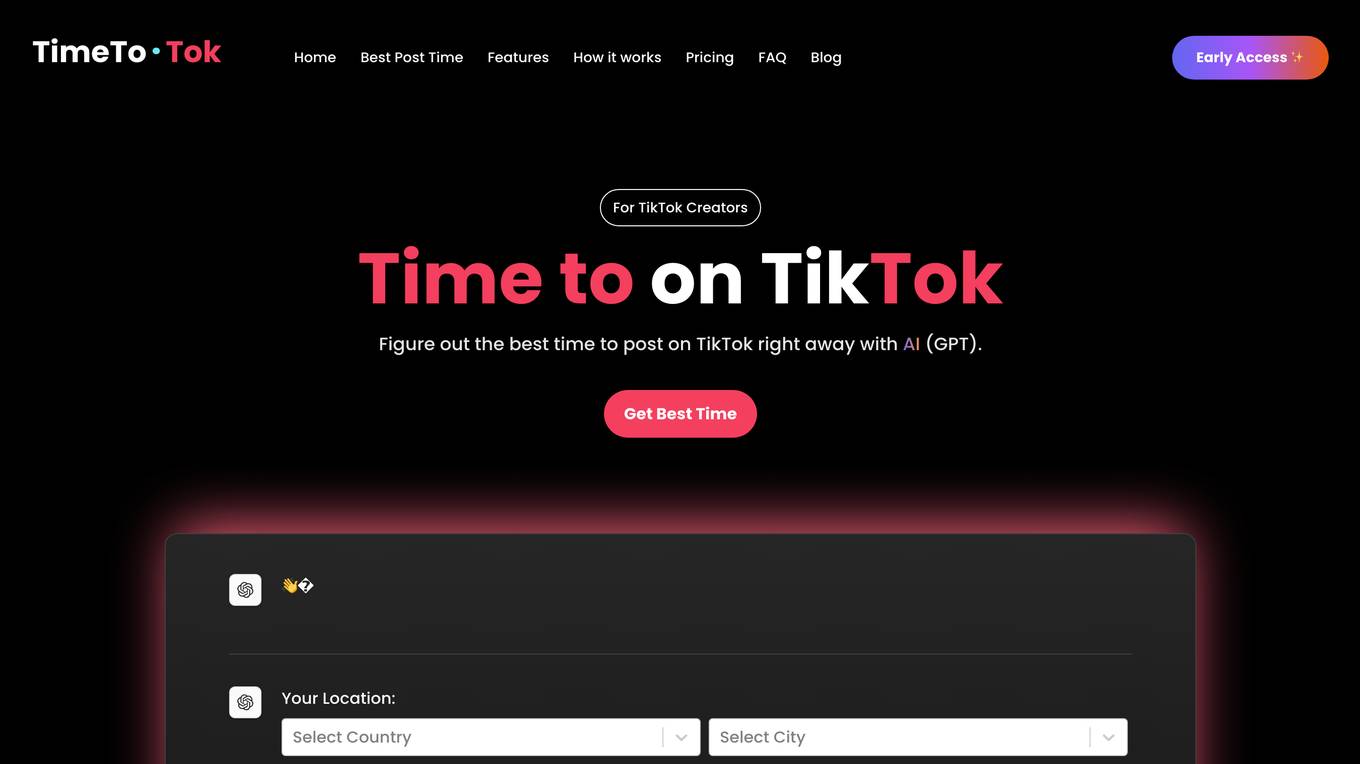
TimeToTok
TimeToTok is an AI Copilot and Agent designed for TikTok's growth. It uses LLM technology, similar to GPT, to analyze massive TikTok data and provide AI-driven insights to help creators improve their content, engagement, and monetization. The platform offers personalized growth strategies, viral content ideas, video optimization suggestions, competitor tracking, and 24/7 support to enhance users' TikTok presence and achieve significant growth.
Chatsheet
Chatsheet is an AI tool that revolutionizes the way spreadsheets are used. It leverages artificial intelligence to automate data entry, analysis, and visualization tasks, making spreadsheet management more efficient and intuitive. With Chatsheet, users can easily create, edit, and analyze data in a collaborative and interactive environment. The tool offers advanced features such as predictive analytics, natural language processing, and smart data suggestions to streamline decision-making processes. Chatsheet is designed to simplify complex data handling tasks and empower users to make data-driven decisions with ease.
ChatCSV
ChatCSV is a personal data analyst tool that allows users to upload CSV files and ask questions in natural language. It generates common questions about the data, visualizes answers with charts, and maintains chat history. It is useful for industries like retail, finance, banking, marketing, and advertising to understand trends, customer behavior, and more.
Lime
Lime is an AI-powered data research assistant designed to help users with data research tasks. It offers advanced capabilities to streamline the process of gathering and analyzing data, making it easier for users to derive insights and make informed decisions. Lime is equipped with cutting-edge AI technology that enables it to handle complex data sets efficiently and provide valuable recommendations. Whether you are a business professional, researcher, or student, Lime can assist you in various data-related tasks, saving you time and effort.
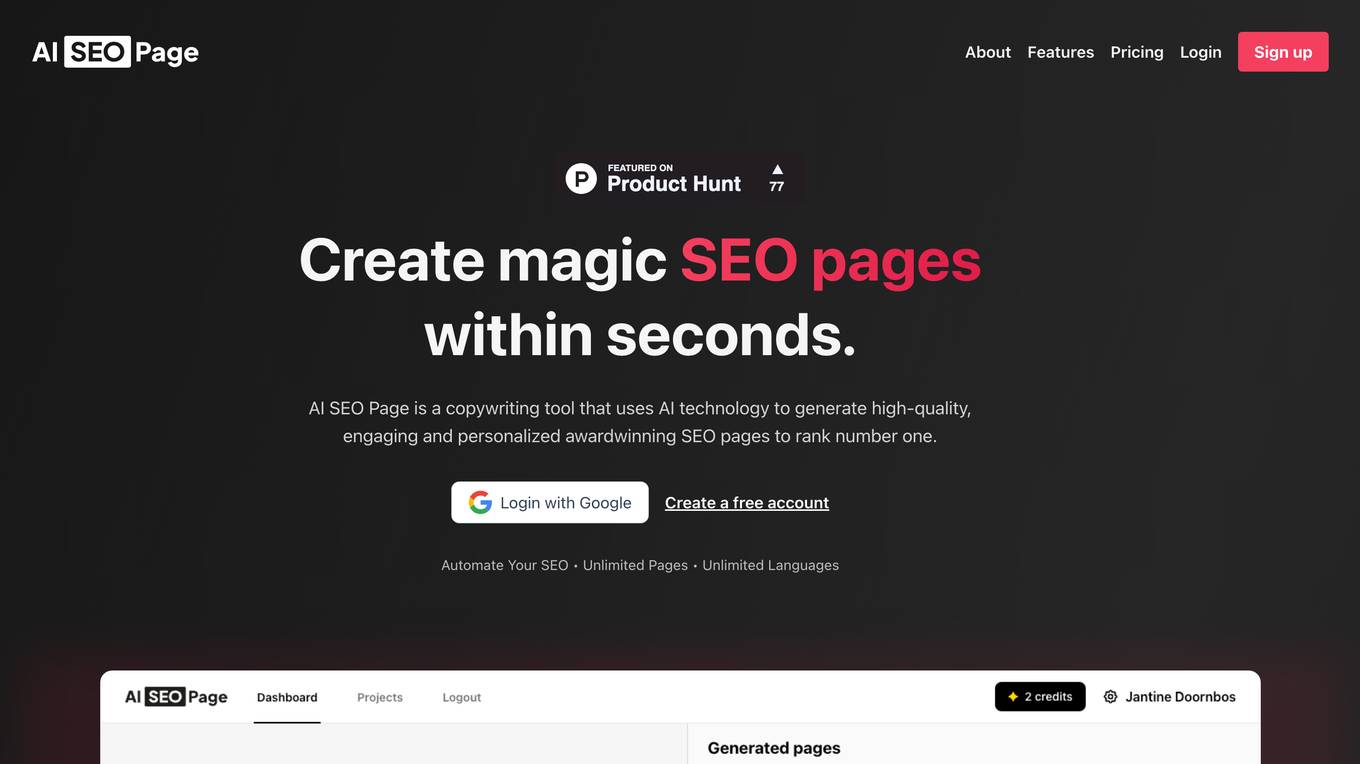
AI SEO Page
AI SEO Page is an AI-powered platform that focuses on the integration of artificial intelligence (AI) technology with Search Engine Optimization (SEO) strategies. The website provides insights and resources on leveraging AI in various aspects of SEO, including content creation, link building, analytics, user experience, and local SEO. It offers guidance on implementing AI-driven solutions to enhance search engine rankings and improve online visibility.
Business Automated
Business Automated is an independent automation consultancy that offers custom automation solutions for businesses. The website provides a range of products and services related to automation, including tools like Airtable, Google Sheets, and ChatGPT. Users can access tutorials on YouTube and read more on Medium to learn about automation techniques. Business Automated also offers products like Sales CRM and Cold emails with GPT4 and Airtable, demonstrating its focus on streamlining business processes through AI technology.
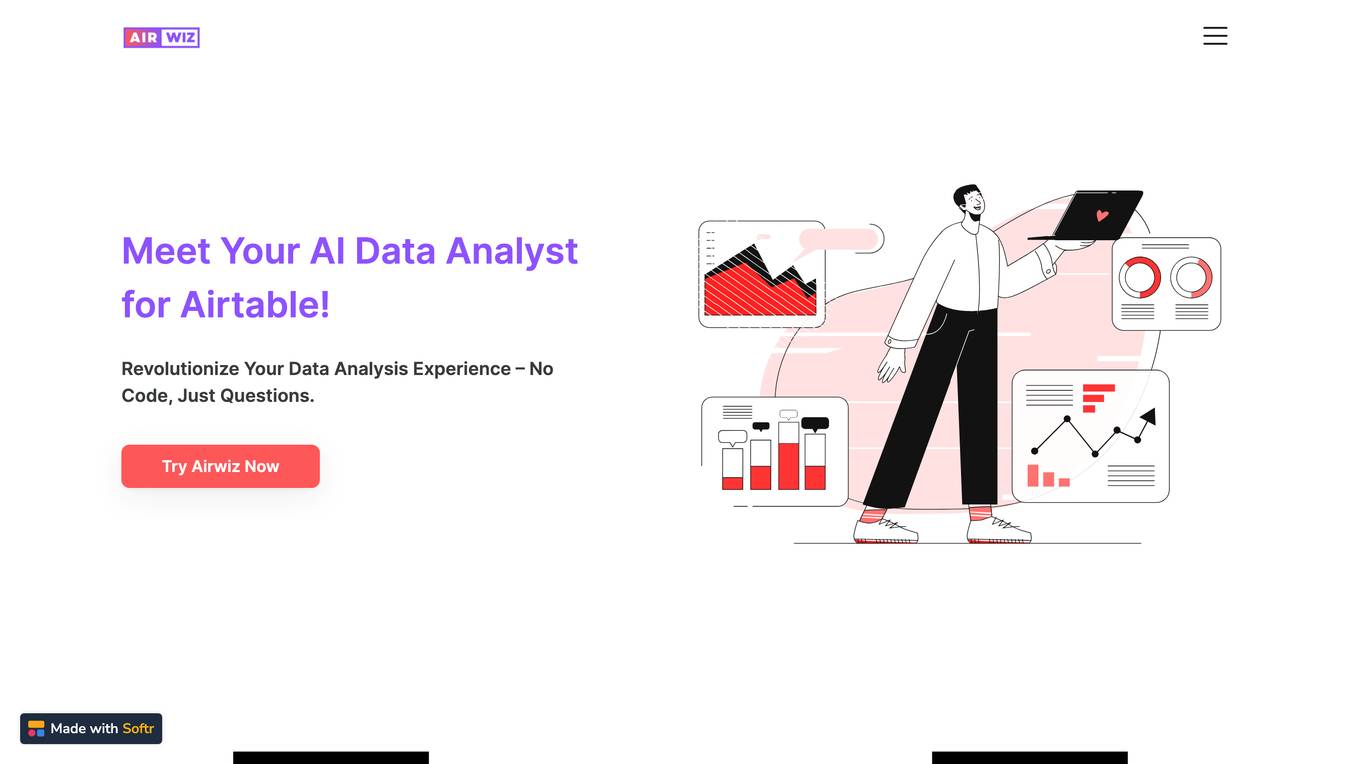
Airwiz
Airwiz is an AI data analyst tool designed to revolutionize data analysis experiences for users of Airtable. It enables users to perform complex data analysis tasks without the need for coding skills. By simply asking questions, users can gain valuable insights and make informed decisions based on their data. Airwiz simplifies the data analysis process, making it accessible to a wider audience.
ASK BOSCO®
ASK BOSCO® is an AI reporting and forecasting tool designed for agencies and retailers. It helps in collecting and analyzing data to improve browsing experience, customize marketing strategies, and provide analytics for better decision-making. The platform offers features like AI reporting, competitor benchmarking, AI budget planning, and data integrations to streamline marketing efforts and maximize ROI. Trusted by leading brands, ASK BOSCO® provides accurate forecasting and insights to optimize media spend and plan budgets effectively.
Synthreo
Synthreo is a Multi-Tenant AI Automation Platform designed for Managed Service Providers (MSPs) to empower businesses by streamlining operations, reducing costs, and driving growth through intelligent AI agents. The platform offers cutting-edge AI solutions that automate routine tasks, enhance decision-making, and facilitate collaboration between human teams and digital labor. Synthreo's AI agents provide transformative advantages for businesses of all sizes, enabling operational efficiency and strategic growth.
AI Intern
AI Intern is an AI-native content engine designed for demand growth. It automates the creation of written, visual, and audio content to attract the right buyers. The platform uses analytics and AI search strategy to identify trending topics and keywords, updating content weekly for continuous improvement. AI Intern offers a system that learns and adapts to the fast-paced changes in buyer behavior and digital channels. It provides a comprehensive solution for content marketing, combining AI-powered ICP and keyword research, multi-channel publishing, real analytics, and weekly improvement cycles.
Rapid Editor
Rapid Editor is an advanced map editing tool that revolutionizes map editing by integrating cutting-edge technology and AI-analyzed satellite imagery. It empowers OpenStreetMap mappers of all levels to make accurate and fresh edits quickly. The tool saves effort by tapping into open data and predicted features identified by artificial intelligence, providing a high-level overview of unmapped areas globally. Rapid Editor's intuitive user interface simplifies mapping, making it clear and simple for humanitarian and community groups to facilitate mapping projects.
For similar jobs
Rationale
Rationale is a cutting-edge decision-making AI tool that leverages the power of the latest GPT technology and in-context learning. It is designed to assist users in making informed decisions by providing valuable insights and recommendations based on the data provided. With its advanced algorithms and machine learning capabilities, Rationale aims to streamline the decision-making process and enhance overall efficiency.
ValueProp.Dev
ValueProp.Dev is an AI-powered tool designed to instantly generate a Value Proposition Canvas for companies based on their descriptions. The tool helps businesses identify and design a value proposition that addresses the needs and desires of their target customers by analyzing customer jobs, pains, and gains. It also assists in creating products and services that meet customer needs and provides value. ValueProp.Dev aims to simplify the process of developing a value proposition and making strategic decisions for businesses.
Nexus
Nexus is a Business-led Enterprise AI Platform that empowers business teams to transform their workflows into autonomous agents in a matter of days. It offers a secure, reliable, and flexible solution that enables enterprises to deploy 100x faster without involving engineering teams. Nexus provides adaptive intelligence, dynamic planning, continuous learning, and technology-agnostic intelligent automation. It allows for universal deployment, works with existing tools, and grows with businesses without increasing headcount.
GPT-4 Consulting
GPT-4 Consulting is an AI tool that provides business advice and software consultation services. Users can book consultations to get advice on leveraging AI for their products or businesses. The tool generates personalized advice based on the user's input, helping them make informed decisions to improve their business strategies and operations.
Strategy-First AI
Strategy-First AI is an AI tool designed to help businesses elevate their brand using artificial intelligence technology. The tool focuses on implementing strategic AI solutions to enhance brand performance and competitiveness in the market. With a user-friendly interface and advanced AI algorithms, Strategy-First AI provides businesses with valuable insights and recommendations to optimize their branding strategies and achieve business goals.
BuildSherpa
BuildSherpa is an AI-powered end-to-end validation platform designed to help entrepreneurs turn their ideas into profitable businesses. The platform offers market analysis, customer profiling, and personalized guidance to navigate the challenging journey from idea conception to achieving product-market fit. By leveraging a database of customer reviews and competitor websites, BuildSherpa provides actionable insights and strategies to validate business ideas efficiently. With features like generating landing pages, tracking metrics, and offering expert advice, BuildSherpa aims to support founders in making informed decisions and optimizing their products for success.
Digicurator Agency
Digicurator Agency is an AI automation partner that specializes in building custom automation solutions and training teams for long-term success. They provide end-to-end services, from discovery and strategy to solution design and development, deployment, and empowerment. Their mission is to transform businesses through custom solutions and expert education, empowering clients to master automation for lasting success. The agency offers full-service solutions that employ AI-driven strategies to propel businesses to new heights.
Slideworks
Slideworks is a platform offering strategy templates created by ex-McKinsey consultants. It provides high-end PowerPoint and Excel templates for creating world-class strategy presentations. The templates are designed based on proven frameworks and best-practice storylines, slide layouts, figures, and graphs. Users can easily customize the templates to match their company format and color schemes. Slideworks is trusted by over 4,500 customers worldwide and offers a comprehensive library of slide layouts, templates, and consulting tools and frameworks.
ThirdAI
ThirdAI is an AI platform that offers a production-ready solution for building and deploying AI applications quickly and efficiently. It provides advanced AI/GenAI technology that can run on any infrastructure, reducing barriers to delivering production-grade AI solutions. With features like enterprise SSO, built-in models, no-code interface, and more, ThirdAI empowers users to create AI applications without the need for specialized GPU servers or AI skills. The platform covers the entire workflow of building AI applications end-to-end, allowing for easy customization and deployment in various environments.
Marlee
Marlee is an AI-powered collaboration and performance operating system designed to help individuals and teams work better together. It offers a playbook tailored for Gen Z, combining AI teammates, human connection, and a purpose-driven approach to work. Marlee assists users in bringing out their best selves and optimizing team performance seamlessly within the workflow. The platform provides insights into personal motivations, work styles, and team dynamics, enabling teams to align faster and perform more effectively. With a focus on diversity and individuality, Marlee helps in communicating with team members, hiring top talent, and fostering a harmonious work environment.
AdIntelli
AdIntelli is an AI tool that helps users earn revenue from their AI Agent by displaying in-chat ads. It offers a platform for maximizing ad revenue through advanced AI-driven monetization technology. AdIntelli allows easy integration of ads into AI Agents without the need for coding skills, providing a seamless user experience. The platform is designed to personalize ad content for users and attract advertisers interested in promoting AI applications.

Aicoachbud
Aicoachbud.com is a website that provides coaching services for personal development and career growth. The platform offers personalized coaching sessions with experienced professionals to help individuals achieve their goals and overcome challenges. With a focus on leveraging AI technology to enhance coaching effectiveness, aicoachbud.com aims to empower users with the tools and guidance needed to succeed in various aspects of their lives.
ChatCSV
ChatCSV is a personal data analyst tool that allows users to upload CSV files and ask questions in natural language. It generates common questions about the data, visualizes answers with charts, and maintains chat history. It is useful for industries like retail, finance, banking, marketing, and advertising to understand trends, customer behavior, and more.

Rawbot
Rawbot is an AI model comparison tool that simplifies the process of selecting the best AI models for projects and applications. It allows users to compare various AI models side-by-side, providing insights into their performance, strengths, weaknesses, and suitability. Rawbot helps users make informed decisions by identifying the most suitable AI models based on specific requirements, leading to optimal results in research, development, and business applications.
Business Automated
Business Automated is an independent automation consultancy that offers custom automation solutions for businesses. The website provides a range of products and services related to automation, including tools like Airtable, Google Sheets, and ChatGPT. Users can access tutorials on YouTube and read more on Medium to learn about automation techniques. Business Automated also offers products like Sales CRM and Cold emails with GPT4 and Airtable, demonstrating its focus on streamlining business processes through AI technology.
AI Lean Canvas Generator
The AI Lean Canvas Generator is an AI-powered tool designed to help businesses create Lean Canvas for their company based on its description. It simplifies the process of generating a one-page business plan by utilizing artificial intelligence technology to streamline the creation and validation of business models. The tool is based on the Lean Startup methodology and emphasizes rapid experimentation and iterative development to reduce risk and uncertainty in the early stages of a business. It offers a user-friendly interface that allows users to input their company's information and quickly generate a comprehensive Lean Canvas.
Base64.ai
Base64.ai is an AI-powered document intelligence platform that offers a comprehensive solution for document processing and data extraction. It leverages advanced AI technology to streamline workflows, improve accuracy, and drive digital transformation for organizations. With features like Generative AI agents, workflow automation, and data intelligence, Base64.ai enables users to extract insights from structured and unstructured documents with ease. The platform is designed to enhance efficiency, reduce processing time, and increase productivity by eliminating manual document processing tasks.
Airwiz
Airwiz is an AI data analyst tool designed to revolutionize data analysis experiences for users of Airtable. It enables users to perform complex data analysis tasks without the need for coding skills. By simply asking questions, users can gain valuable insights and make informed decisions based on their data. Airwiz simplifies the data analysis process, making it accessible to a wider audience.
Co-Founder AI
Co-Founder AI is an AI-powered tool that accelerates startup success by providing in-depth business reports and actionable insights. It utilizes AI to generate well-structured business plans and offers essential insights to validate IT-business ideas. The tool covers various aspects such as market trends, competitor analysis, sales techniques, and fundraising strategies, enabling users to make data-driven decisions for driving growth.
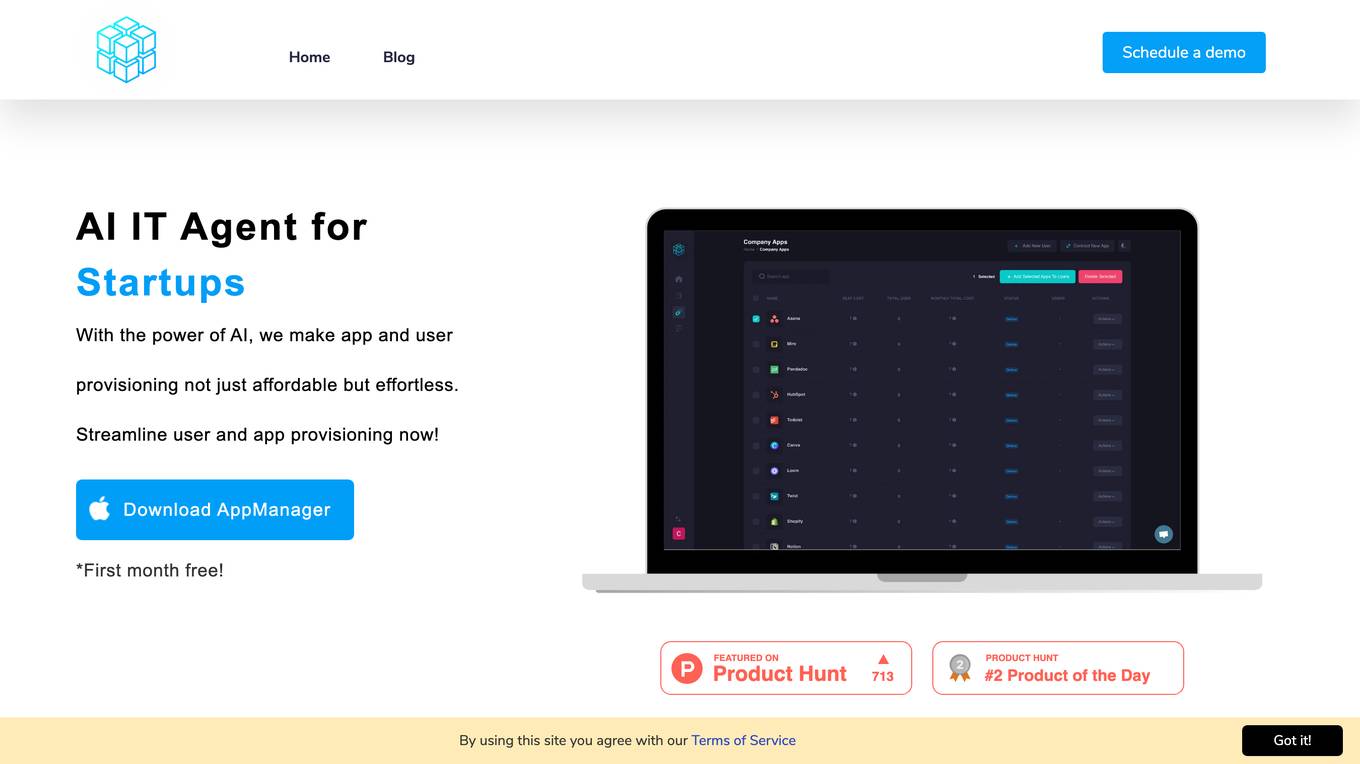
AppManager
AppManager is an AI IT agent designed specifically for startups to streamline app and user provisioning processes. With the power of AI, AppManager makes managing app subscriptions, user permissions, and payment methods effortless and cost-effective. It helps startups focus on growth by simplifying IT management tasks and providing smart spending insights.
Synthreo
Synthreo is a Multi-Tenant AI Automation Platform designed for Managed Service Providers (MSPs) to empower businesses by streamlining operations, reducing costs, and driving growth through intelligent AI agents. The platform offers cutting-edge AI solutions that automate routine tasks, enhance decision-making, and facilitate collaboration between human teams and digital labor. Synthreo's AI agents provide transformative advantages for businesses of all sizes, enabling operational efficiency and strategic growth.
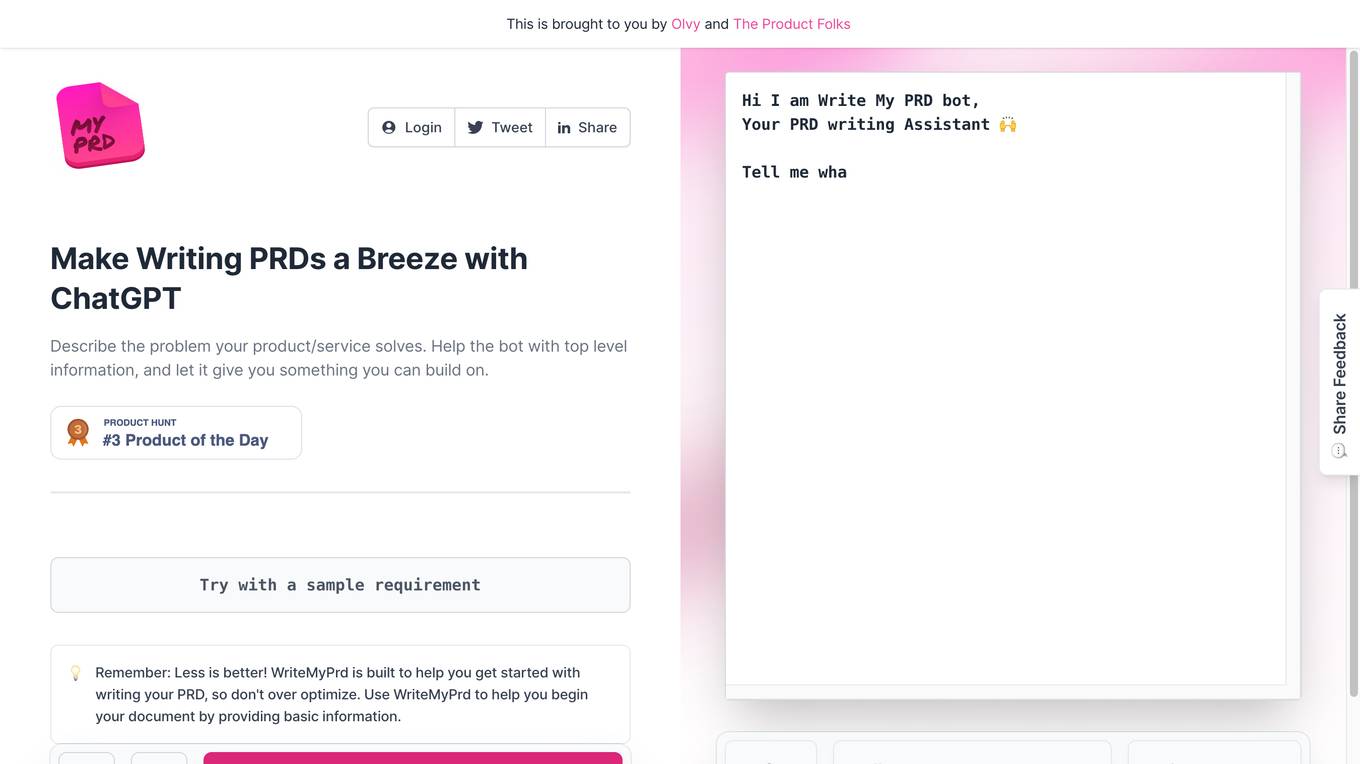
WriteMyPrd
WriteMyPrd is an AI tool designed to make writing Product Requirements Documents (PRDs) easier and faster. By leveraging ChatGPT Olvy 3.0, users can speed up their feedback analysis by 10x, enabling them to generate PRDs with basic information and feature details effortlessly. The tool aims to assist users in initiating their document creation process without over-optimizing, providing a streamlined approach to defining product requirements.
HP IQ
HP IQ is a platform developed by HP Development Company, L.P. It is designed to unlock human potential and enhance enterprise performance. The platform offers a range of tools and resources to help individuals and organizations achieve their goals. With a focus on innovation and collaboration, HP IQ aims to empower users to reach new heights of success.
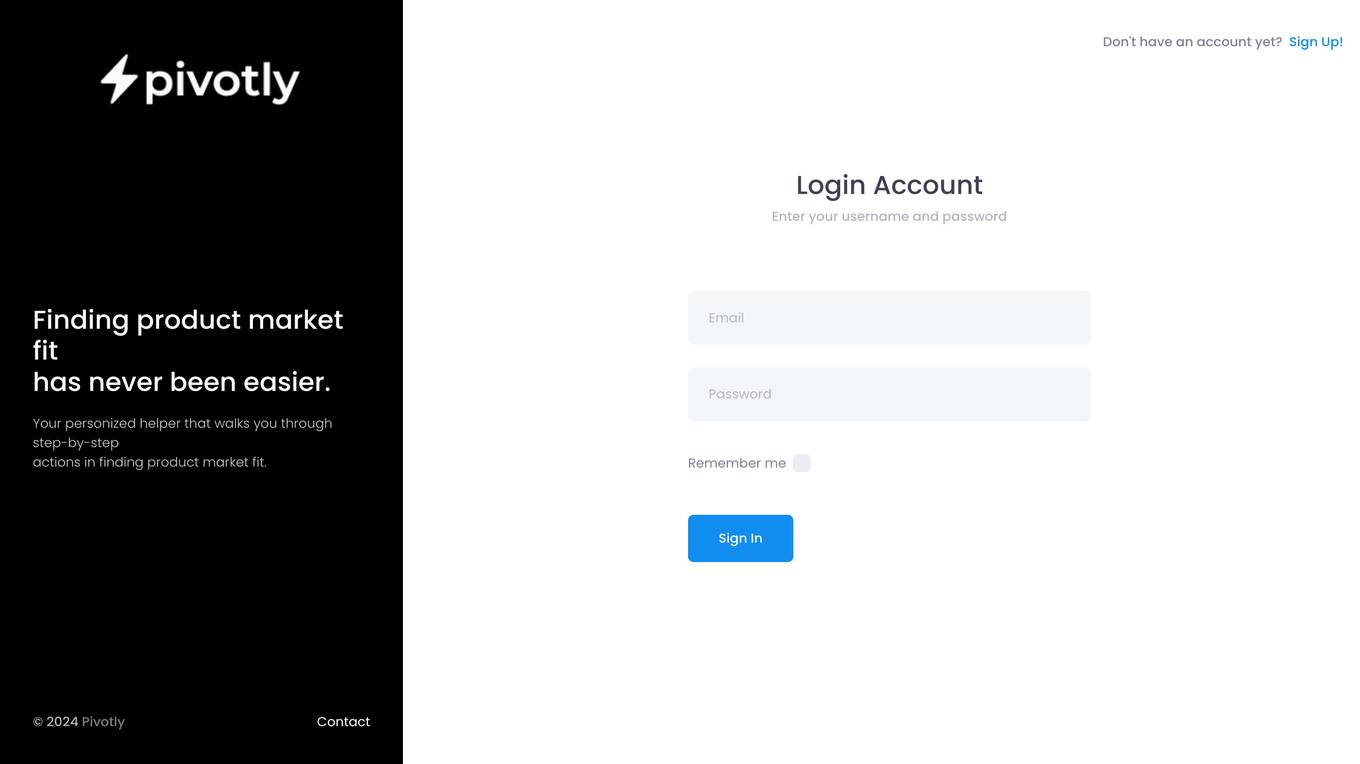
Pivotly
Pivotly is an AI tool designed to assist users in finding product market fit. It provides personalized guidance and step-by-step actions to streamline the process of identifying the right market for a product or service. With Pivotly, users can leverage AI technology to enhance their market research and decision-making, ultimately leading to more successful product launches and business growth.