
gitdiagram
Replace 'hub' with 'diagram' in any GitHub url for an interactive diagram visualization of the code
Stars: 89
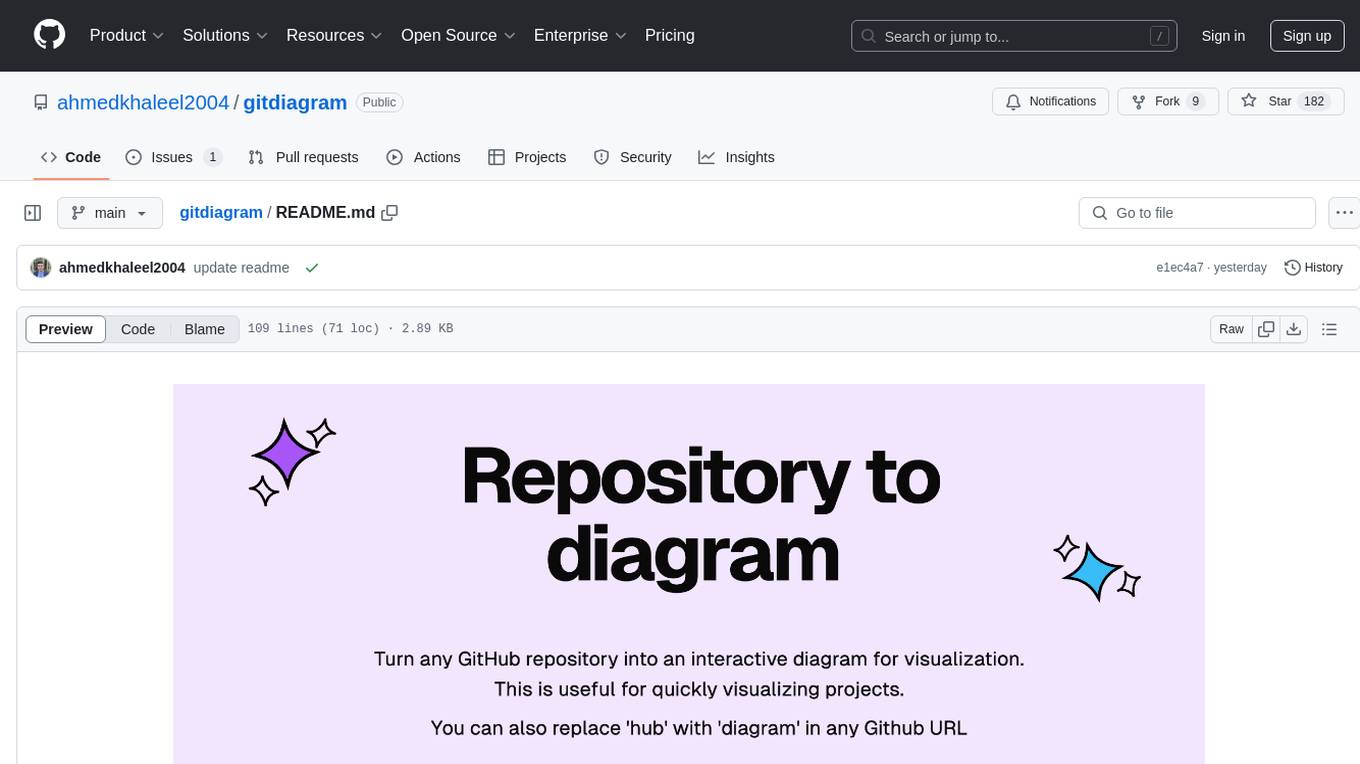
GitDiagram is a tool that turns any GitHub repository into an interactive diagram for visualization in seconds. It offers instant visualization, interactivity, fast generation, customization, and API access. The tool utilizes a tech stack including Next.js, FastAPI, PostgreSQL, Claude 3.5 Sonnet, Vercel, EC2, GitHub Actions, PostHog, and Api-Analytics. Users can self-host the tool for local development and contribute to its development. GitDiagram is inspired by Gitingest and has future plans to use larger context models, allow user API key input, implement RAG with Mermaid.js docs, and include font-awesome icons in diagrams.
README:
Turn any GitHub repository into an interactive diagram for visualization in seconds.
You can also replace hub with diagram in any Github URL to access its diagram.
- 👀 Instant Visualization: Convert any GitHub repository structure into a system design / architecture diagram
- 🎨 Interactivity: Click on components to navigate directly to source files and relevant directories
- ⚡ Fast Generation: Powered by Claude 3.5 Sonnet for quick and accurate diagrams
- 🔄 Customization: Modify and regenerate diagrams with custom instructions
- 🌐 API Access: Public API available for integration (WIP)
- Frontend: Next.js, TypeScript, Tailwind CSS, ShadCN
- Backend: FastAPI, Python, Server Actions
- Database: PostgreSQL (with Drizzle ORM)
- AI: Claude 3.5 Sonnet
- Deployment: Vercel (Frontend), EC2 (Backend)
- CI/CD: GitHub Actions
- Analytics: PostHog, Api-Analytics
- Clone the repository
git clone https://github.com/ahmedkhaleel2004/gitdiagram.git
cd gitdiagram- Install dependencies
pnpm i- Set up environment variables (create .env)
cp .env.example .envThen edit the .env file with your Anthropic API key and optional GitHub personal access token.
- Run backend
docker-compose up --build -dLogs available at docker-compose logs -f
The FastAPI server will be available at localhost:8000
- Start local database
chmod +x start-database.sh
./start-database.sh
When prompted to generate a random password, input yes.
The Postgres database will start in a container at localhost:5432
- Initialize the database schema
pnpm db:pushYou can view and interact with the database using pnpm db:studio
- Run Frontend
pnpm devYou can now access the website at localhost:3000 and edit the rate limits defined in backend/app/routers/generate.py in the generate function decorator.
Contributions are welcome! Please feel free to submit a Pull Request.
Shoutout to Romain Courtois's Gitingest for inspiration and styling
I am currently hosting it for free with the following rate limits. If you would like to bypass these, self-hosting instructions are provided. I also plan on adding an input for your own Anthropic API key.
Diagram generation:
- 1 request per minute
- 5 requests per day
- Can use cheaper, larger context models like Gemini 1206
- Allow user to enter Anthropic API Key for use at own cost
- Implement RAG with Mermaid.js docs
- Implement font-awesome icons in diagram
For Tasks:
Click tags to check more tools for each tasksFor Jobs:
Alternative AI tools for gitdiagram
Similar Open Source Tools

gitdiagram
GitDiagram is a tool that turns any GitHub repository into an interactive diagram for visualization in seconds. It offers instant visualization, interactivity, fast generation, customization, and API access. The tool utilizes a tech stack including Next.js, FastAPI, PostgreSQL, Claude 3.5 Sonnet, Vercel, EC2, GitHub Actions, PostHog, and Api-Analytics. Users can self-host the tool for local development and contribute to its development. GitDiagram is inspired by Gitingest and has future plans to use larger context models, allow user API key input, implement RAG with Mermaid.js docs, and include font-awesome icons in diagrams.
langmanus
LangManus is a community-driven AI automation framework that combines language models with specialized tools for tasks like web search, crawling, and Python code execution. It implements a hierarchical multi-agent system with agents like Coordinator, Planner, Supervisor, Researcher, Coder, Browser, and Reporter. The framework supports LLM integration, search and retrieval tools, Python integration, workflow management, and visualization. LangManus aims to give back to the open-source community and welcomes contributions in various forms.
llms
LLMs is a universal LLM API transformation server designed to standardize requests and responses between different LLM providers such as Anthropic, Gemini, and Deepseek. It uses a modular transformer system to handle provider-specific API formats, supporting real-time streaming responses and converting data into standardized formats. The server transforms requests and responses to and from unified formats, enabling seamless communication between various LLM providers.
Auto-Analyst
Auto-Analyst is an AI-driven data analytics agentic system designed to simplify and enhance the data science process. By integrating various specialized AI agents, this tool aims to make complex data analysis tasks more accessible and efficient for data analysts and scientists. Auto-Analyst provides a streamlined approach to data preprocessing, statistical analysis, machine learning, and visualization, all within an interactive Streamlit interface. It offers plug and play Streamlit UI, agents with data science speciality, complete automation, LLM agnostic operation, and is built using lightweight frameworks.
trip_planner_agent
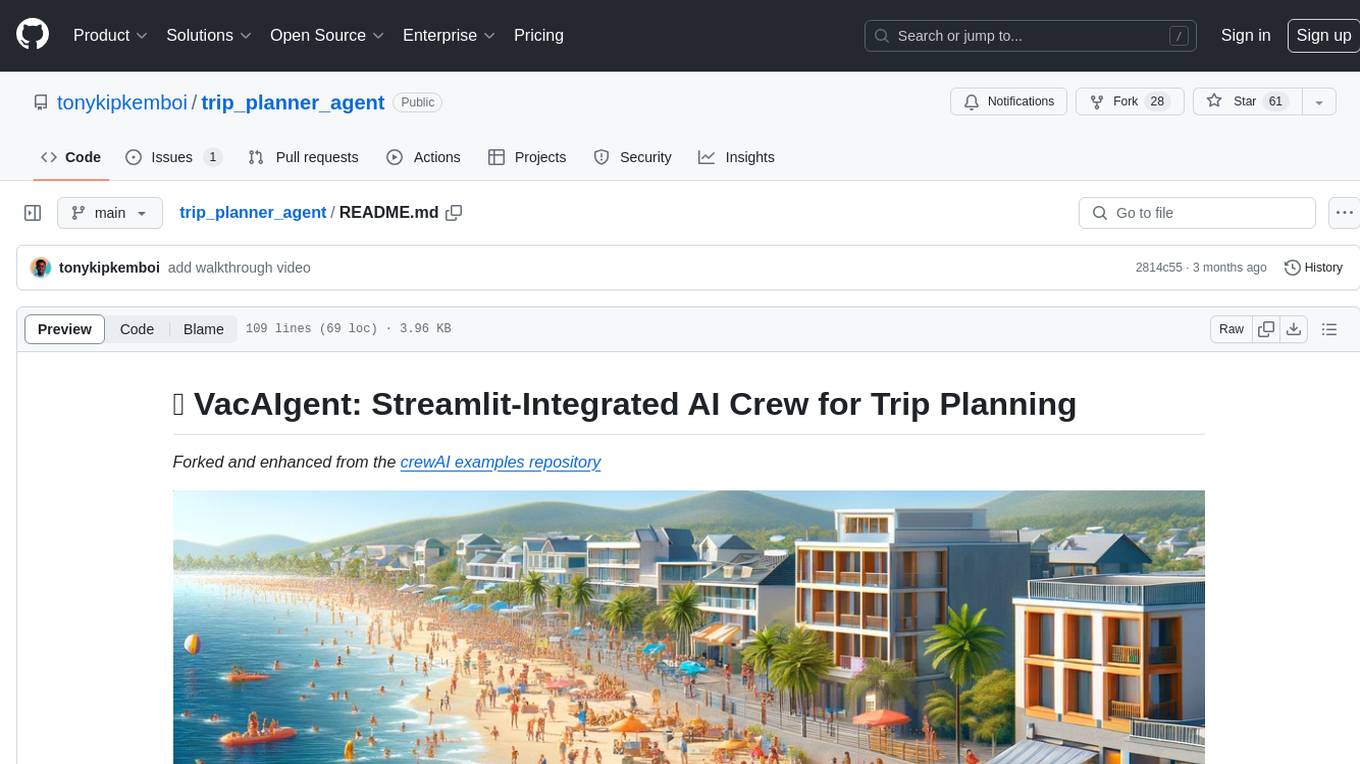
VacAIgent is an AI tool that automates and enhances trip planning by leveraging the CrewAI framework. It integrates a user-friendly Streamlit interface for interactive travel planning. Users can input preferences and receive tailored travel plans with the help of autonomous AI agents. The tool allows for collaborative decision-making on cities and crafting complete itineraries based on specified preferences, all accessible via a streamlined Streamlit user interface. VacAIgent can be customized to use different AI models like GPT-3.5 or local models like Ollama for enhanced privacy and customization.
Director
Director is a framework to build video agents that can reason through complex video tasks like search, editing, compilation, generation, etc. It enables users to summarize videos, search for specific moments, create clips instantly, integrate GenAI projects and APIs, add overlays, generate thumbnails, and more. Built on VideoDB's 'video-as-data' infrastructure, Director is perfect for developers, creators, and teams looking to simplify media workflows and unlock new possibilities.
nodejs-todo-api-boilerplate
An LLM-powered code generation tool that relies on the built-in Node.js API Typescript Template Project to easily generate clean, well-structured CRUD module code from text description. It orchestrates 3 LLM micro-agents (`Developer`, `Troubleshooter` and `TestsFixer`) to generate code, fix compilation errors, and ensure passing E2E tests. The process includes module code generation, DB migration creation, seeding data, and running tests to validate output. By cycling through these steps, it guarantees consistent and production-ready CRUD code aligned with vertical slicing architecture.

Foxel
Foxel is a highly extensible private cloud storage solution for individuals and teams, featuring AI-powered semantic search. It offers unified file management, pluggable storage backends, semantic search capabilities, built-in file preview, permissions and sharing options, and a task processing center. Users can easily manage files, search content within unstructured data, preview various file types, share files, and process tasks asynchronously. Foxel is designed to centralize file management and enhance search capabilities for users.
Local-File-Organizer
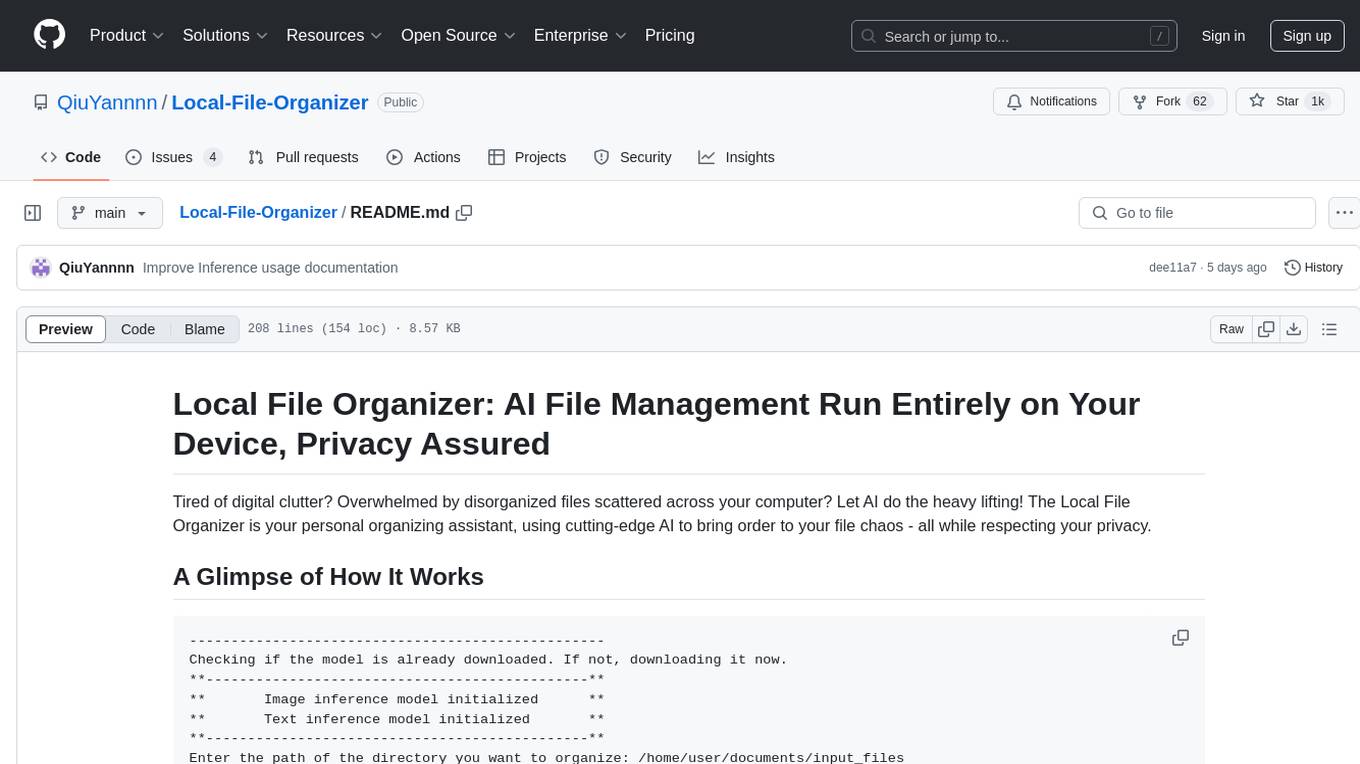
The Local File Organizer is an AI-powered tool designed to help users organize their digital files efficiently and securely on their local device. By leveraging advanced AI models for text and visual content analysis, the tool automatically scans and categorizes files, generates relevant descriptions and filenames, and organizes them into a new directory structure. All AI processing occurs locally using the Nexa SDK, ensuring privacy and security. With support for multiple file types and customizable prompts, this tool aims to simplify file management and bring order to users' digital lives.
Toolify
Toolify is a middleware proxy that empowers Large Language Models (LLMs) and OpenAI API interfaces by enabling function calling capabilities. It acts as an intermediary between applications and LLM APIs, injecting prompts and parsing tool calls from the model's response. Key features include universal function calling, multiple function calls support, flexible initiation, compatibility with
extension-gen-ai
The Looker GenAI Extension provides code examples and resources for building a Looker Extension that integrates with Vertex AI Large Language Models (LLMs). Users can leverage the power of LLMs to enhance data exploration and analysis within Looker. The extension offers generative explore functionality to ask natural language questions about data and generative insights on dashboards to analyze data by asking questions. It leverages components like BQML Remote Models, BQML Remote UDF with Vertex AI, and Custom Fine Tune Model for different integration options. Deployment involves setting up infrastructure with Terraform and deploying the Looker Extension by creating a Looker project, copying extension files, configuring BigQuery connection, connecting to Git, and testing the extension. Users can save example prompts and configure user settings for the extension. Development of the Looker Extension environment includes installing dependencies, starting the development server, and building for production.
ai_automation_suggester
An integration for Home Assistant that leverages AI models to understand your unique home environment and propose intelligent automations. By analyzing your entities, devices, areas, and existing automations, the AI Automation Suggester helps you discover new, context-aware use cases you might not have considered, ultimately streamlining your home management and improving efficiency, comfort, and convenience. The tool acts as a personal automation consultant, providing actionable YAML-based automations that can save energy, improve security, enhance comfort, and reduce manual intervention. It turns the complexity of a large Home Assistant environment into actionable insights and tangible benefits.
open-webui
Open WebUI is an extensible, feature-rich, and user-friendly self-hosted WebUI designed to operate entirely offline. It supports various LLM runners, including Ollama and OpenAI-compatible APIs. For more information, be sure to check out our Open WebUI Documentation.
comfyui_LLM_Polymath
LLM Polymath Chat Node is an advanced Chat Node for ComfyUI that integrates large language models to build text-driven applications and automate data processes, enhancing prompt responses by incorporating real-time web search, linked content extraction, and custom agent instructions. It supports both OpenAI’s GPT-like models and alternative models served via a local Ollama API. The core functionalities include Comfy Node Finder and Smart Assistant, along with additional agents like Flux Prompter, Custom Instructors, Python debugger, and scripter. The tool offers features for prompt processing, web search integration, model & API integration, custom instructions, image handling, logging & debugging, output compression, and more.
deep-research
Deep Research is a lightning-fast tool that uses powerful AI models to generate comprehensive research reports in just a few minutes. It leverages advanced 'Thinking' and 'Task' models, combined with an internet connection, to provide fast and insightful analysis on various topics. The tool ensures privacy by processing and storing all data locally. It supports multi-platform deployment, offers support for various large language models, web search functionality, knowledge graph generation, research history preservation, local and server API support, PWA technology, multi-key payload support, multi-language support, and is built with modern technologies like Next.js and Shadcn UI. Deep Research is open-source under the MIT License.
GraphRAG-Local-UI
GraphRAG Local with Interactive UI is an adaptation of Microsoft's GraphRAG, tailored to support local models and featuring a comprehensive interactive user interface. It allows users to leverage local models for LLM and embeddings, visualize knowledge graphs in 2D or 3D, manage files, settings, and queries, and explore indexing outputs. The tool aims to be cost-effective by eliminating dependency on costly cloud-based models and offers flexible querying options for global, local, and direct chat queries.
For similar tasks
LaVague
LaVague is an open-source Large Action Model framework that uses advanced AI techniques to compile natural language instructions into browser automation code. It leverages Selenium or Playwright for browser actions. Users can interact with LaVague through an interactive Gradio interface to automate web interactions. The tool requires an OpenAI API key for default examples and offers a Playwright integration guide. Contributors can help by working on outlined tasks, submitting PRs, and engaging with the community on Discord. The project roadmap is available to track progress, but users should exercise caution when executing LLM-generated code using 'exec'.

DocsGPT
DocsGPT is an open-source documentation assistant powered by GPT models. It simplifies the process of searching for information in project documentation by allowing developers to ask questions and receive accurate answers. With DocsGPT, users can say goodbye to manual searches and quickly find the information they need. The tool aims to revolutionize project documentation experiences and offers features like live previews, Discord community, guides, and contribution opportunities. It consists of a Flask app, Chrome extension, similarity search index creation script, and a frontend built with Vite and React. Users can quickly get started with DocsGPT by following the provided setup instructions and can contribute to its development by following the guidelines in the CONTRIBUTING.md file. The project follows a Code of Conduct to ensure a harassment-free community environment for all participants. DocsGPT is licensed under MIT and is built with LangChain.
Ollamac
Ollamac is a macOS app designed for interacting with Ollama models. It is optimized for macOS, allowing users to easily use any model from the Ollama library. The app features a user-friendly interface, chat archive for saving interactions, and real-time communication using HTTP streaming technology. Ollamac is open-source, enabling users to contribute to its development and enhance its capabilities. It requires macOS 14 or later and the Ollama system to be installed on the user's Mac with at least one Ollama model downloaded.
npi
NPi is an open-source platform providing Tool-use APIs to empower AI agents with the ability to take action in the virtual world. It is currently under active development, and the APIs are subject to change in future releases. NPi offers a command line tool for installation and setup, along with a GitHub app for easy access to repositories. The platform also includes a Python SDK and examples like Calendar Negotiator and Twitter Crawler. Join the NPi community on Discord to contribute to the development and explore the roadmap for future enhancements.

ain
DeFiChain is a blockchain platform dedicated to enabling decentralized finance with Bitcoin-grade security, strength, and immutability. It offers fast, intelligent, and transparent financial services accessible to everyone. DeFiChain has made significant modifications from Bitcoin Core, including moving to Proof-of-Stake, introducing a masternode model, supporting a community fund, anchoring to the Bitcoin blockchain, and enhancing decentralized financial transaction and opcode support. The platform is under active development with regular releases and contributions are welcomed.
doc-comments-ai
doc-comments-ai is a tool designed to automatically generate code documentation using language models. It allows users to easily create documentation comment blocks for methods in various programming languages such as Python, Typescript, Javascript, Java, Rust, and more. The tool supports both OpenAI and local LLMs, ensuring data privacy and security. Users can generate documentation comments for methods in files, inline comments in method bodies, and choose from different models like GPT-3.5-Turbo, GPT-4, and Azure OpenAI. Additionally, the tool provides support for Treesitter integration and offers guidance on selecting the appropriate model for comprehensive documentation needs.
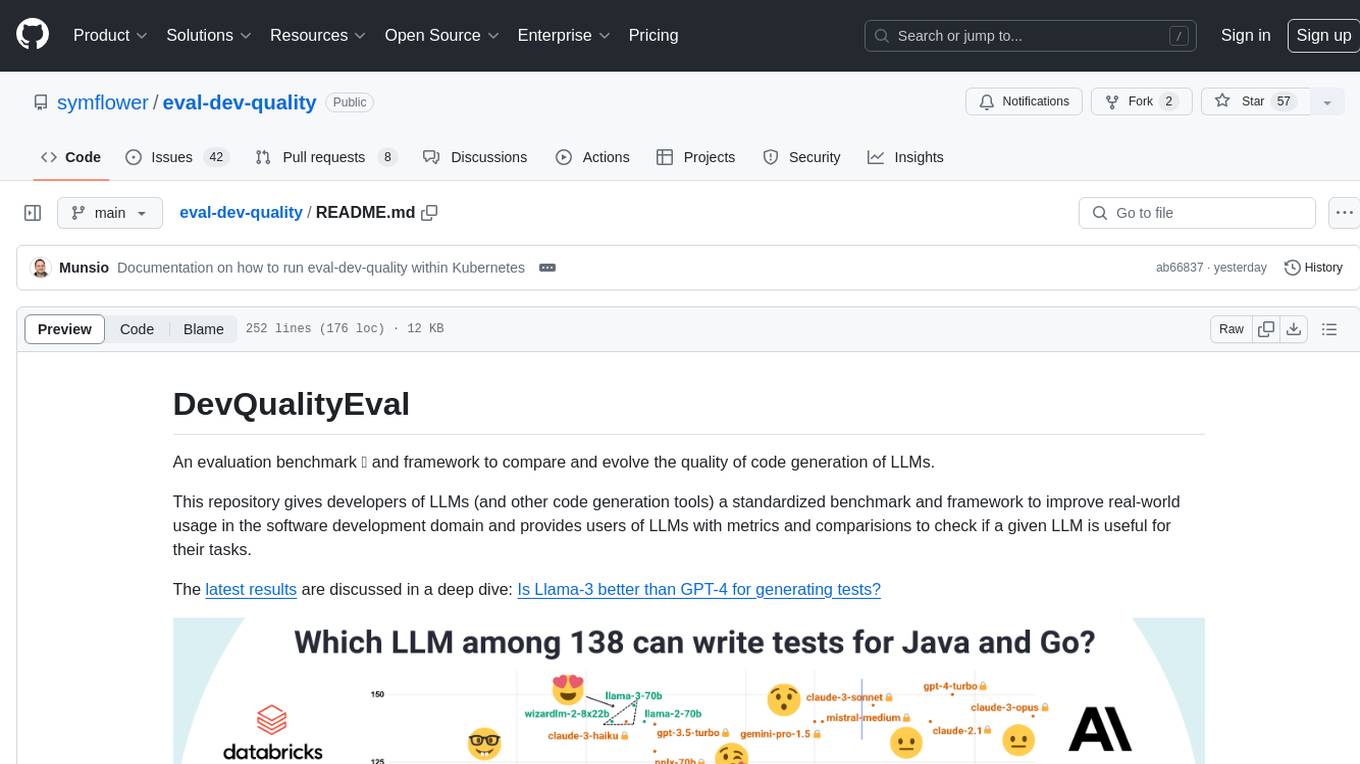
eval-dev-quality
DevQualityEval is an evaluation benchmark and framework designed to compare and improve the quality of code generation of Language Model Models (LLMs). It provides developers with a standardized benchmark to enhance real-world usage in software development and offers users metrics and comparisons to assess the usefulness of LLMs for their tasks. The tool evaluates LLMs' performance in solving software development tasks and measures the quality of their results through a point-based system. Users can run specific tasks, such as test generation, across different programming languages to evaluate LLMs' language understanding and code generation capabilities.

ansible-power-aix
The IBM Power Systems AIX Collection provides modules to manage configurations and deployments of Power AIX systems, enabling workloads on Power platforms as part of an enterprise automation strategy through the Ansible ecosystem. It includes example best practices, requirements for AIX versions, Ansible, and Python, along with resources for documentation and contribution.
For similar jobs
lollms-webui
LoLLMs WebUI (Lord of Large Language Multimodal Systems: One tool to rule them all) is a user-friendly interface to access and utilize various LLM (Large Language Models) and other AI models for a wide range of tasks. With over 500 AI expert conditionings across diverse domains and more than 2500 fine tuned models over multiple domains, LoLLMs WebUI provides an immediate resource for any problem, from car repair to coding assistance, legal matters, medical diagnosis, entertainment, and more. The easy-to-use UI with light and dark mode options, integration with GitHub repository, support for different personalities, and features like thumb up/down rating, copy, edit, and remove messages, local database storage, search, export, and delete multiple discussions, make LoLLMs WebUI a powerful and versatile tool.
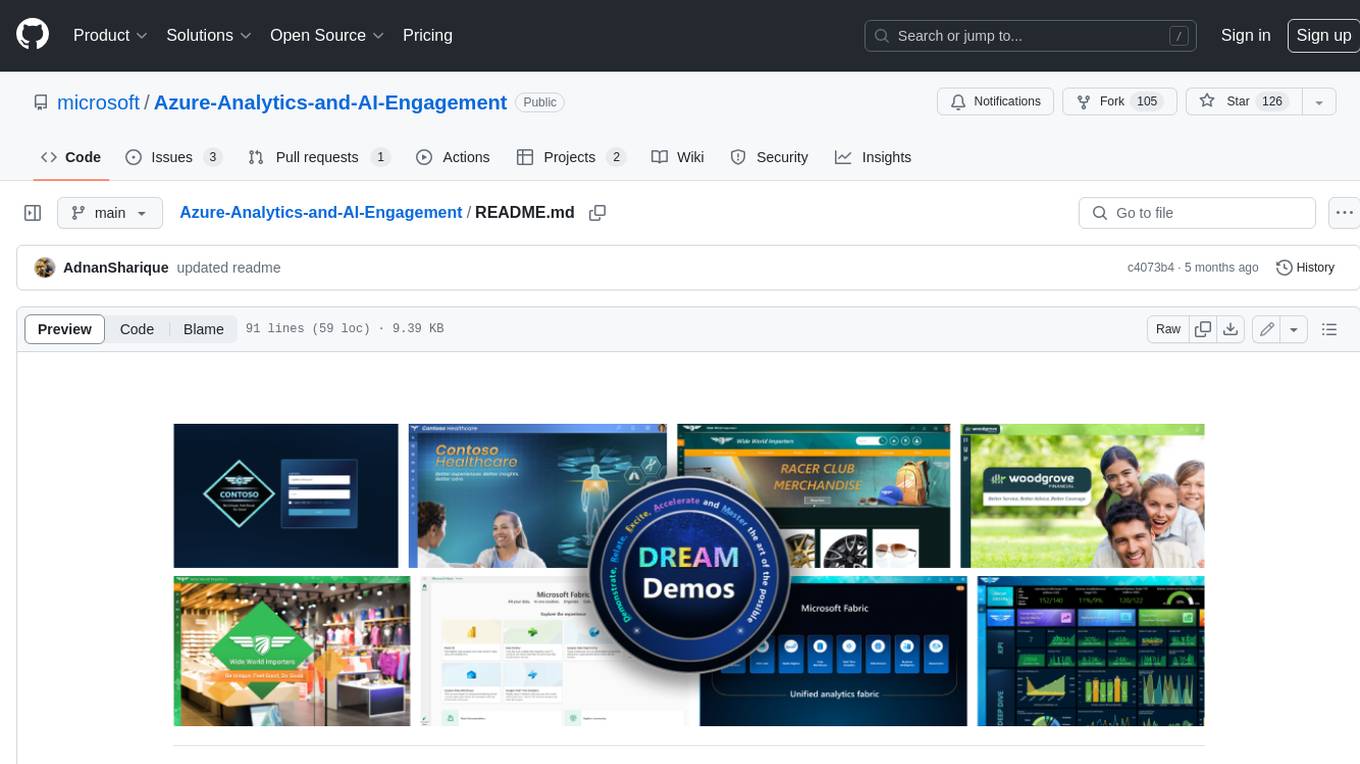
Azure-Analytics-and-AI-Engagement
The Azure-Analytics-and-AI-Engagement repository provides packaged Industry Scenario DREAM Demos with ARM templates (Containing a demo web application, Power BI reports, Synapse resources, AML Notebooks etc.) that can be deployed in a customer’s subscription using the CAPE tool within a matter of few hours. Partners can also deploy DREAM Demos in their own subscriptions using DPoC.
minio
MinIO is a High Performance Object Storage released under GNU Affero General Public License v3.0. It is API compatible with Amazon S3 cloud storage service. Use MinIO to build high performance infrastructure for machine learning, analytics and application data workloads.
mage-ai
Mage is an open-source data pipeline tool for transforming and integrating data. It offers an easy developer experience, engineering best practices built-in, and data as a first-class citizen. Mage makes it easy to build, preview, and launch data pipelines, and provides observability and scaling capabilities. It supports data integrations, streaming pipelines, and dbt integration.
AiTreasureBox
AiTreasureBox is a versatile AI tool that provides a collection of pre-trained models and algorithms for various machine learning tasks. It simplifies the process of implementing AI solutions by offering ready-to-use components that can be easily integrated into projects. With AiTreasureBox, users can quickly prototype and deploy AI applications without the need for extensive knowledge in machine learning or deep learning. The tool covers a wide range of tasks such as image classification, text generation, sentiment analysis, object detection, and more. It is designed to be user-friendly and accessible to both beginners and experienced developers, making AI development more efficient and accessible to a wider audience.
tidb
TiDB is an open-source distributed SQL database that supports Hybrid Transactional and Analytical Processing (HTAP) workloads. It is MySQL compatible and features horizontal scalability, strong consistency, and high availability.
airbyte
Airbyte is an open-source data integration platform that makes it easy to move data from any source to any destination. With Airbyte, you can build and manage data pipelines without writing any code. Airbyte provides a library of pre-built connectors that make it easy to connect to popular data sources and destinations. You can also create your own connectors using Airbyte's no-code Connector Builder or low-code CDK. Airbyte is used by data engineers and analysts at companies of all sizes to build and manage their data pipelines.
labelbox-python
Labelbox is a data-centric AI platform for enterprises to develop, optimize, and use AI to solve problems and power new products and services. Enterprises use Labelbox to curate data, generate high-quality human feedback data for computer vision and LLMs, evaluate model performance, and automate tasks by combining AI and human-centric workflows. The academic & research community uses Labelbox for cutting-edge AI research.

