Best AI tools for< Visualize Data In Vr >
20 - AI tool Sites
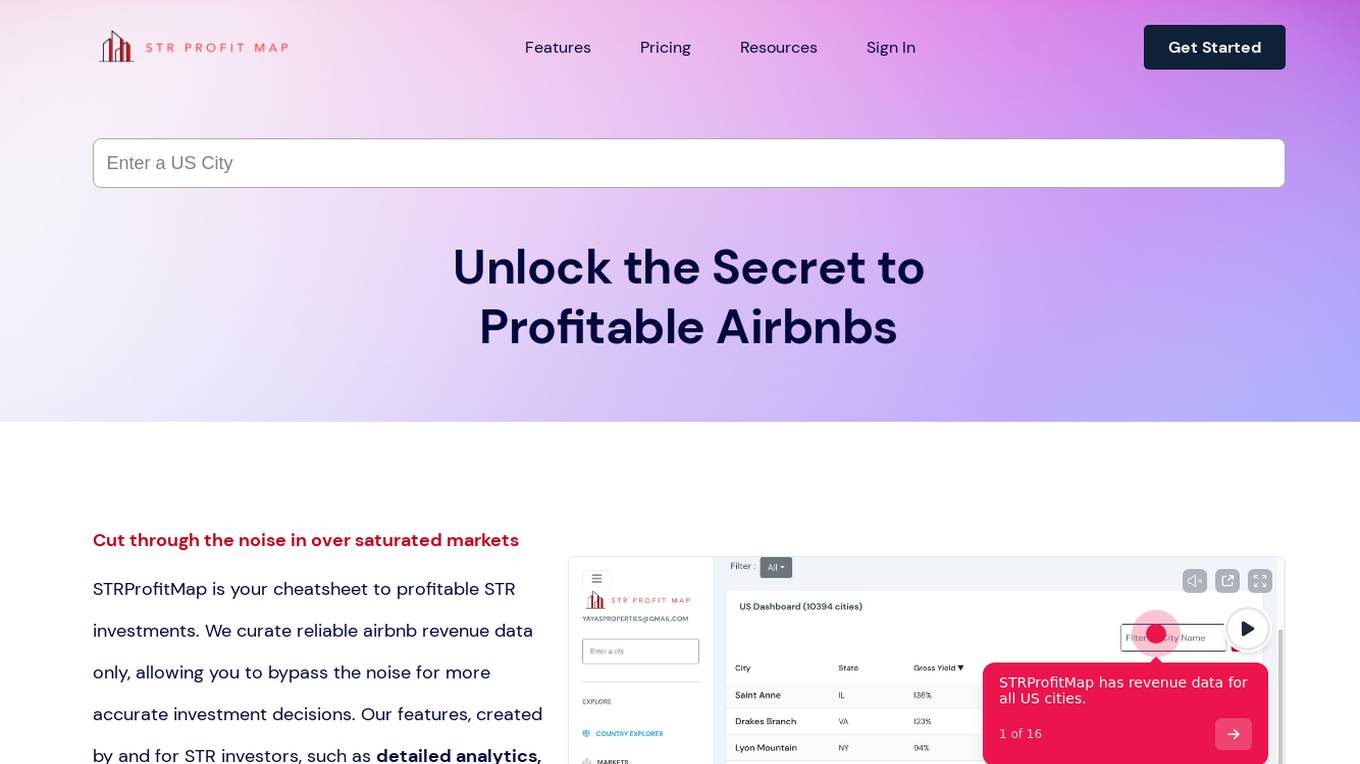
STRProfitMap
STRProfitMap is an AI-powered tool designed for Short-Term Rental (STR) investors to make informed and profitable decisions in the Airbnb market. It provides reliable revenue data sourced from Airbnb and VRBO, detailed analytics, profit maps, and AI-driven buy boxes to streamline the investment process. The platform curates data from over 11,000 cities/markets, offering insights into occupancy rates, average daily rates, property values, and estimated Return On Investments. By focusing on reliable listings with proven performance, STRProfitMap aims to reduce noise and uncertainty in the market, helping users identify top-performing markets with confidence.
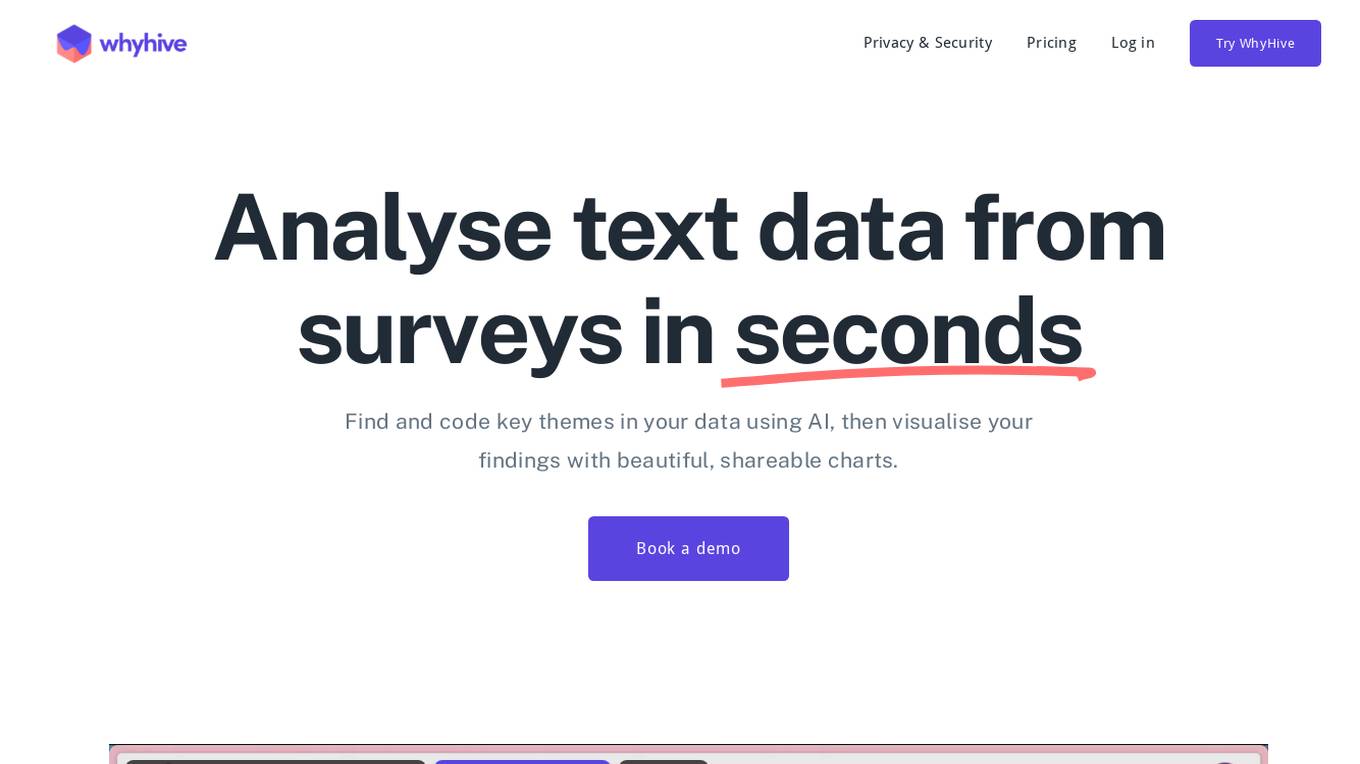
WhyHive
WhyHive is an AI-powered data analysis tool that helps users find and code key themes in their data, then visualize their findings with beautiful, shareable charts. It is designed to be easy to use, even for those with no prior experience with data analysis. WhyHive can analyze thousands of rows of data in minutes, saving users hours of manual coding time. It can also be used to analyze both quantitative and qualitative data, making it a versatile tool for a variety of research projects.
Monitr
Monitr is a data visualization and analytics platform that allows users to query, visualize, and share data in one place. It helps in tracking key metrics, making data-driven decisions, and breaking down data silos to provide a unified view of data from various sources. Users can create charts and dashboards, connect to different data sources like Postgresql and MySQL, and collaborate with teammates on SQL queries. Monitr's AI features are powered by Meta AI's Llama 3 LLM, enabling the development of powerful and flexible analytics tools for maximizing data utilization.
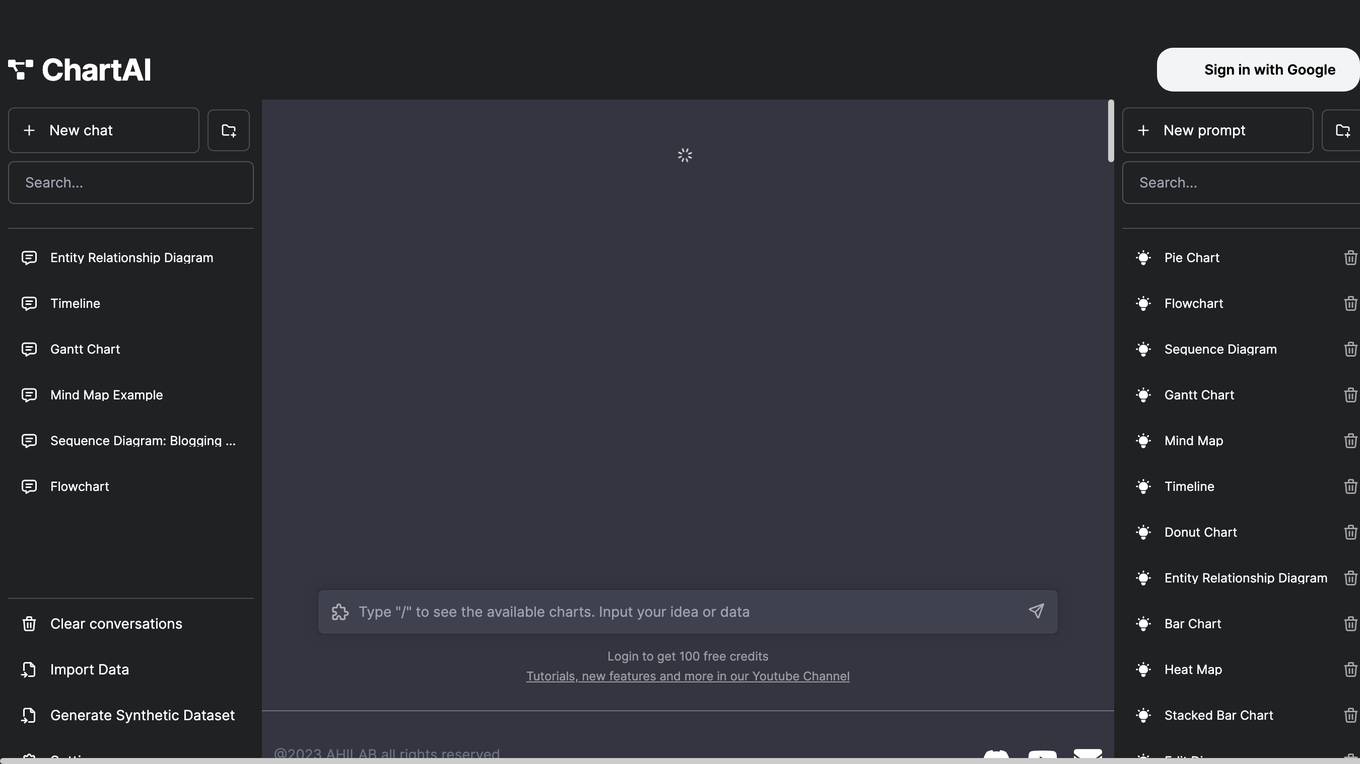
ChartAI
ChartAI is an AI-powered tool that helps you create beautiful charts and graphs from your data in seconds. With ChartAI, you can easily create bar charts, line charts, pie charts, and more. You can also customize your charts with different colors, fonts, and styles. ChartAI is the perfect tool for anyone who wants to create professional-looking charts and graphs quickly and easily.
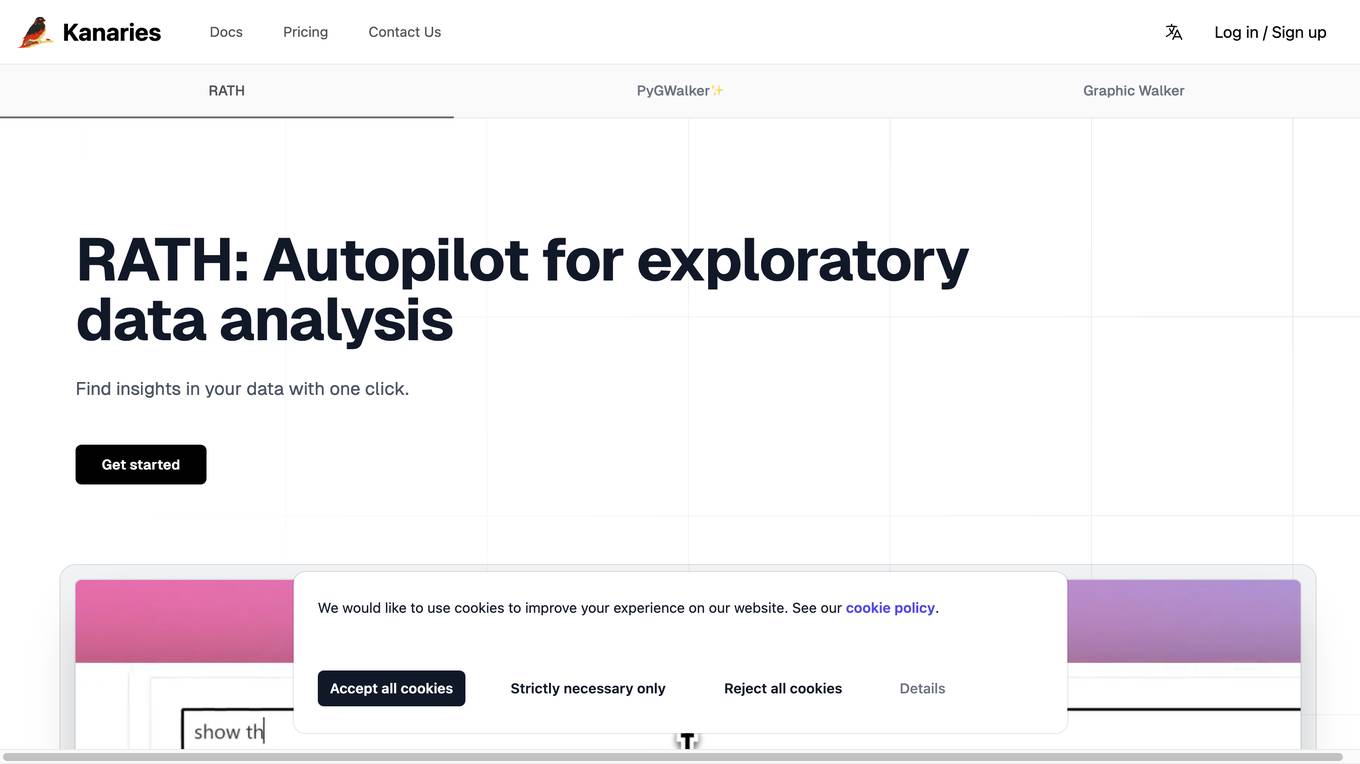
Kanaries
Kanaries is an augmented analytics platform that uses AI to automate the process of data exploration and visualization. It offers a variety of features to help users quickly and easily find insights in their data, including: * **RATH:** An AI-powered engine that can automatically generate insights and recommendations based on your data. * **Graphic Walker:** A visual analytics tool that allows you to explore your data in a variety of ways, including charts, graphs, and maps. * **Data Painter:** A data cleaning and transformation tool that makes it easy to prepare your data for analysis. * **Causal Analysis:** A tool that helps you identify and understand the causal relationships between variables in your data. Kanaries is designed to be easy to use, even for users with no prior experience with data analysis. It is also highly scalable, so it can be used to analyze large datasets. Kanaries is a valuable tool for anyone who wants to quickly and easily find insights in their data. It can be used by businesses of all sizes, and it is particularly well-suited for organizations that are looking to improve their data-driven decision-making.
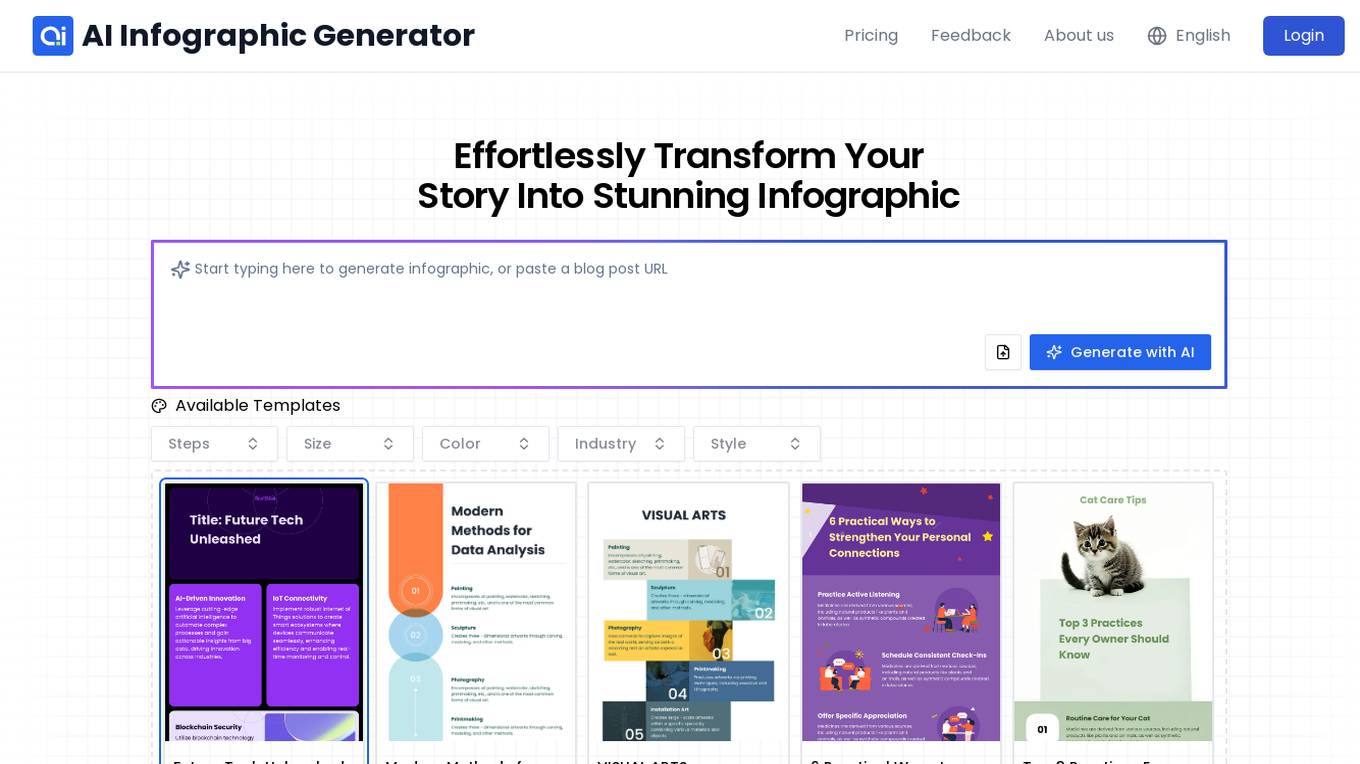
AI Infographic Maker
The AI Infographic Maker is a powerful tool that allows users to effortlessly create stunning infographics with the help of artificial intelligence. It offers a wide range of pre-set templates for various industries and topics, AI-powered design assistance for intelligent suggestions, data visualization support for popular chart types, customizable options for complete control over design elements, real-time updates and auto-sync features, and no design skills required for professional-level results. The tool simplifies the infographic creation process, making it accessible to users without advanced design skills.

Genius Sheets
Genius Sheets is a self-service data reporting tool that allows users to connect to data in Excel and Google Sheets and generate reports without the need for SQL or Python. It is designed to be easy to use and provides enterprise-grade security. Genius Sheets is trusted by over 100 companies and has been featured in publications such as Forbes and TechCrunch.
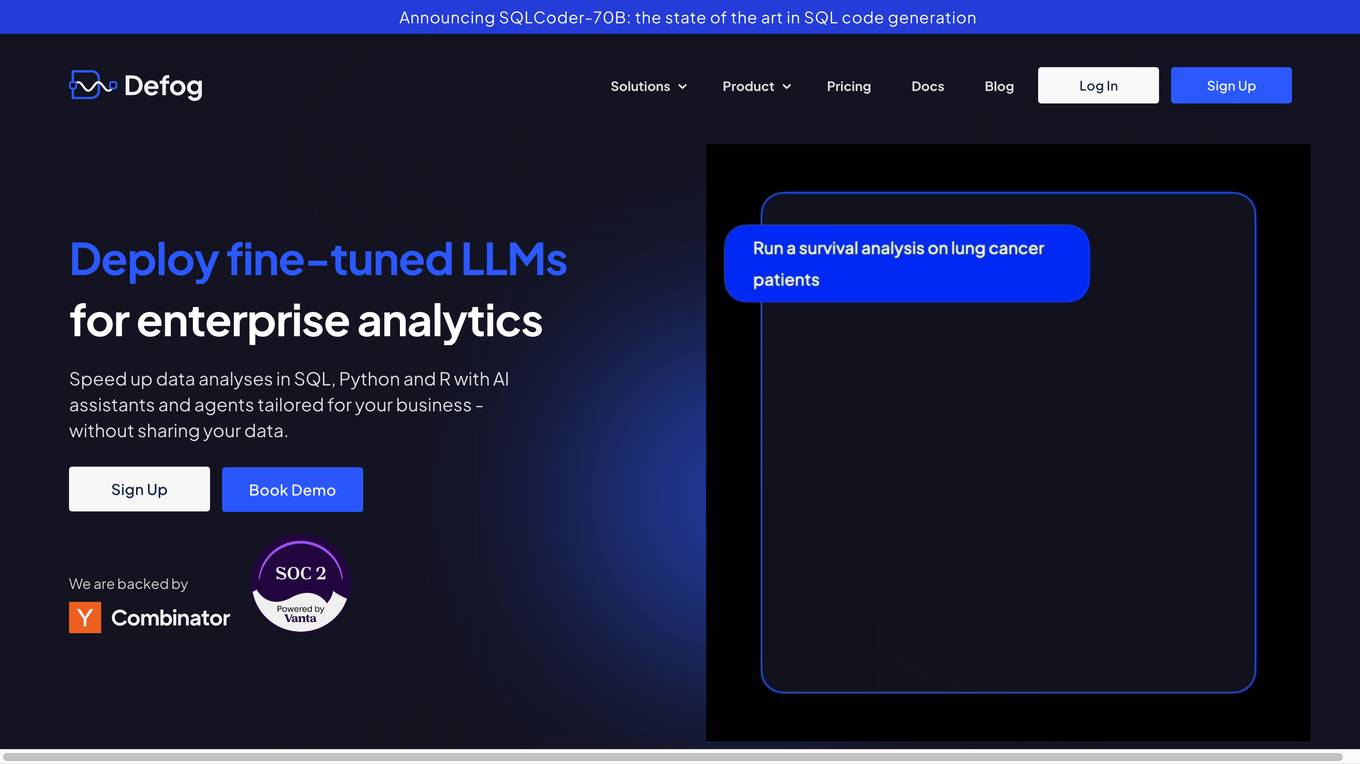
Defog.ai
Defog.ai provides fine-tuned AI models for enterprise SQL. It helps businesses speed up data analyses in SQL, Python, and R with AI assistants and agents tailored for their business - without sharing their data. Defog.ai's key features include the ability to ask questions of data in natural language, get results when needed, integrate with any SQL database or data warehouse, automatically visualize data as tables and charts, and fine-tune on your metadata to give results you can trust.
ExcelDashboard Ai
ExcelDashboard Ai is an AI tool that allows users to instantly convert Excel data into interactive dashboards. The tool simplifies the process of creating visually appealing and insightful dashboards without the need for complex coding or design skills. Users can easily upload their Excel files, customize the dashboard layout, and visualize data in a user-friendly format. ExcelDashboard Ai streamlines the dashboard creation process, saving time and effort for individuals and businesses looking to present data in a more engaging way.
AppFlowy
AppFlowy is an AI-powered workspace application designed to bring projects, wikis, and teams together. It offers features such as AI projects, tasks, templates, and sites, allowing users to achieve more without losing control of their data. With AppFlowy AI, users can get answers, write better, autofill tables, and unblock their work with intelligent insights and actionable items. The application is built for privacy, offering on-device AI capabilities and offline mode. AppFlowy is accessible, collaborative, and customizable, empowering users to organize and visualize data in a way that suits their needs.
One Data
One Data is an AI-powered data product builder that offers a comprehensive solution for building, managing, and sharing data products. It bridges the gap between IT and business by providing AI-powered workflows, lifecycle management, data quality assurance, and data governance features. The platform enables users to easily create, access, and share data products with automated processes and quality alerts. One Data is trusted by enterprises and aims to streamline data product management and accessibility through Data Mesh or Data Fabric approaches, enhancing efficiency in logistics and supply chains. The application is designed to accelerate business impact with reliable data products and support cost reduction initiatives with advanced analytics and collaboration for innovative business models.
Vizly
Vizly is an AI-powered data analysis tool that empowers users to make the most of their data. It allows users to chat with their data, visualize insights, and perform complex analysis. Vizly supports various file formats like CSV, Excel, and JSON, making it versatile for different data sources. The tool is free to use for up to 10 messages per month and offers a student discount of 50%. Vizly is suitable for individuals, students, academics, and organizations looking to gain actionable insights from their data.
Compact Data Science
Compact Data Science is a data science platform that provides a comprehensive set of tools and resources for data scientists and analysts. The platform includes a variety of features such as data preparation, data visualization, machine learning, and predictive analytics. Compact Data Science is designed to be easy to use and accessible to users of all skill levels.
ChartPixel
ChartPixel is an AI-assisted data analysis platform that empowers users to effortlessly generate charts, insights, and actionable statistics in just 30 seconds. The platform is designed to demystify data and analysis, making it accessible to users of all skill levels. ChartPixel combines the power of AI with domain expertise to provide secure and reliable output, ensuring trustworthy results without compromising data privacy. With user-friendly features and educational tools, ChartPixel helps users clean, wrangle, visualize, and present data with ease, catering to both beginners and professionals.
Data Science Dojo
Data Science Dojo is a globally recognized e-learning platform that offers programs in data science, data analytics, machine learning, and more. They provide comprehensive and hands-on training in various formats such as in-person, virtual instructor-led, and self-paced training. The focus is on helping students develop a think-business-first mindset to apply their data science skills effectively in real-world scenarios. With over 2500 enterprises trained, Data Science Dojo aims to make data science accessible to everyone.
Dot Analytics
Dot Analytics is a growth-focused data analytics agency that offers a wide range of services including data analytics, data engineering, data visualization, data science, big data analytics, AI consulting, and more. They specialize in providing analytics solutions for data-driven business managers seeking accuracy, statistics, and data to drive revenue growth. With over 6 years of experience, they offer tailored analytics solutions to optimize customer acquisition cost, lifetime value, average order value, and conversions. Dot Analytics partners with clients from various industries to provide transparent, maintenance, and optimization services.
Susterra
Susterra is an advanced analytics platform for Public Finance stakeholders, aiming to catalyze urban development by providing powerful insights. The platform integrates leading practices from academia, utilizes public data growth, and leverages technology and innovation, including ML and AI. Susterra offers solutions like TerraScore, TerraVision, TerraView, and Impact IQ, enabling sophisticated evaluation of public benefit programs across various sectors like Utilities, Education, Healthcare, and more. The platform also specializes in data visualization tools and is powered by Google Cloud.
Lychee
Lychee is an all-in-one data platform designed to streamline the data workflow process, from data collection to analysis, visualization, and sharing. It offers powerful features such as instant graph generation, AI data analysis, website deployment, social media sharing, and team collaboration. Lychee aims to simplify complex data tasks and help users make faster progress in their data-related projects.
ANDRE
ANDRE is an AI-powered Analytic Narrative Discovery & Reporting Engine that uncovers hidden narratives in raw data, providing valuable insights summarized in concise slides. It simplifies data analysis, making expert-level analysis accessible to all by slashing analysis time by up to 90%. The application blends advanced AI with analytical methods to deliver executive-level data stories. Users can import data from various sources and receive comprehensive reports with conclusions. ANDRE transforms complex data into clear insights and narratives, offering flexibility for automated analysis or user-driven exploration.
Groupt
Groupt is an AI-powered data categorization and analytics application that simplifies the process of transforming complex arrays of qualitative data into clear, actionable insights for enhanced decision-making. Users can upload CSV files containing data such as user feedback, survey responses, or any qualitative data to receive visualizations of response groupings, categories, and more. The application offers high accuracy and reliability in categorizing data, with a user-friendly interface and transparent pricing options.
1 - Open Source AI Tools
xln
XLN (Cross-Local Network) is a platform that enables instant off-chain settlement with on-chain finality. It combines Byzantine consensus, Bloomberg Terminal functionalities, and VR capabilities to run economic simulations in the browser without the need for a backend. The architecture includes layers for jurisdictions, entities, and accounts, with features like Solidity contracts, BFT consensus, and bilateral channels. The tool offers a panel system similar to Bloomberg Terminal for workspace organization and visualization, along with support for offline blockchain simulations in the browser and VR/Quest compatibility.
20 - OpenAI Gpts


Illuminous - The Data Exploration AI
Expert in data analysis, visualizations, and predictions.
Emmi Data Analysis and Visualizer
Expert in data analysis and visualization, offering clear explanations and guidance.
Eurostat Explorer
Explore & interpret the Eurostat database. Type in requests for statistics, also ask to visualize it. Works best wish specific datasets. It's meant for professionals familiar with the Eurostat database looking for a faster way to explore it.
OpenData Explorer
I'll help you access and understand open data published by central government, local authorities and public bodies. You can ask me in your native language.

Sheets Expert
Master the art of Google Sheets with an assistant who can do everything from answer questions about basic features, explain functions in an eloquent and succinct manner, simplify the most complex formulas into easy steps, and help you identify techniques to effectively visualize your data.
Open Data Italia bot
Fornisce informazioni sulla normativa italiana in materia di open data, con un tono professionale e divulgativo. In modo che sia più facile chiederne e/o pretenderne la pubblicazione.
Ticket Sales AI_MensBasketball
Data Analyst for USC Athletics Dept, specializes in SQL and ticket sales insights.
Time Tracker Visualizer (See Stats from Toggl)
I turn Toggl data into insightful visuals. Get your data from Settings (in Toggl Track) -> Data Export -> Export Time Entries. Ask for bonus analyses and plots :)
ReDev You v00400
Specialist in belief transformation using advanced NLP and visualization, now more powerful with a two-component structure.
City of Toronto Data Assistant
Data specialist for Toronto Government Data Platform insights