Best AI tools for< Visualize Data Chunks >
20 - AI tool Sites
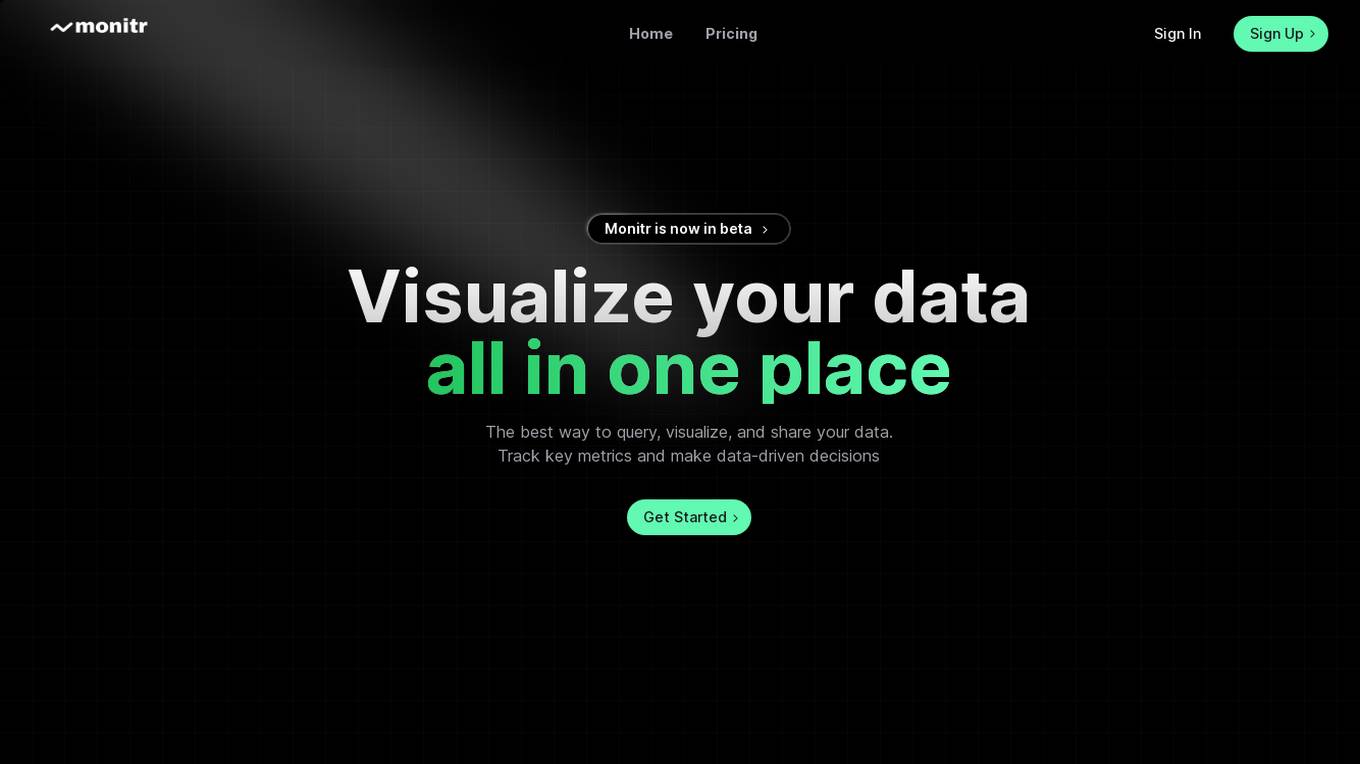
Monitr
Monitr is a data visualization and analytics platform that allows users to query, visualize, and share data in one place. It helps in tracking key metrics, making data-driven decisions, and breaking down data silos to provide a unified view of data from various sources. Users can create charts and dashboards, connect to different data sources like Postgresql and MySQL, and collaborate with teammates on SQL queries. Monitr's AI features are powered by Meta AI's Llama 3 LLM, enabling the development of powerful and flexible analytics tools for maximizing data utilization.
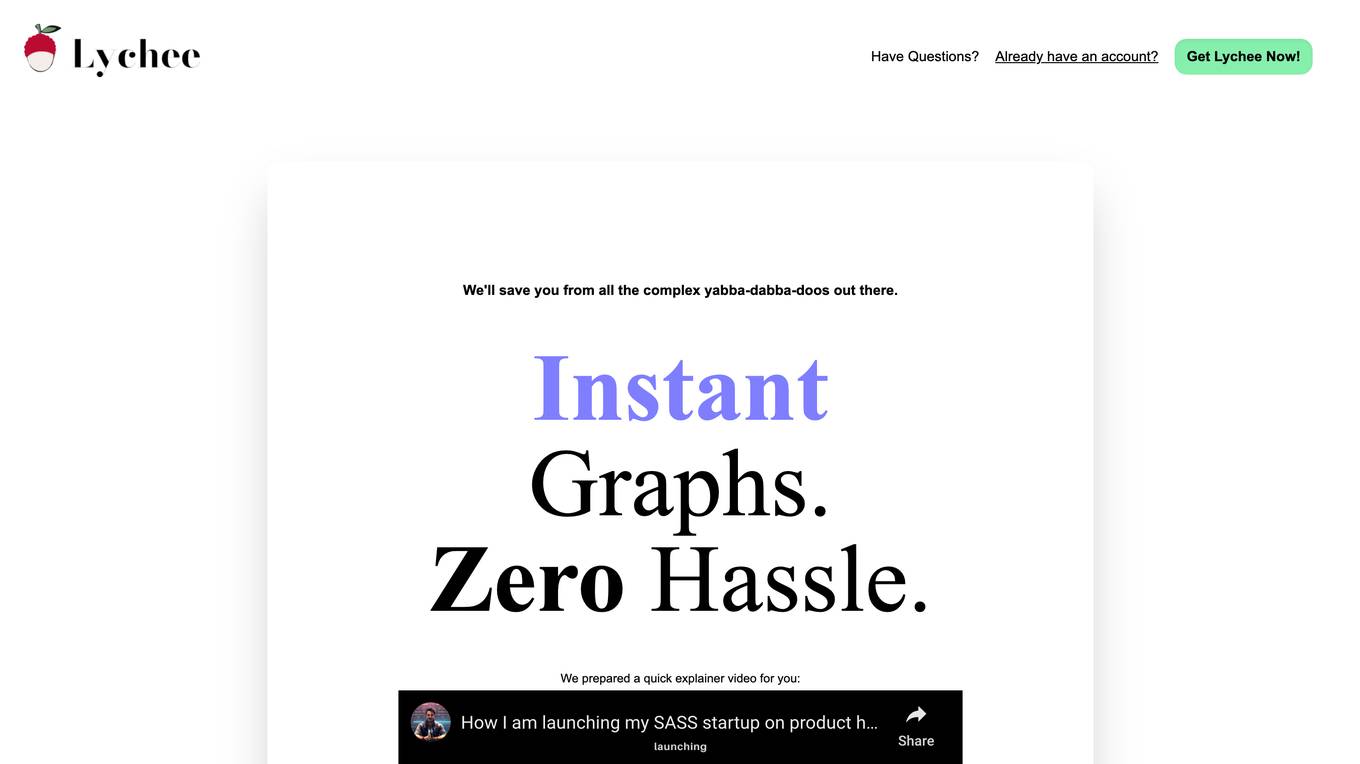
Lychee
Lychee is an all-in-one data platform designed to streamline the data workflow process, from data collection to analysis, visualization, and sharing. It offers powerful features such as instant graph generation, AI data analysis, website deployment, social media sharing, and team collaboration. Lychee aims to simplify complex data tasks and help users make faster progress in their data-related projects.
Compact Data Science
Compact Data Science is a data science platform that provides a comprehensive set of tools and resources for data scientists and analysts. The platform includes a variety of features such as data preparation, data visualization, machine learning, and predictive analytics. Compact Data Science is designed to be easy to use and accessible to users of all skill levels.
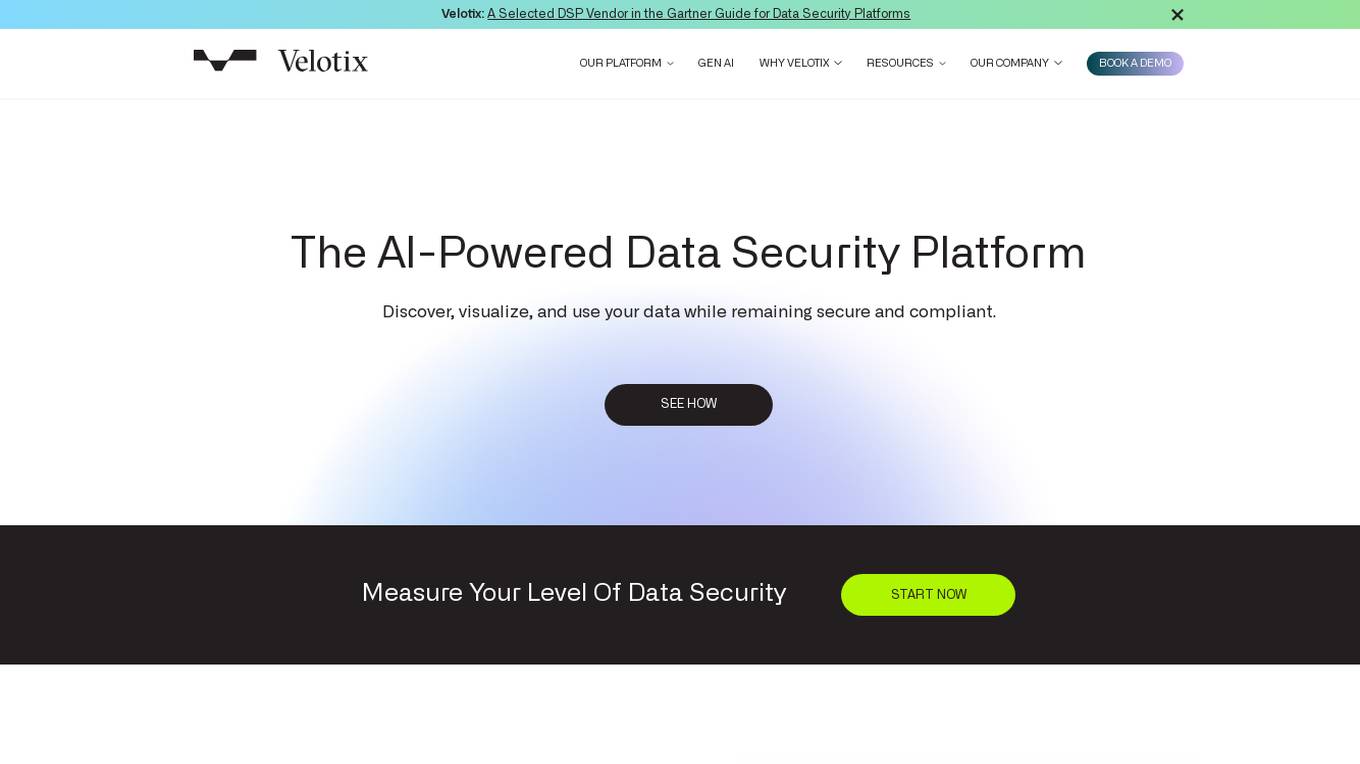
Velotix
Velotix is an AI-powered data security platform that offers groundbreaking visual data security solutions to help organizations discover, visualize, and use their data securely and compliantly. The platform provides features such as data discovery, permission discovery, self-serve data access, policy-based access control, AI recommendations, and automated policy management. Velotix aims to empower enterprises with smart and compliant data access controls, ensuring data integrity and compliance. The platform helps organizations gain data visibility, control access, and enforce policy compliance, ultimately enhancing data security and governance.
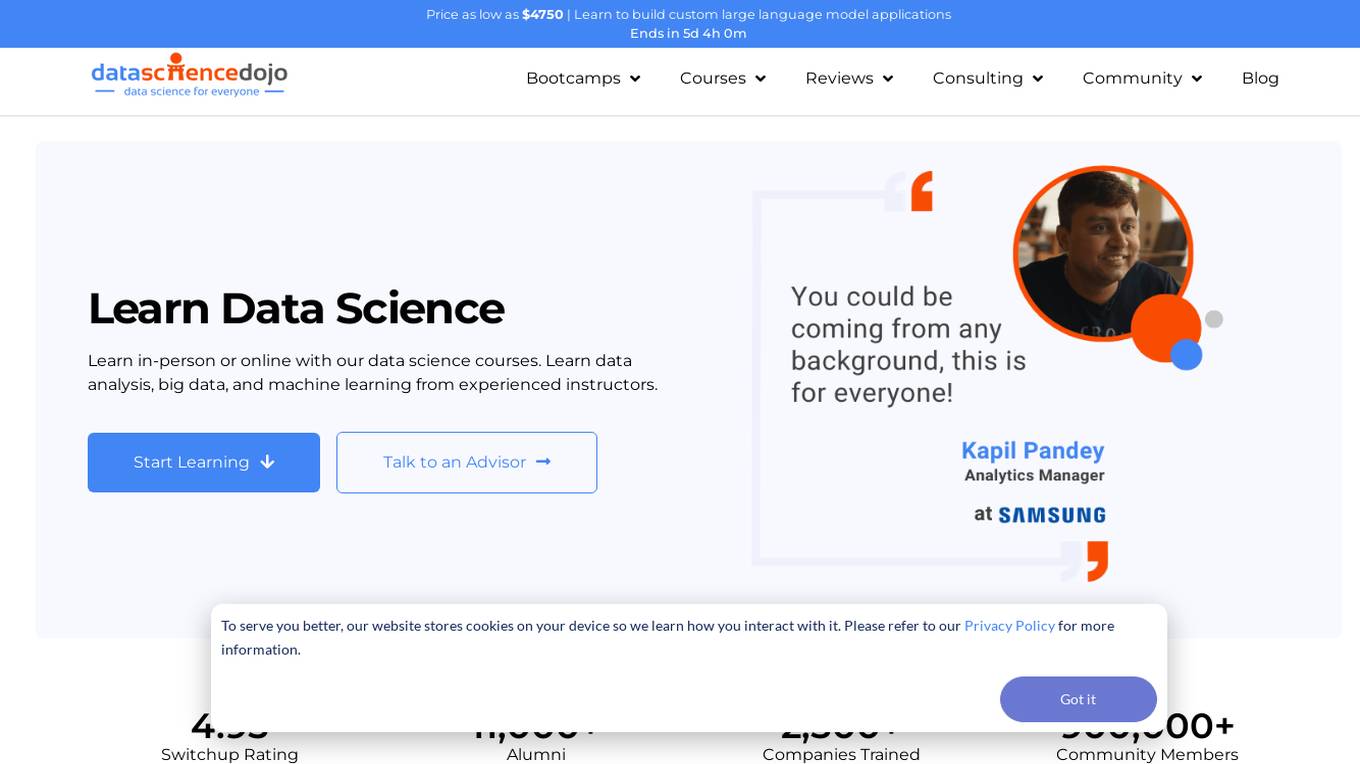
Data Science Dojo
Data Science Dojo is a globally recognized e-learning platform that offers programs in data science, data analytics, machine learning, and more. They provide comprehensive and hands-on training in various formats such as in-person, virtual instructor-led, and self-paced training. The focus is on helping students develop a think-business-first mindset to apply their data science skills effectively in real-world scenarios. With over 2500 enterprises trained, Data Science Dojo aims to make data science accessible to everyone.
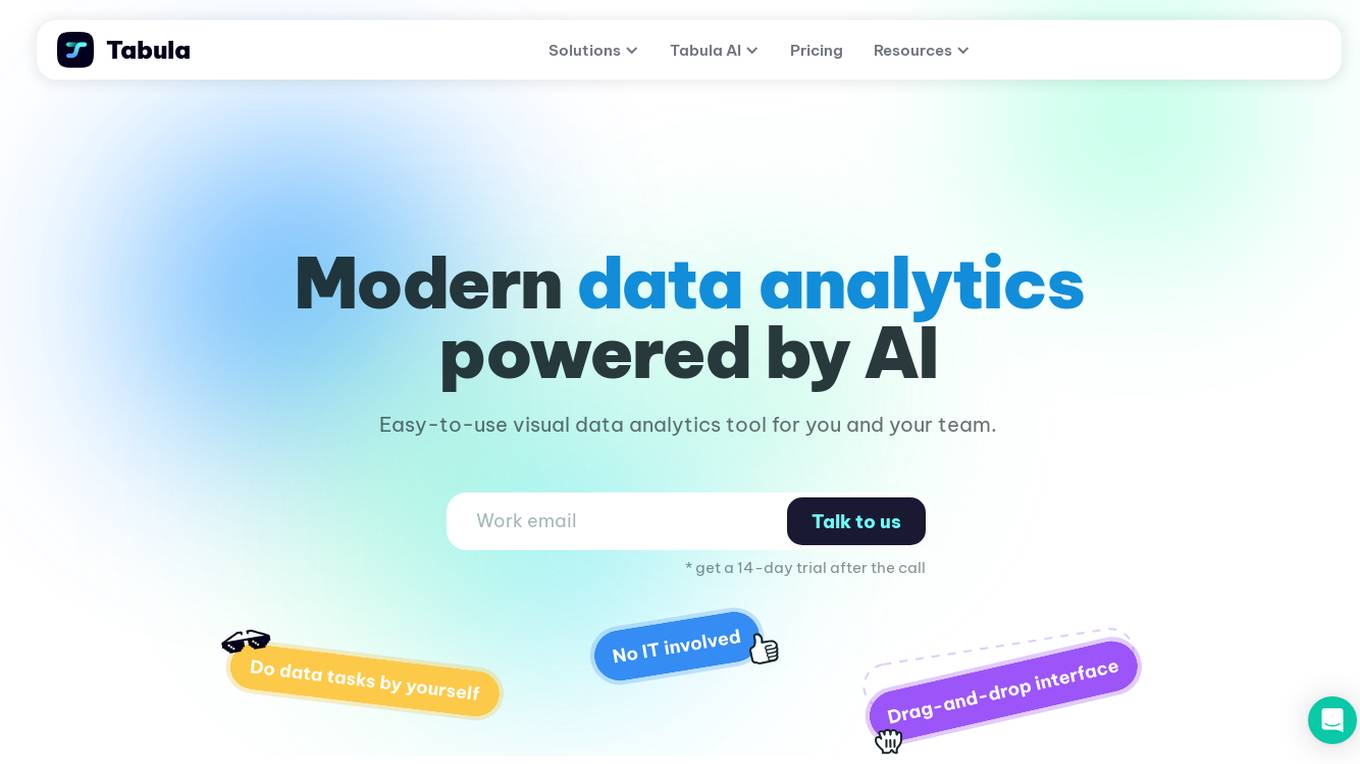
Tabula
Tabula is a visual data analytics tool that uses AI to help businesses get insights from their data. It is easy to use and can be used by anyone, regardless of their technical expertise. Tabula can be used to access and unify data from a variety of sources, standardize and blend datasets, add custom metrics, build stunning reports, and automate repetitive tasks. Tabula is integrated with a variety of data sources and platforms, making it easy to get started.
One Data
One Data is an AI-powered data product builder that offers a comprehensive solution for building, managing, and sharing data products. It bridges the gap between IT and business by providing AI-powered workflows, lifecycle management, data quality assurance, and data governance features. The platform enables users to easily create, access, and share data products with automated processes and quality alerts. One Data is trusted by enterprises and aims to streamline data product management and accessibility through Data Mesh or Data Fabric approaches, enhancing efficiency in logistics and supply chains. The application is designed to accelerate business impact with reliable data products and support cost reduction initiatives with advanced analytics and collaboration for innovative business models.
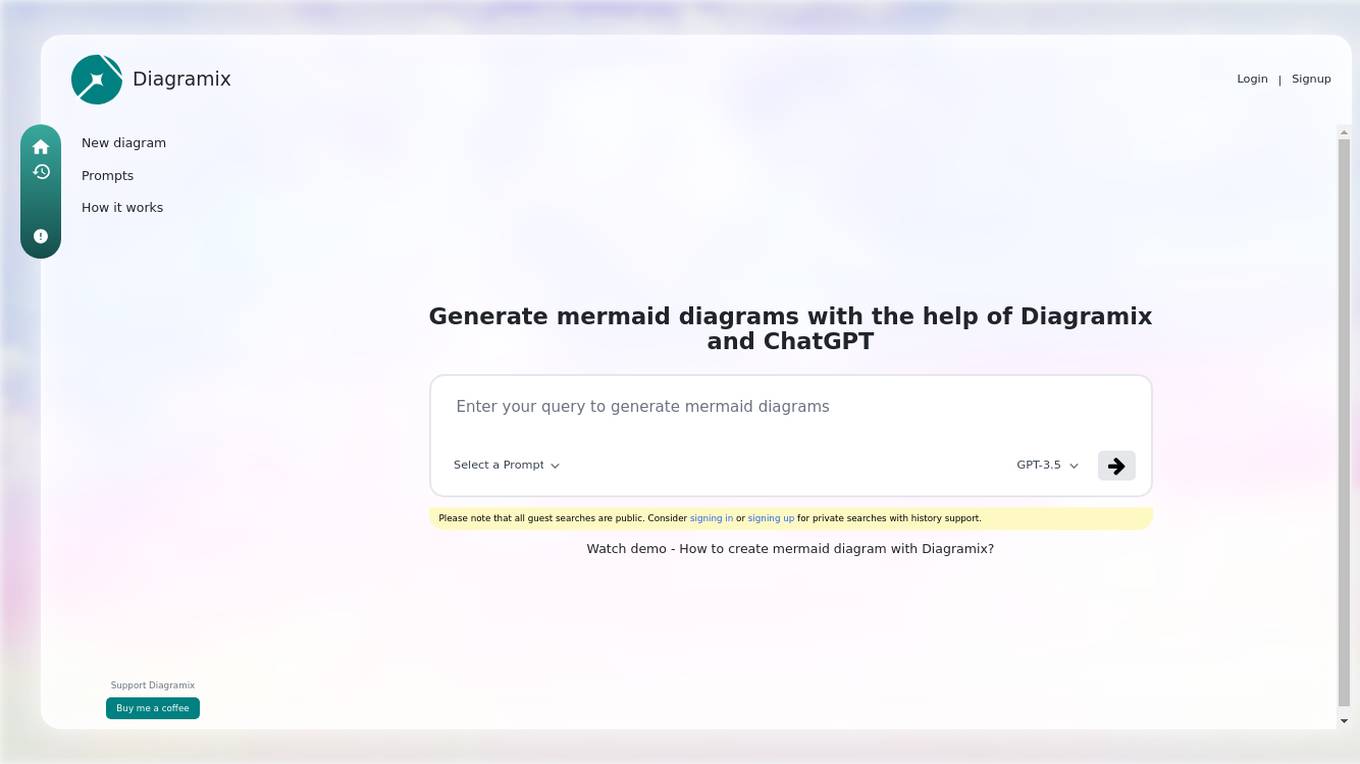
Diagramix
Diagramix is an AI-powered tool that allows users to generate various types of diagrams, such as sequence diagrams, flowcharts, state diagrams, ER diagrams, user journey diagrams, class diagrams, mind maps, and use case diagrams. Users can create these diagrams easily and efficiently with the help of Diagramix and ChatGPT. The tool provides a user-friendly interface for creating visual representations of complex systems and processes, making it ideal for professionals, students, and anyone who needs to visualize information.
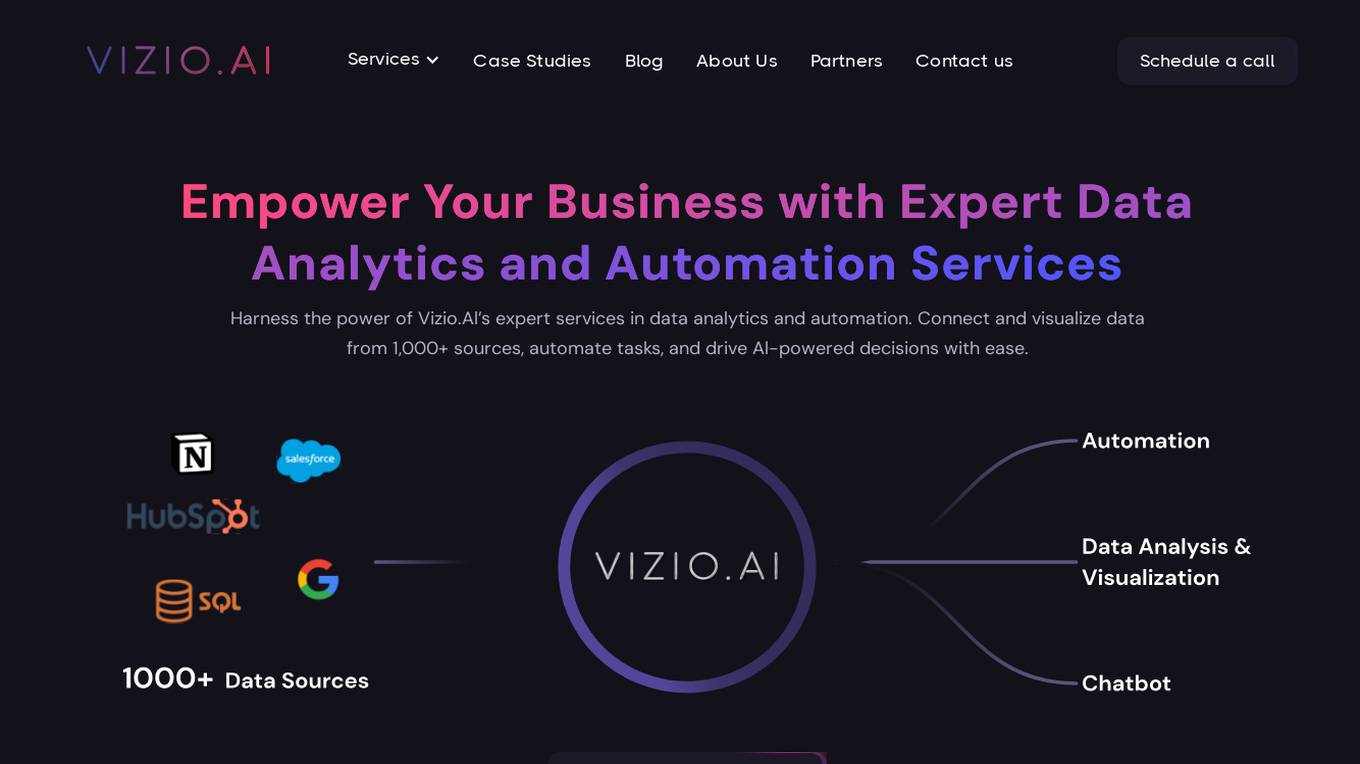
Vizio AI
Vizio AI is an advanced data analytics and automation services provider that empowers businesses with real-time data and AI insights. They offer services such as data app development, automated reporting, RPA bot development, dashboard development, and generative AI. Vizio AI collaborates with clients to connect and visualize data from various sources, automate tasks, and make AI-powered decisions with ease. Their expert data engineers and analysts work on data app development, dashboard creation, and RPA bot development to streamline business operations and enhance decision-making processes.
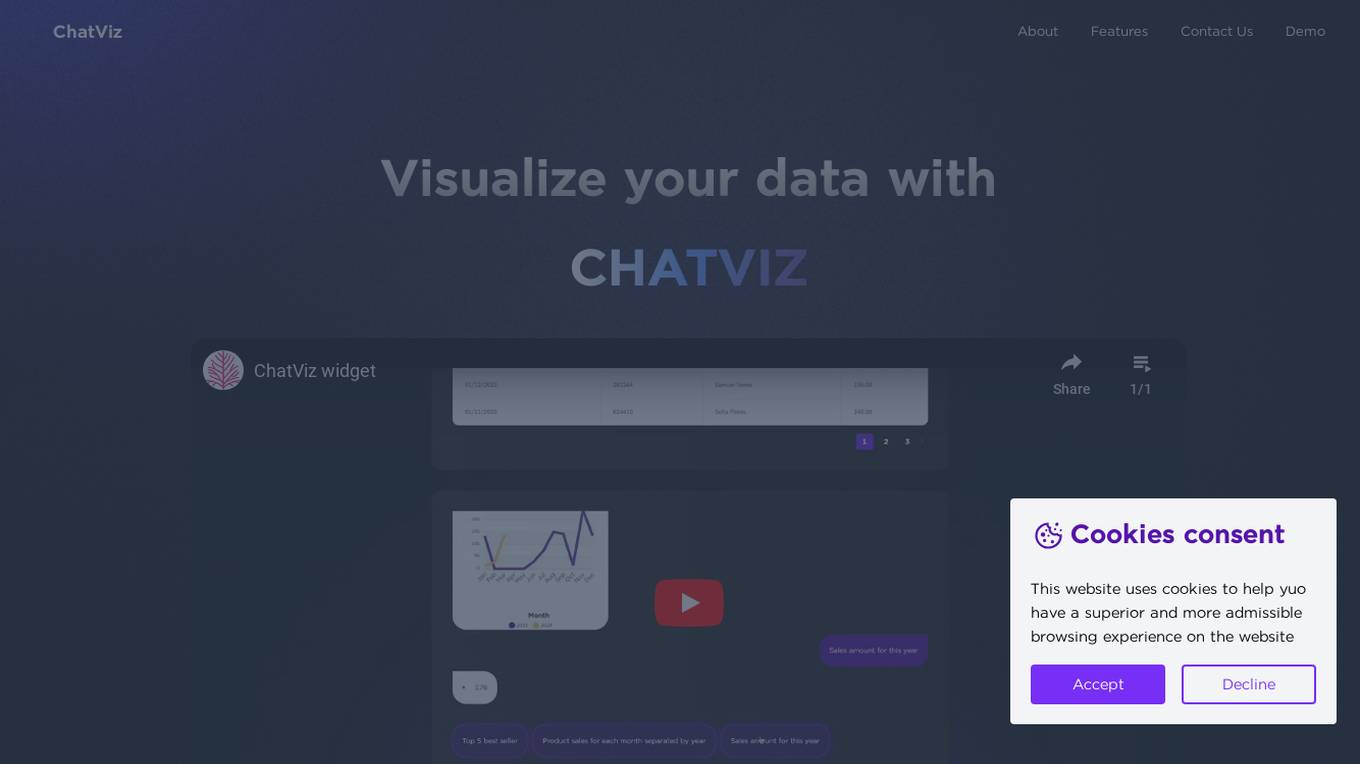
ChatViz
ChatViz is an AI-powered data visualization tool that leverages ChatGPT to enhance data visualization capabilities. It offers features such as SQL translator and chart suggestion to streamline the visualization process. By utilizing ChatViz, users can optimize development time, simplify data visualization, and say goodbye to dashboard complexity. The tool provides a new way to visualize data, reducing development time and improving user experience.
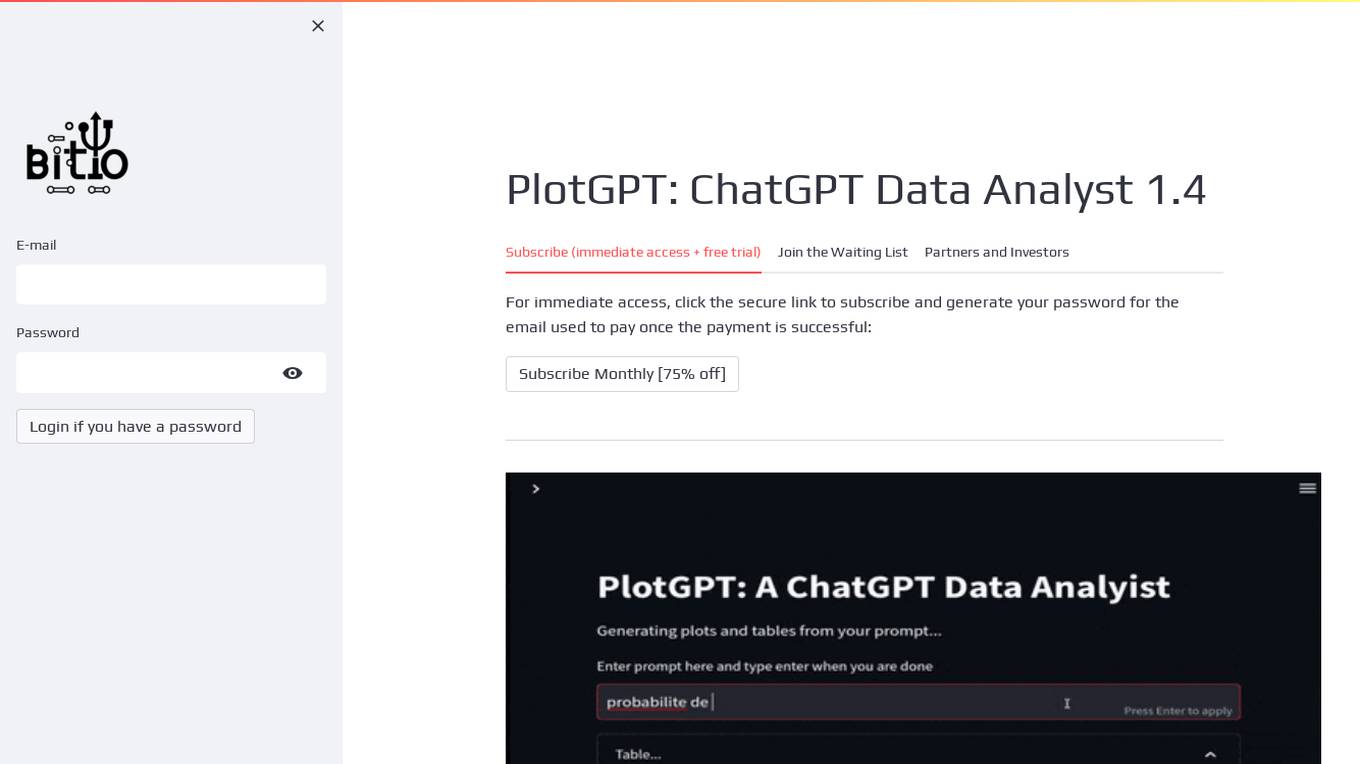
PlotGPT
PlotGPT is a data analyst that is available 24/7. It can help you with a variety of tasks, including data analysis, data visualization, and report generation. PlotGPT is easy to use and can be accessed from any device with an internet connection.
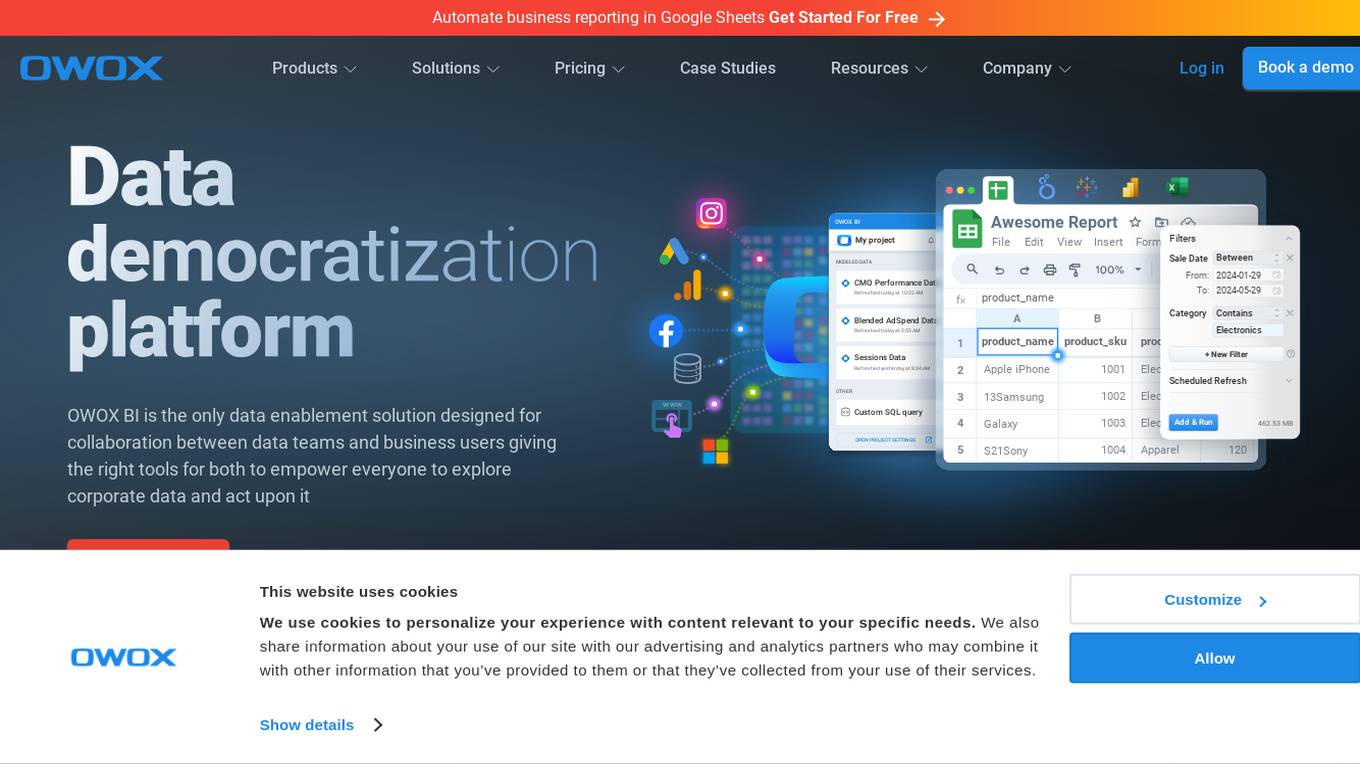
OWOX BI
OWOX BI is a leading data democratization platform that empowers businesses by automating business reporting in Google Sheets, simplifying data preparation with SQL and No SQL, and providing AI-powered solutions for marketing analytics. The platform offers features such as AI Copilot for faster SQL queries, Cookieless Analytics Tracking, Dashboard Templates, and integrations with Google Analytics, Google Sheets, BigQuery, and various ad platforms. OWOX BI enables users to centralize and automate marketing and sales data, visualize data with templates, and measure marketing performance effectively. The platform fosters collaboration between data teams and business users, ensuring data accuracy, reliability, and ownership.
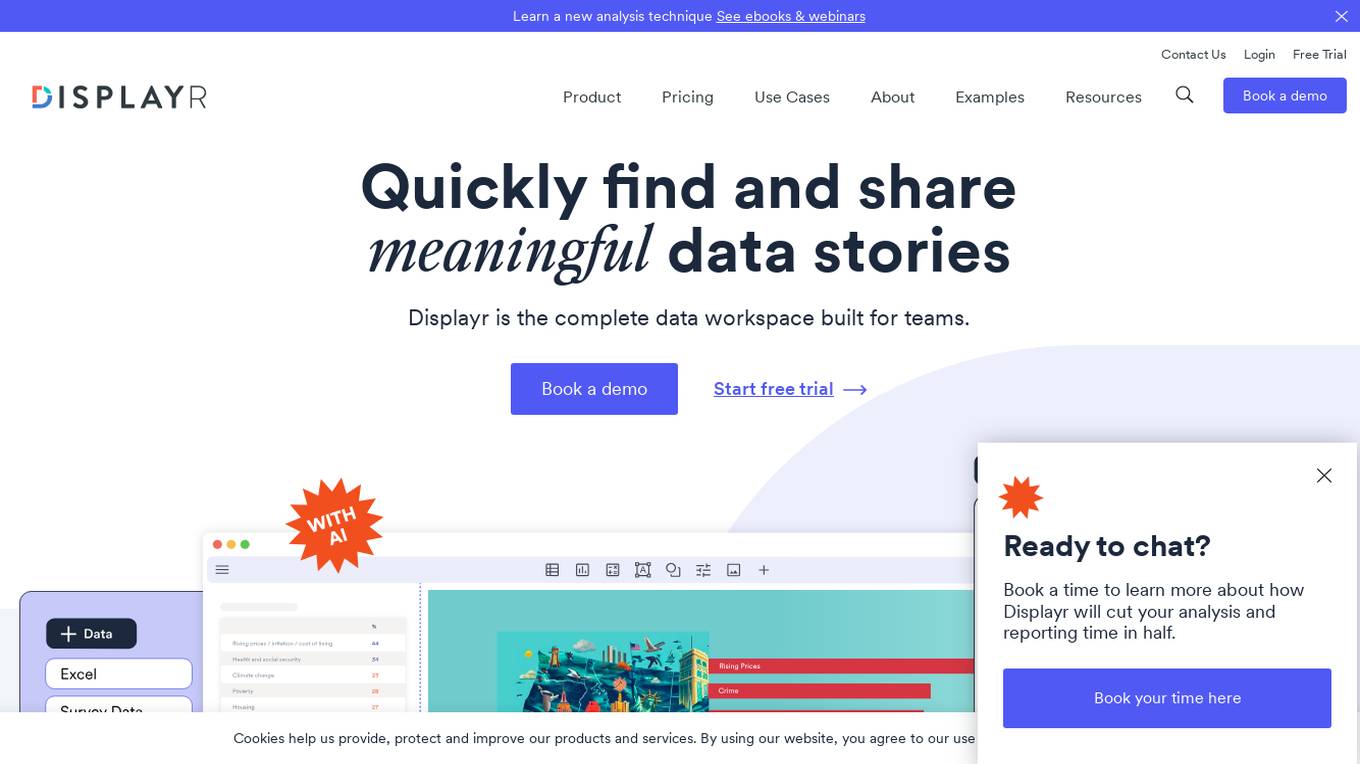
Displayr
Displayr is a comprehensive data workspace designed for teams, offering a range of capabilities including survey analysis, data visualization, dashboarding, automatic updating, PowerPoint reporting, finding data stories, and data cleaning. The platform aims to streamline workflow efficiency, promote self-sufficiency through DIY analytics, enable data storytelling with compelling narratives, and ensure quality control to minimize errors. Displayr caters to statisticians, market researchers, report creators, and professionals working with data, providing a user-friendly interface for creating interactive and insightful data stories.
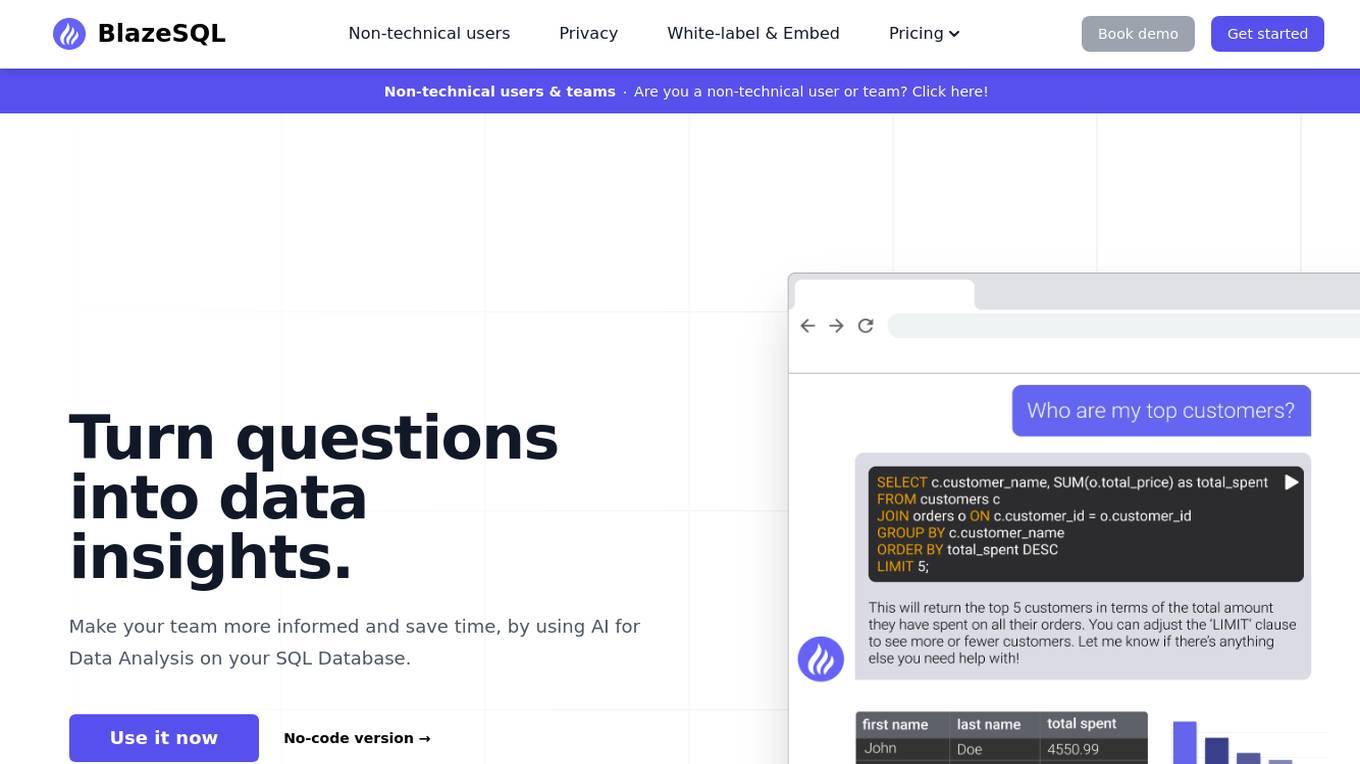
Blaze SQL AI
Blaze SQL AI is an AI Data Analytics chatbot and SQL generator that helps non-technical users and teams turn questions into data insights. It allows users to make their teams more informed and save time by using AI for Data Analysis on their SQL Database. Blaze SQL AI can write SQL code, run queries, visualize data, and provide database documentation. It is trusted by innovative teams and offers a private desktop version for secure data connections. The tool is designed to help users easily interact with their databases using natural language and generate complex SQL queries with the help of AI technology.
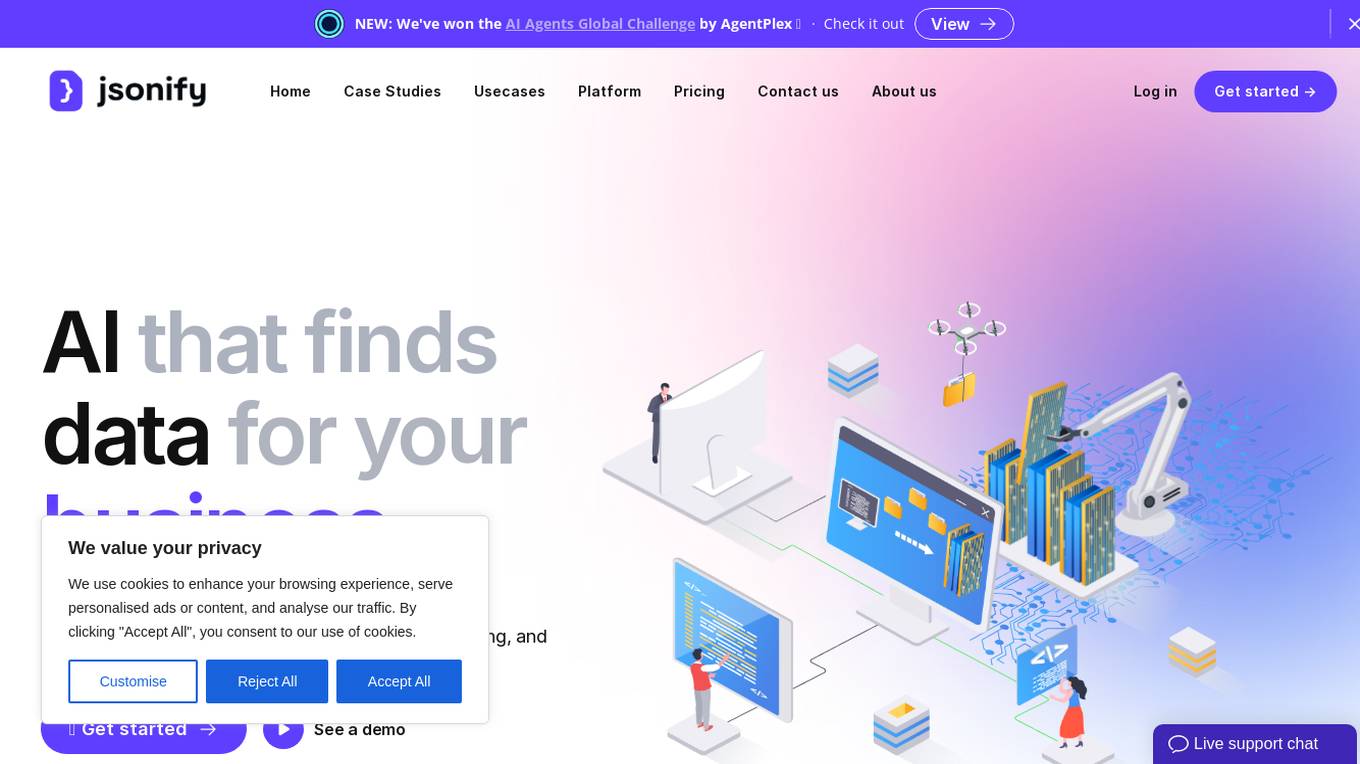
Jsonify
Jsonify is an AI tool that automates the process of exploring and understanding websites to find, filter, and extract structured data at scale. It uses AI-powered agents to navigate web content, replacing traditional data scrapers and providing data insights with speed and precision. Jsonify integrates with leading data analysis and business intelligence suites, allowing users to visualize and gain insights into their data easily. The tool offers a no-code dashboard for creating workflows and easily iterating on data tasks. Jsonify is trusted by companies worldwide for its ability to adapt to page changes, learn as it runs, and provide technical and non-technical integrations.

Genius Sheets
Genius Sheets is a self-service data reporting tool that allows users to connect to data in Excel and Google Sheets and generate reports without the need for SQL or Python. It is designed to be easy to use and provides enterprise-grade security. Genius Sheets is trusted by over 100 companies and has been featured in publications such as Forbes and TechCrunch.
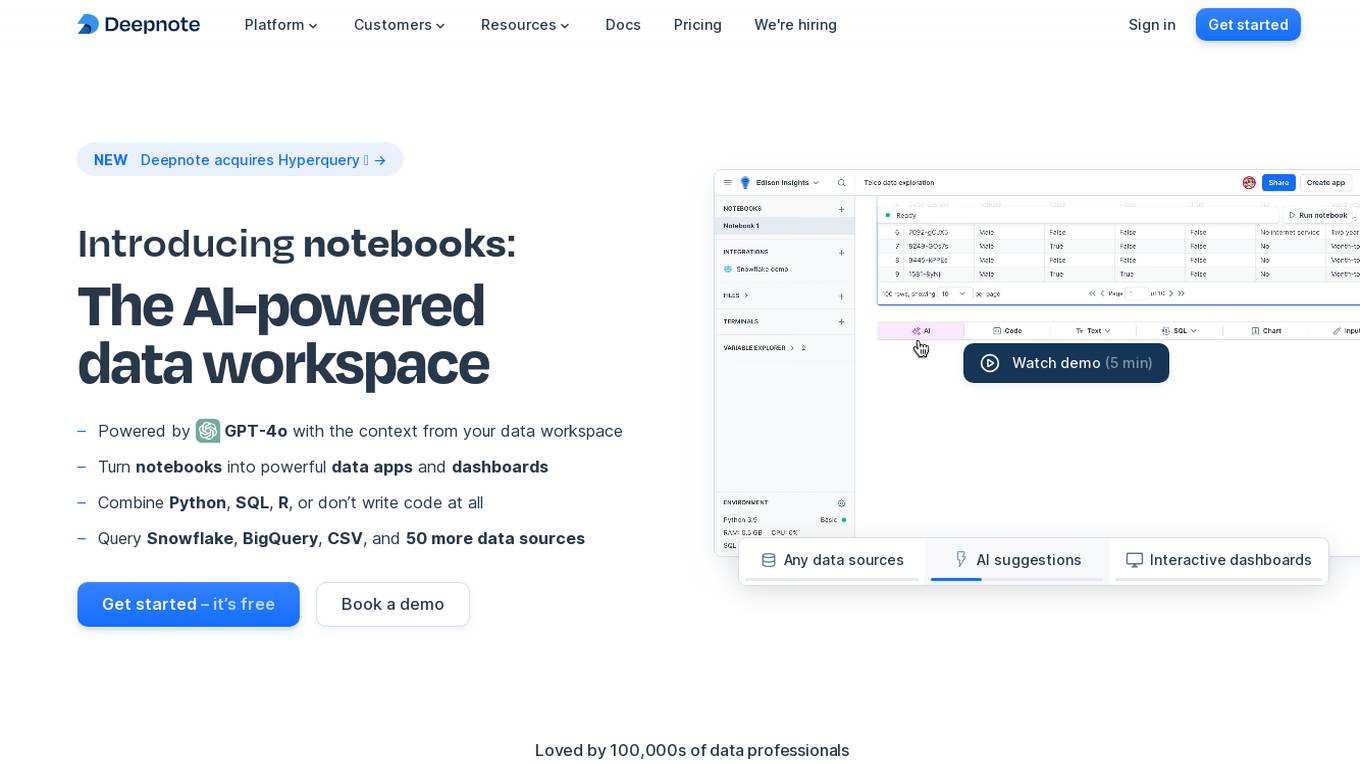
Deepnote
Deepnote is an AI-powered analytics and data science notebook platform designed for teams. It allows users to turn notebooks into powerful data apps and dashboards, combining Python, SQL, R, or even working without writing code at all. With Deepnote, users can query various data sources, generate code, explain code, and create interactive visualizations effortlessly. The platform offers features like collaborative workspaces, scheduling notebooks, deploying APIs, and integrating with popular data warehouses and databases. Deepnote prioritizes security and compliance, providing users with control over data access and encryption. It is loved by a community of data professionals and widely used in universities and by data analysts and scientists.
Chat2CSV
The website offers an AI-powered tool for easy data visualization through natural language commands. Users can transform CSV data into various charts without the need for complex coding. The platform provides a wide range of chart types, smart AI support, and prioritizes data security and privacy. It simplifies data visualization tasks, making it intuitive and versatile for users to create visual insights effortlessly.
Chat2DB
Chat2DB is an AI-driven data management platform that helps users query, edit, analyze, and visualize data. It integrates data management, development, analysis, and application all in one platform. Chat2DB's AI technology enables users to easily handle SQL, generate database data, and test efficiently. It also provides intelligent reports and data exploration features that allow users to interact with data using natural language.
Airwiz
Airwiz is an AI data analyst tool designed to revolutionize data analysis experiences for users of Airtable. It enables users to perform complex data analysis tasks without the need for coding skills. By simply asking questions, users can gain valuable insights and make informed decisions based on their data. Airwiz simplifies the data analysis process, making it accessible to a wider audience.
1 - Open Source AI Tools
simba
Simba is an open source, portable Knowledge Management System (KMS) designed to seamlessly integrate with any Retrieval-Augmented Generation (RAG) system. It features a modern UI and modular architecture, allowing developers to focus on building advanced AI solutions without the complexities of knowledge management. Simba offers a user-friendly interface to visualize and modify document chunks, supports various vector stores and embedding models, and simplifies knowledge management for developers. It is community-driven, extensible, and aims to enhance AI functionality by providing a seamless integration with RAG-based systems.
20 - OpenAI Gpts
Illuminous - The Data Exploration AI
Expert in data analysis, visualizations, and predictions.
Emmi Data Analysis and Visualizer
Expert in data analysis and visualization, offering clear explanations and guidance.
Eurostat Explorer
Explore & interpret the Eurostat database. Type in requests for statistics, also ask to visualize it. Works best wish specific datasets. It's meant for professionals familiar with the Eurostat database looking for a faster way to explore it.
City of Toronto Data Assistant
Data specialist for Toronto Government Data Platform insights
Data Engineer
A Data Engineer assistant offering advice on data pipelines and data-related tasks.
Data Analysis Report Creator
Creates full DOCX data analysis reports with integrated visualizations
D.A.A. | Data Action Assistant
Advanced assistant for data publication and subscription guidance, with enhanced contextual understanding and technical integration.
Plotter
Provide a hand-drawing or screenshot of your desired plot along with the data and I'll make the plot.
OpenData Explorer
I'll help you access and understand open data published by central government, local authorities and public bodies. You can ask me in your native language.
Vicky Vega
Generates Vega-Lite JSON code for Power BI visuals from data and descriptions.