Best AI tools for< Visualize Analysis Results >
20 - AI tool Sites
Cybertiks
Cybertiks is an AI-powered platform that offers remote monitoring and analysis of agriculture fields using satellite imagery. The platform provides valuable insights such as soil nutrients and texture, tailored AI models for accurate metrics, historical data analysis, and visualization of results on a map. Cybertiks integrates various data sources, including optical and radar data, to deliver comprehensive and strategic information to clients. The platform utilizes quantum-enabled artificial intelligence for material detection, classification, and quantification. With a focus on tailored solutions, Cybertiks empowers clients with expert knowledge in agriculture, artificial intelligence, and software development.
Hepta AI
Hepta AI is an AI-powered statistics tool designed for scientific research. It simplifies the process of statistical analysis by allowing users to easily input their data and receive comprehensive results, including tables, graphs, and statistical analysis. With a focus on accuracy and efficiency, Hepta AI aims to streamline the research process for scientists and researchers, providing valuable insights and data visualization. The tool offers a user-friendly interface and advanced AI algorithms to deliver precise and reliable statistical outcomes.
GaitAnalyzer.health
GaitAnalyzer.health is a web application designed to analyze and assess human gait patterns for healthcare professionals and researchers. The platform utilizes advanced algorithms to process gait data captured through various sensors and devices, providing valuable insights into gait abnormalities and biomechanical characteristics. Users can upload gait data, visualize results, and generate detailed reports to aid in diagnosis and treatment planning. GaitAnalyzer.health aims to improve the understanding of human movement patterns and enhance the quality of care in the field of biomechanics and rehabilitation.
ChartPixel
ChartPixel is an AI-assisted data analysis platform that empowers users to effortlessly generate charts, insights, and actionable statistics in just 30 seconds. The platform is designed to demystify data and analysis, making it accessible to users of all skill levels. ChartPixel combines the power of AI with domain expertise to provide secure and reliable output, ensuring trustworthy results without compromising data privacy. With user-friendly features and educational tools, ChartPixel helps users clean, wrangle, visualize, and present data with ease, catering to both beginners and professionals.
Defog.ai
Defog.ai provides fine-tuned AI models for enterprise SQL. It helps businesses speed up data analyses in SQL, Python, and R with AI assistants and agents tailored for their business - without sharing their data. Defog.ai's key features include the ability to ask questions of data in natural language, get results when needed, integrate with any SQL database or data warehouse, automatically visualize data as tables and charts, and fine-tune on your metadata to give results you can trust.
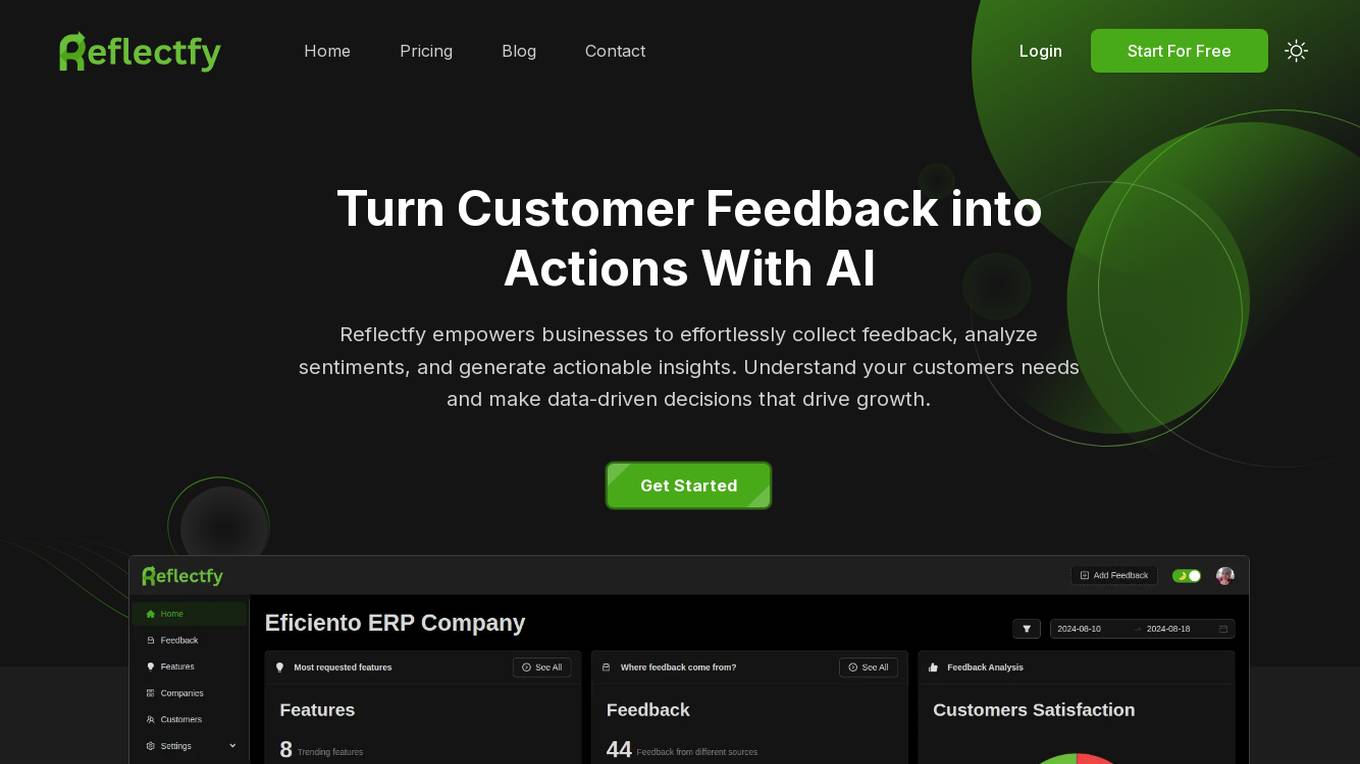
Reflectfy
Reflectfy is an AI-powered feedback tool that enables businesses to collect customer feedback, analyze sentiments, and generate actionable insights. It offers a comprehensive dashboard to visualize data, AI-powered sentiment analysis, customizable properties, and user management features. Reflectfy helps businesses make data-driven decisions to enhance customer experience and drive growth.

HoloEye.AI
HoloEye.AI is a transformative AI biological intelligence company that leverages cutting-edge artificial intelligence technology to revolutionize the field of biological research. The platform offers advanced AI solutions for analyzing complex biological data, enabling researchers to gain deeper insights and accelerate scientific discoveries.

Julius AI
Julius AI is an advanced AI data analyst tool that allows users to analyze data with computational AI, chat with files to get expert-level insights, create sleek data visualizations, perform modeling and predictive forecasting, solve math, physics, and chemistry problems, generate polished analyses and summaries, save time by automating data work, and unlock statistical modeling without complexity. It offers features like generating visualizations, asking data questions, effortless cleaning, instant data export, creating animations, and supercharging data analysis. Julius AI is loved by over 1,200,000 users worldwide and is designed to help knowledge workers make the most out of their data.
Vizly
Vizly is an AI-powered data analysis tool that empowers users to make the most of their data. It allows users to chat with their data, visualize insights, and perform complex analysis. Vizly supports various file formats like CSV, Excel, and JSON, making it versatile for different data sources. The tool is free to use for up to 10 messages per month and offers a student discount of 50%. Vizly is suitable for individuals, students, academics, and organizations looking to gain actionable insights from their data.
SheetBot AI
SheetBot AI is an AI data analyst tool that enables users to analyze data quickly without the need for coding. It automates repetitive and time-consuming data tasks, making data visualization and analysis more efficient. With SheetBot AI, users can generate accurate and visually appealing graphs in seconds, streamlining the data analysis process.
Super AI
Super AI is a generative AI tool designed as a copilot for data analysts. It is trained by top-tier product company experts and domain experts to provide unparalleled expertise in research, visualization, and data delivery. The tool goes beyond data processing by generating a comprehensive Business Decision Canvas tailored to specific challenges. Super AI offers guided insights, data modeling suggestions, and effortless integration with legacy BI systems. It is designed to convert business requirements into concrete objectives and is supported by a team of domain experts to mentor the AI. With applications in various industries, Super AI accelerates the process of finding business KPIs and generating data stories with expert intelligence.
Prosetta
Prosetta is an advanced AI tool designed to assist users in analyzing and extracting insights from large datasets. It utilizes cutting-edge machine learning algorithms to provide accurate predictions and recommendations. With Prosetta, users can streamline their data analysis process, uncover hidden patterns, and make data-driven decisions with confidence. The tool offers a user-friendly interface, making it accessible to both data experts and beginners. Prosetta is a versatile solution suitable for various industries, including finance, healthcare, marketing, and more.
Airwiz
Airwiz is an AI data analyst tool designed to revolutionize data analysis experiences for users of Airtable. It enables users to perform complex data analysis tasks without the need for coding skills. By simply asking questions, users can gain valuable insights and make informed decisions based on their data. Airwiz simplifies the data analysis process, making it accessible to a wider audience.
Lazy Admin
Lazy Admin is an AI-powered quick reporting and data analysis tool designed to revolutionize data engagement by providing real-time responses to human language queries. It enables smart reporting and faster decision-making by leveraging the power of AI. With features like data protection, AI-powered data analysis, export and share capabilities, and customizable options, Lazy Admin aims to streamline productivity and enhance data insights for businesses. The tool ensures data privacy and security while offering efficient search management and visualization of data through charts. Lazy Admin is suitable for Salesforce users and custom applications, offering a range of pricing plans to cater to different business needs.
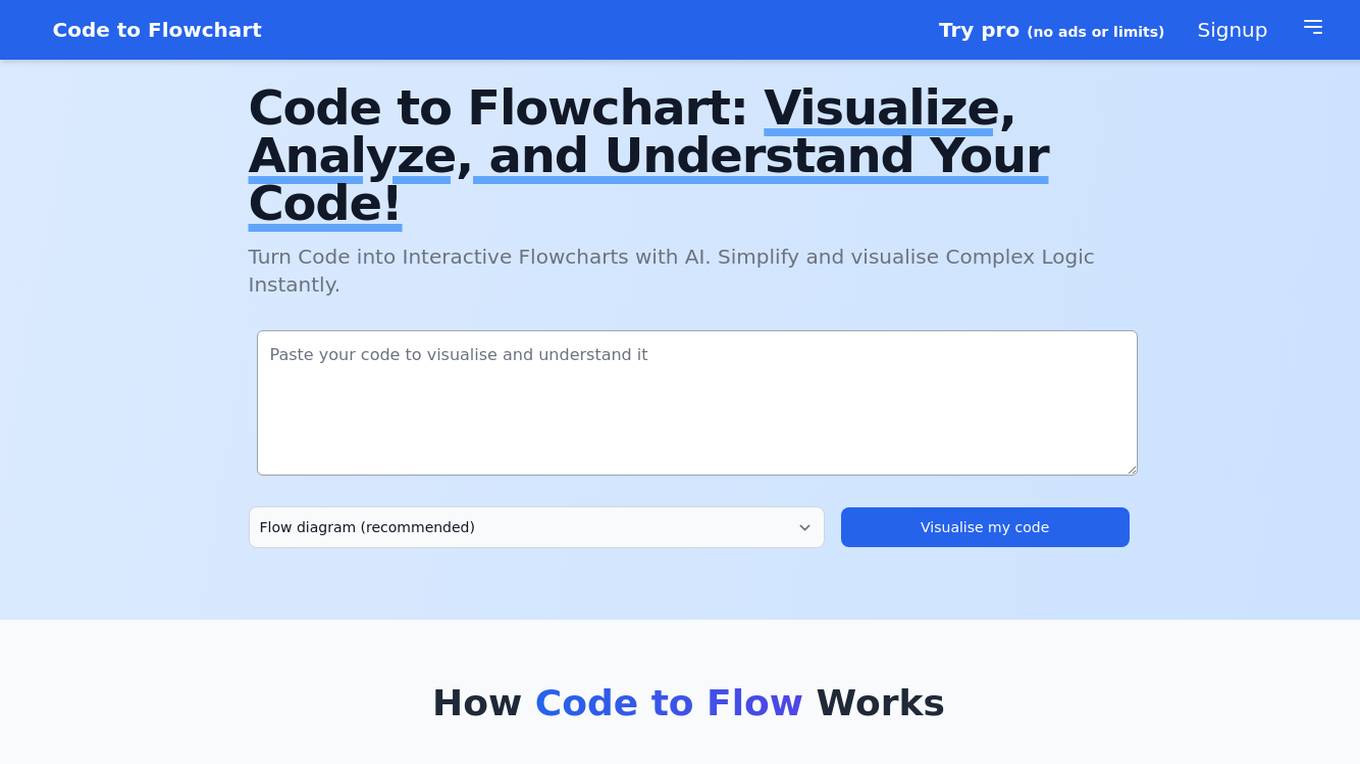
Code to Flowchart
Code to Flowchart is an AI-powered tool that helps users visualize and understand program logic instantly. It allows users to convert code into interactive flowcharts with the help of AI analysis. The tool supports all major programming languages, identifies code paths and logic flows, and offers multiple visualization options like flowcharts, sequence diagrams, and class diagrams. Users can export diagrams in various formats and customize color schemes and themes. Code to Flowchart aims to simplify complex code structures and enhance collaboration among developers.
LatenceTech
LatenceTech is a tech startup that specializes in network latency monitoring and analysis. The platform offers real-time monitoring, prediction, and in-depth analysis of network latency using AI software. It provides cloud-based network analytics, versatile network applications, and data science-driven network acceleration. LatenceTech focuses on customer satisfaction by providing full customer experience service and expert support. The platform helps businesses optimize network performance, minimize latency issues, and achieve faster network speed and better connectivity.
Vilosia
Vilosia is an AI-powered platform that helps medium and large enterprises with internal development teams to visualize their software architecture, simplify migration, and improve system modularity. The platform uses Gen AI to automatically add event triggers to the codebase, enabling users to understand data flow, system dependencies, domain boundaries, and external APIs. Vilosia also offers AI workflow analysis to extract workflows from function call chains and identify database usage. Users can scan their codebase using CLI client & CI/CD integration and stay updated with new features through the newsletter.

GoAI
GoAI is an AI-powered stock analysis and trading signals platform that provides investment ideas and opportunities to users. It uses advanced AI algorithms to scan and analyze market data, identifying high-conviction alpha opportunities and portfolio risks 24/7. GoAI helps investors stay ahead of the market by alerting them to potential moves before they happen, saving time and effort in research and analysis. The platform offers detailed insights, real-time market data, and event analysis to help users make informed investment decisions.
Cognify Insights
Cognify Insights is an AI-powered research assistant that provides instant understanding of online content such as text, diagrams, tables, and graphs. With a simple drag and drop feature, users can quickly analyze any type of content without leaving their browsing tab. The tool offers valuable insights and helps users unlock information efficiently.
Rerun
Rerun is an SDK, time-series database, and visualizer for temporal and multimodal data. It is used in fields like robotics, spatial computing, 2D/3D simulation, and finance to verify, debug, and explain data. Rerun allows users to log data like tensors, point clouds, and text to create streams, visualize and interact with live and recorded streams, build layouts, customize visualizations, and extend data and UI functionalities. The application provides a composable data model, dynamic schemas, and custom views for enhanced data visualization and analysis.
1 - Open Source AI Tools
gis-mcp
This repository contains a Geographic Information System (GIS) tool for performing Minimum Cumulative Path (MCP) analysis. The tool allows users to calculate the optimal path that minimizes cumulative cost between multiple locations on a map. It is particularly useful for urban planning, transportation route optimization, and environmental impact assessment. The tool supports various cost functions such as distance, travel time, and resource consumption, providing flexibility for different applications. Users can visualize the results on interactive maps and export the analysis outputs for further processing. The tool is implemented in Python and leverages popular GIS libraries such as GeoPandas and NetworkX for efficient spatial analysis.
20 - OpenAI Gpts
Emmi Data Analysis and Visualizer
Expert in data analysis and visualization, offering clear explanations and guidance.
Maurice
Your go-to for designing, analyzing, and recording experiments, and generate your lab report.
Data Analysis Report Creator
Creates full DOCX data analysis reports with integrated visualizations
Illuminous - The Data Exploration AI
Expert in data analysis, visualizations, and predictions.
Dream Visualizer(Представьте себе сон ночью)
Visualize your dreams at night.밤에 꾼 꿈을 시각화 해드립니다..จินตนาการความฝันของคุณในเวลากลางคืน.夜の夢を視覚化する.रात में अपने सपनों को दिखाएं.Hãy hình dung giấc mơ của bạn vào ban đêm.Bayangkan mimpimu di malam hari.在夜間可視化您的夢境

Sommelier de dados
Opa! Cole o texto da sua reportagem ou trecho para que eu possa analisá-la com base em manuais de uso de dados em textos jornalísticos.