Best AI tools for< Share Visualizations >
20 - AI tool Sites
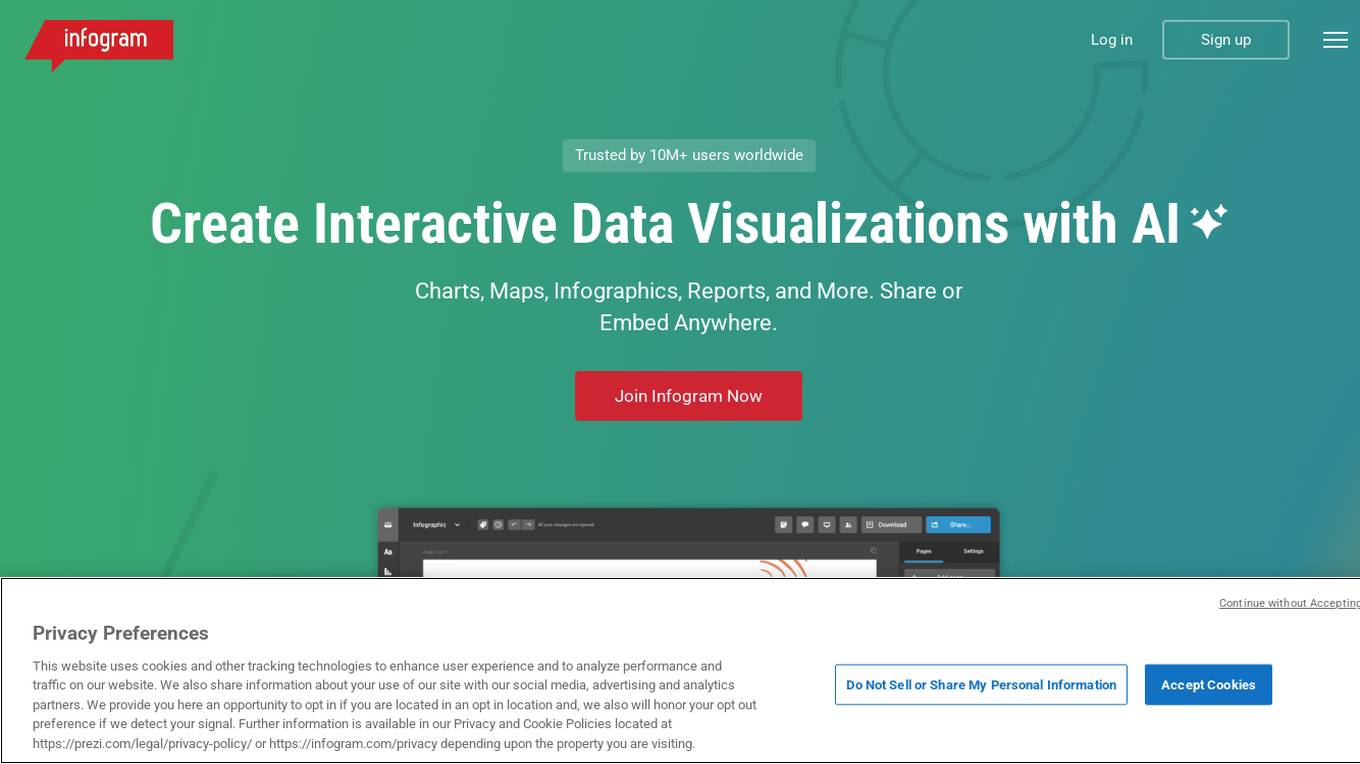
Infogram
Infogram is an AI-powered platform that enables users to create interactive data visualizations, infographics, reports, maps, charts, tables, slides, and dashboards effortlessly. With a wide range of features such as AI chart recommendations, interactive content, embeds, custom maps, data import, and advanced editing tools, Infogram empowers users to craft compelling visual stories. The platform also offers content engagement analytics, real-time collaboration, and a brand kit for consistent branding. Trusted by over 10 million users worldwide, Infogram is a go-to tool for individuals, teams, and organizations looking to transform data into engaging visuals.
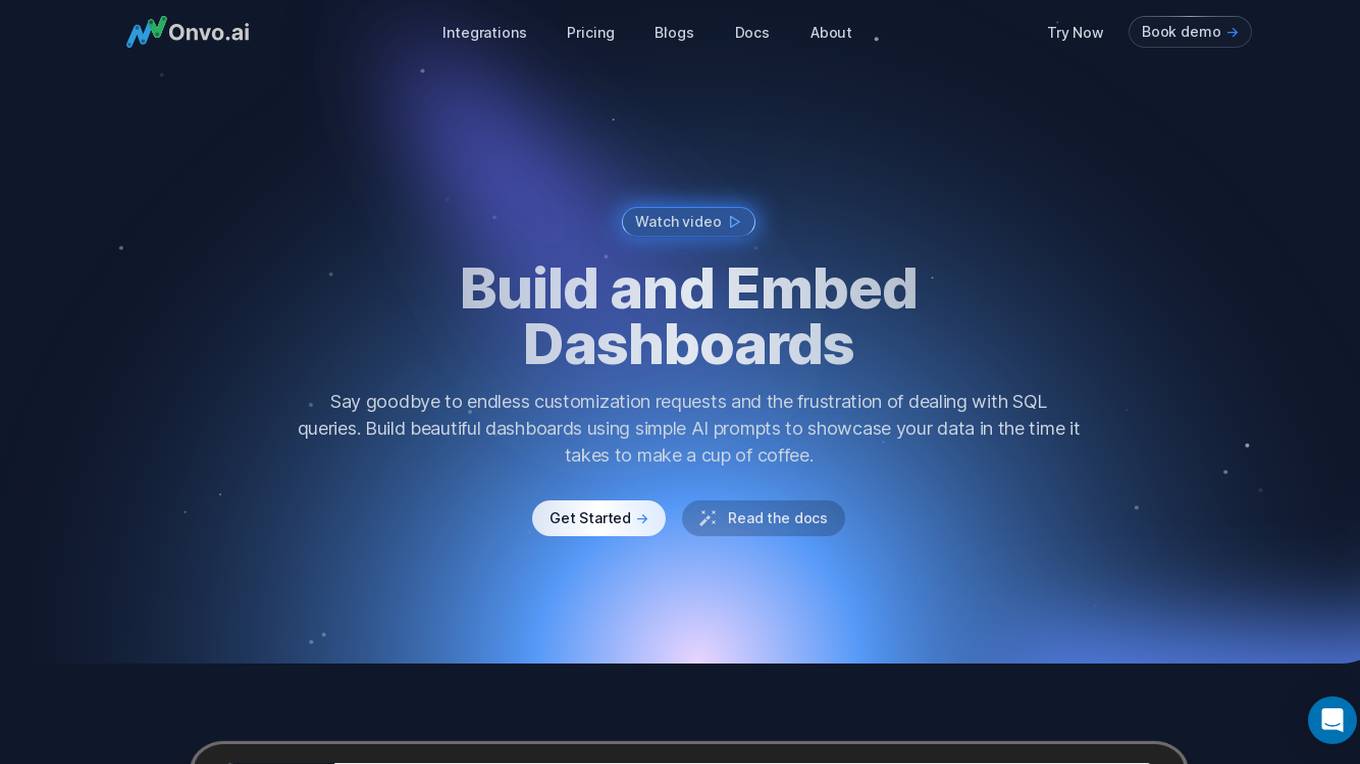
Onvo AI
Onvo AI is an embedded data visualization platform that allows users to create interactive dashboards and data visualizations using simple AI prompts. It connects to various data sources, enabling users to build insightful charts and visualizations without the need for complex queries or manual data manipulation. Onvo AI offers customization options, allowing users to match their brand's identity and provides secure sharing and embedding features. It also includes analytics capabilities, enabling users to track dashboard usage and user engagement.
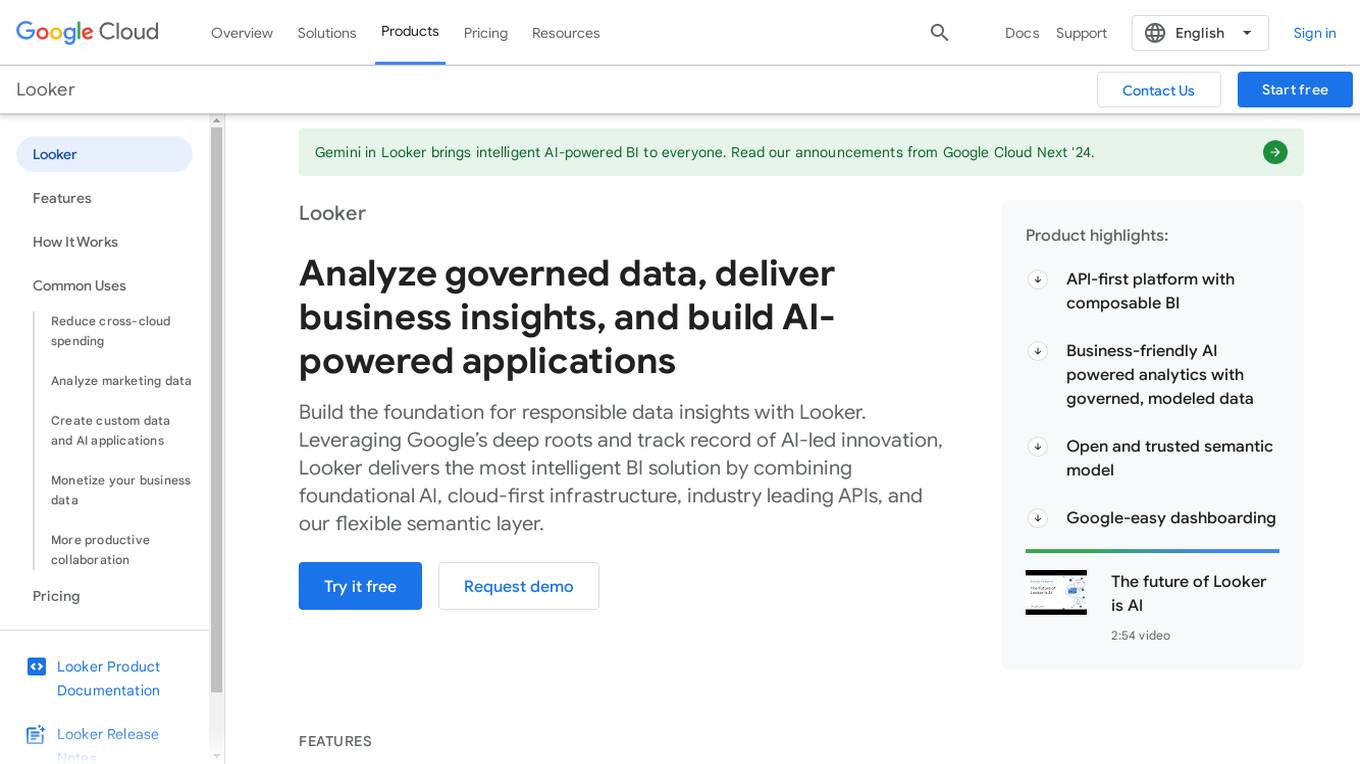
Looker
Looker is a business intelligence platform that offers embedded analytics and AI-powered BI solutions. Leveraging Google's AI-led innovation, Looker delivers intelligent BI by combining foundational AI, cloud-first infrastructure, industry-leading APIs, and a flexible semantic layer. It allows users to build custom data experiences, transform data into integrated experiences, and create deeply integrated dashboards. Looker also provides a universal semantic modeling layer for unified, trusted data sources and offers self-service analytics capabilities through Looker and Looker Studio. Additionally, Looker features Gemini, an AI-powered analytics assistant that accelerates analytical workflows and offers a collaborative and conversational user experience.
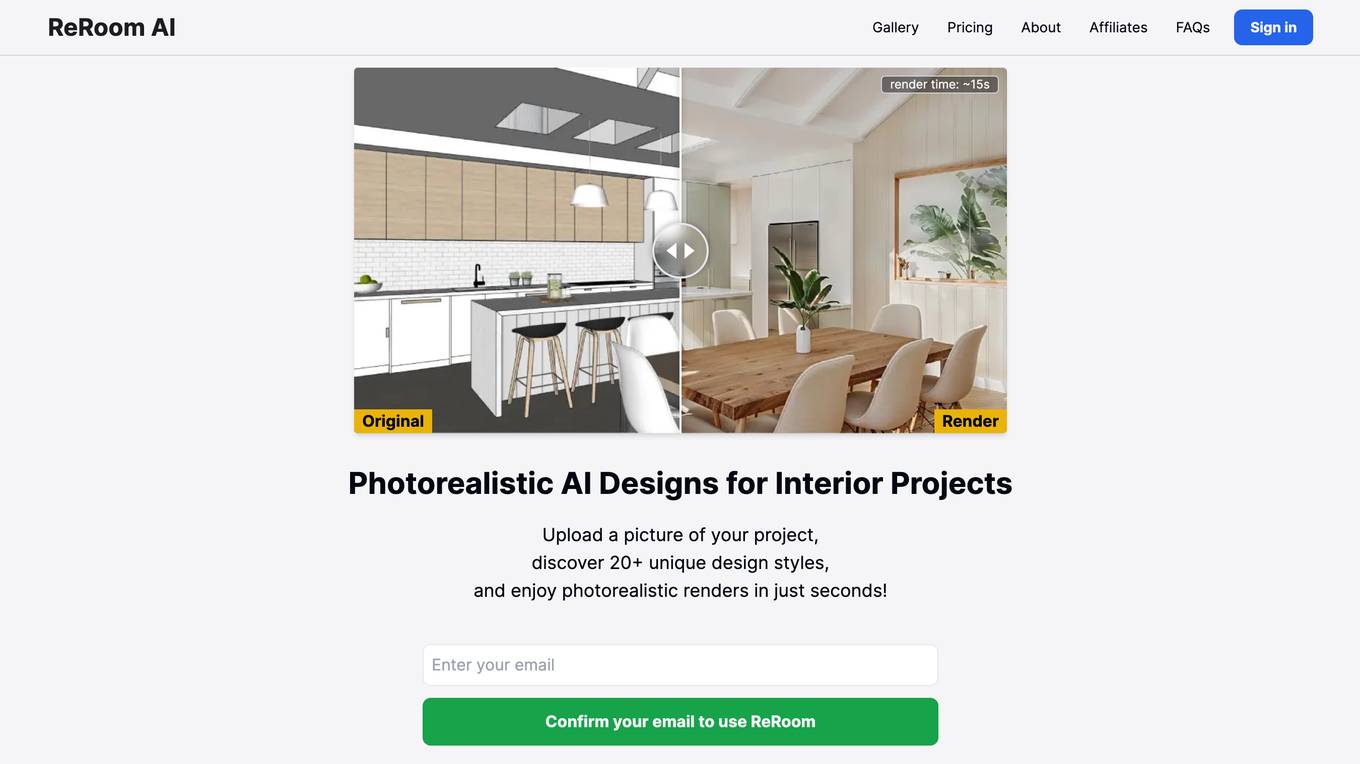
ReRoom AI
ReRoom AI is an AI-powered interior design tool that allows users to upload a picture of their project and discover 20+ unique design styles. Users can then enjoy photorealistic renders of their project in just seconds. ReRoom AI is perfect for anyone who wants to quickly and easily create beautiful and realistic interior designs.
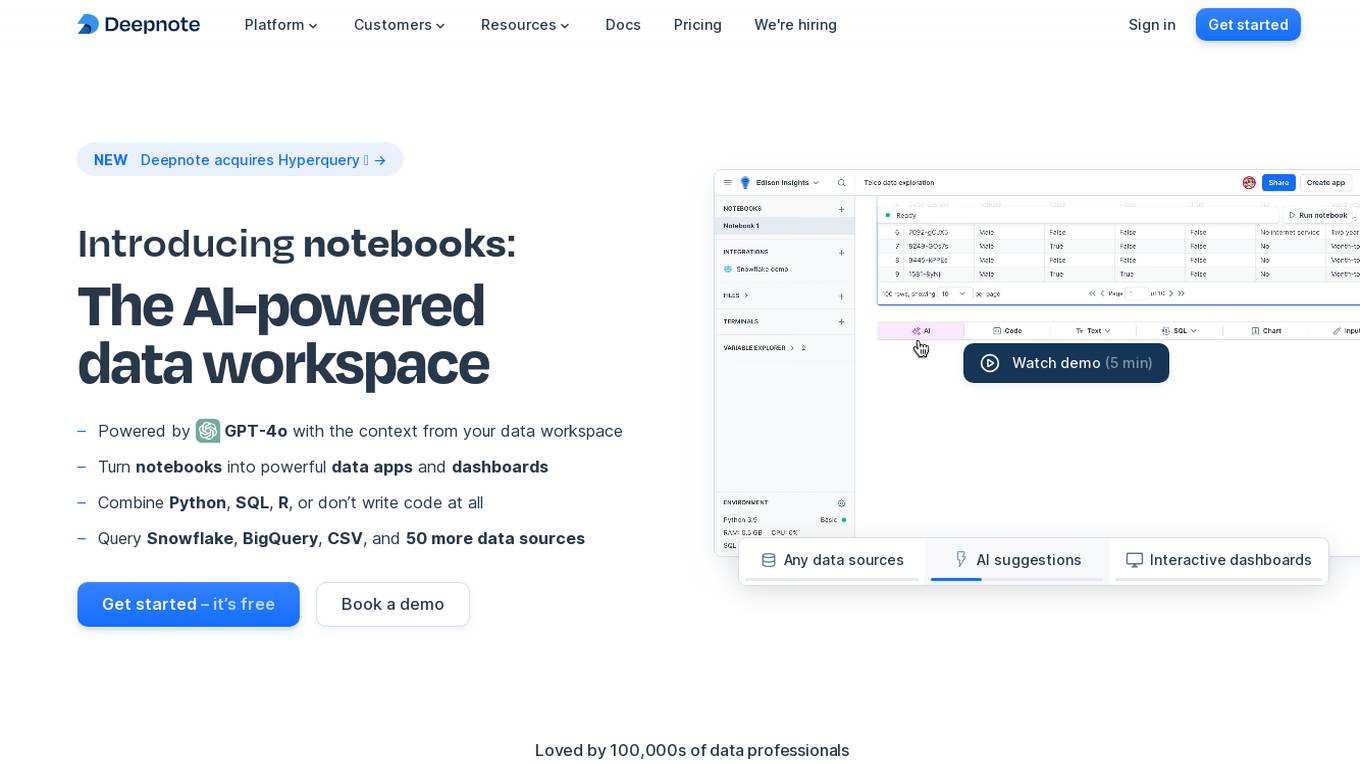
Deepnote
Deepnote is an AI-powered analytics and data science notebook platform designed for teams. It allows users to turn notebooks into powerful data apps and dashboards, combining Python, SQL, R, or even working without writing code at all. With Deepnote, users can query various data sources, generate code, explain code, and create interactive visualizations effortlessly. The platform offers features like collaborative workspaces, scheduling notebooks, deploying APIs, and integrating with popular data warehouses and databases. Deepnote prioritizes security and compliance, providing users with control over data access and encryption. It is loved by a community of data professionals and widely used in universities and by data analysts and scientists.
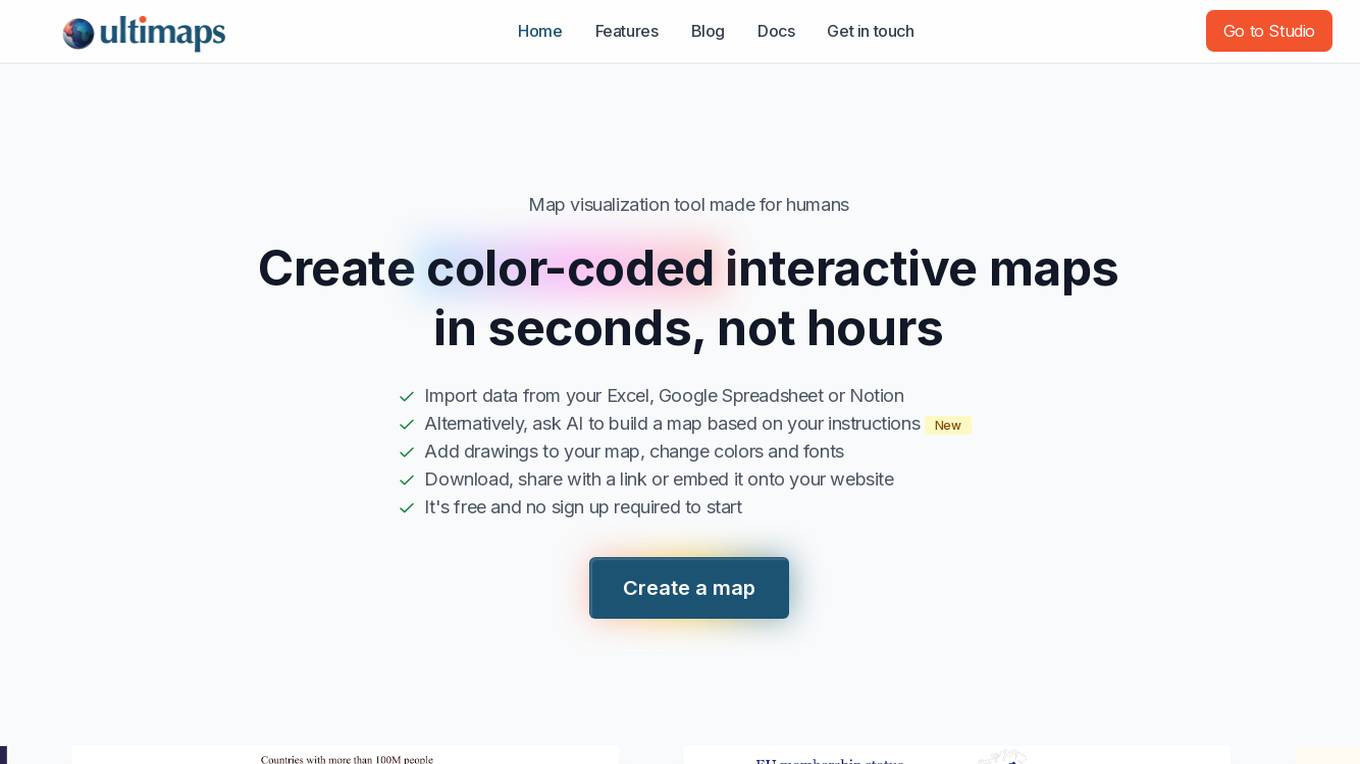
Ultimaps
Ultimaps is an AI-powered map visualization tool designed for humans to create color-coded interactive maps in seconds. Users can import data from Excel, Google Spreadsheet, or Notion, or instruct the AI to build a map based on their requirements. The tool allows users to add drawings, change colors and fonts, and easily download, share, or embed the maps. Ultimaps offers features like automatic color-coding based on imported data, customization options, auto-saving of visualizations, and the ability to create interactive maps without any coding. It is a user-friendly platform suitable for various mapping needs.
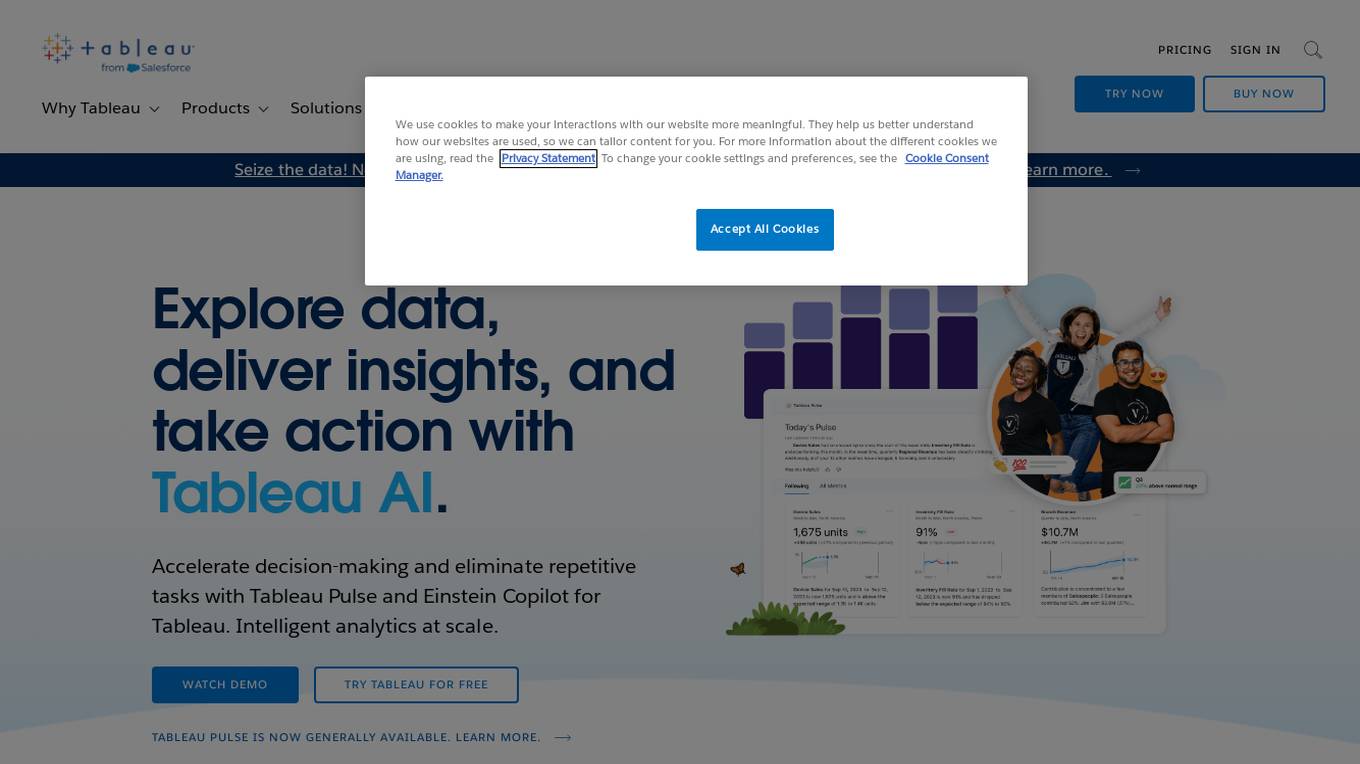
Tableau
Tableau is a visual analytics platform that helps people see, understand, and act on data. It is used by organizations of all sizes to solve problems, make better decisions, and improve operations. Tableau's platform is intuitive and easy to use, making it accessible to people of all skill levels. It also offers a wide range of features and capabilities, making it a powerful tool for data analysis and visualization.

Amazon Q in QuickSight
Amazon Q in QuickSight is a generative BI assistant that makes it easy to build and consume insights. With Amazon Q, BI users can build, discover, and share actionable insights and narratives in seconds using intuitive natural language experiences. Analysts can quickly build visuals and calculations and refine visuals using natural language. Business users can self-serve data and insights using natural language. Amazon Q is built with security and privacy in mind. It can understand and respect your existing governance identities, roles, and permissions and use this information to personalize its interactions. If a user doesn't have permission to access certain data without Amazon Q, they can't access it using Amazon Q either. Amazon Q in QuickSight is designed to meet the most stringent enterprise requirements from day one—none of your data or Amazon Q inputs and outputs are used to improve underlying models of Amazon Q for anyone but you.

Streamlit
Streamlit is a web application framework that allows users to create interactive web applications effortlessly using Python. It enables data scientists and developers to build and deploy data-driven applications quickly and easily. With Streamlit, users can create interactive visualizations, dashboards, and machine learning models without the need for extensive web development knowledge. The platform provides a simple and intuitive way to turn data scripts into shareable web apps, making it ideal for prototyping, showcasing projects, and sharing insights with others.
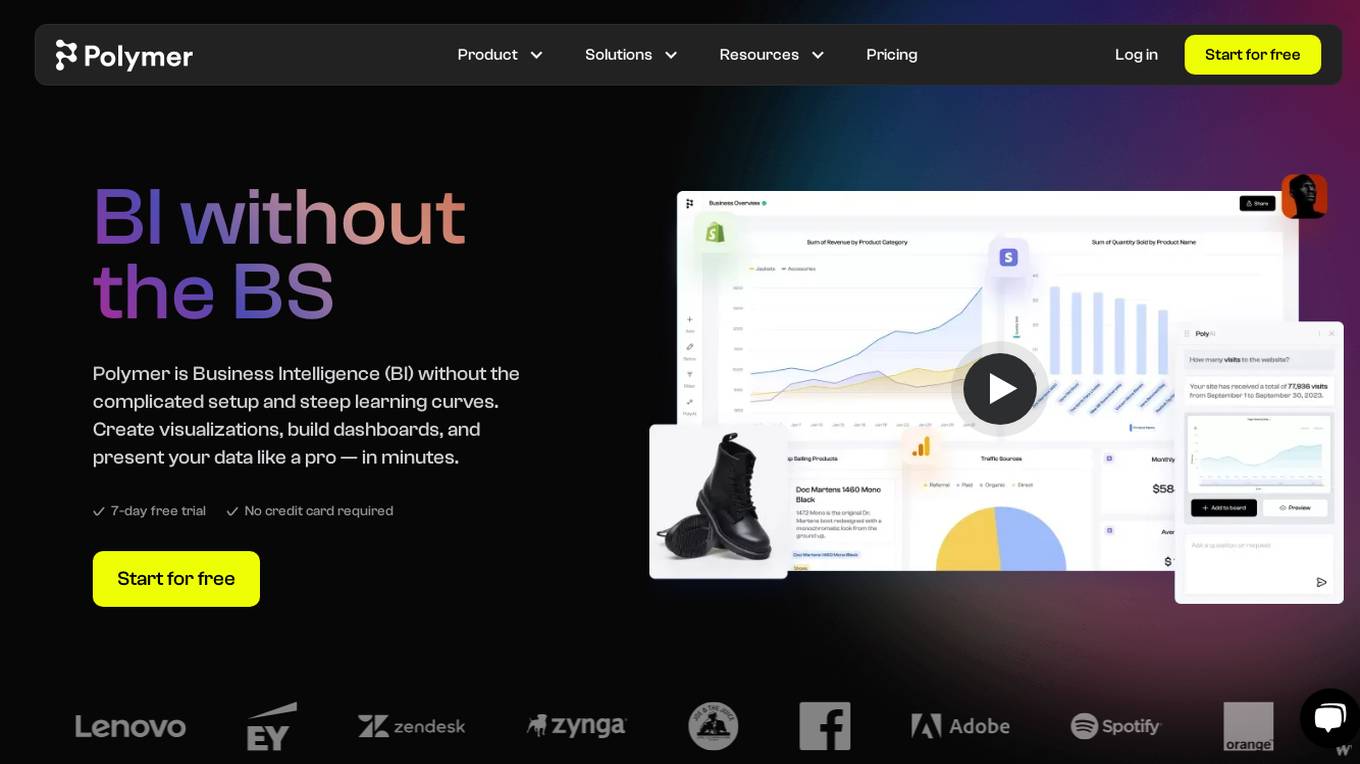
Polymer
Polymer is a business intelligence (BI) tool that makes it easy to connect to your data, build visualizations, and share insights. With Polymer, you don't need to be a data analyst to create beautiful dashboards and interactive reports. Polymer's AI-powered features make it easy to get started, even if you're new to BI. With Polymer, you can:
Latitude
Latitude is an open-source framework for building interactive data apps using code. It provides a workspace for data analysts to streamline their workflow, connect to various data sources, perform data transformations, create visualizations, and collaborate with others. Latitude aims to simplify the data analysis process by offering features such as data snapshots, a data profiler, a built-in AI assistant, and tight integration with dbt.
Quantexa News API
Quantexa News API is an AI-powered news data application that provides efficient, effective, and accurate access to global news at scale. It offers real-time access to enriched, tagged, and structured news feeds, enhancing risk monitoring processes and models. The application aggregates news content from over 90,000 sources and 1.3 million NLP-enriched news articles daily, with advanced AI-powered search capabilities. Users can investigate data through visualizations, automate tasks with entity and sentiment analysis, and easily share news data with relevant stakeholders.
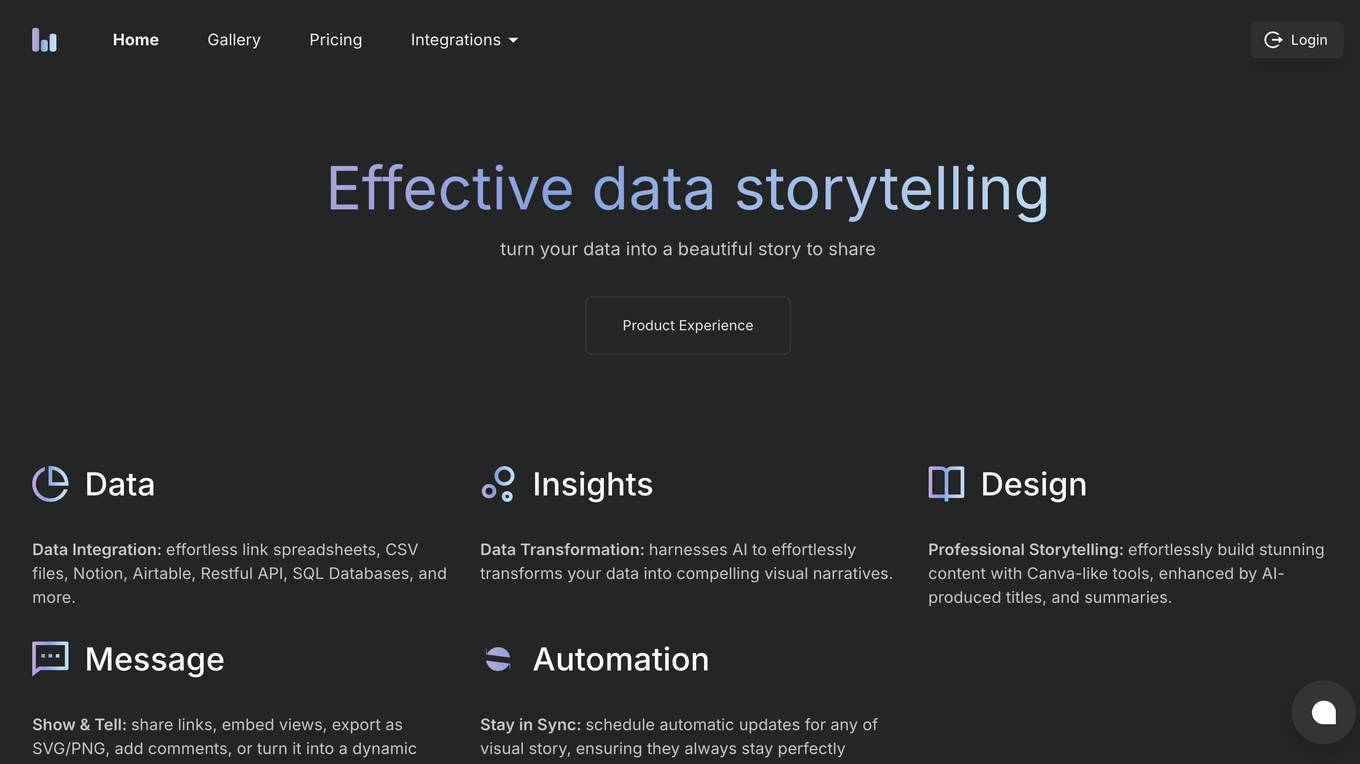
Columns
Columns is an AI tool that automates data storytelling. It enables users to create compelling narratives and visualizations from their data without the need for manual intervention. With Columns, users can easily transform raw data into engaging stories, making data analysis more accessible and impactful. The tool leverages advanced algorithms to analyze data sets, identify patterns, and generate insights that can be presented in a visually appealing format. Columns streamlines the process of data storytelling, saving users time and effort while enhancing the effectiveness of their data-driven communication.

Streamlit
Streamlit is a web application framework that allows data scientists and machine learning engineers to create interactive web applications quickly and easily. It simplifies the process of building and sharing data-focused applications by providing a simple Python script that can be turned into a shareable web app with just a few lines of code. With Streamlit, users can create interactive visualizations, dashboards, and machine learning models without the need for web development expertise.
Distribute
Distribute is an AI-powered Deal Room application designed to help sales teams streamline their sales process and close deals faster. It automatically turns sales conversations into follow-ups, business cases, and action plans, enabling users to win more deals with less effort. The platform offers features such as AI meeting synthesis, personalized action points, engagement tracking, custom ROI visualizations, tailored value messaging, and immediate sharing capabilities. Distribute also provides advantages like saving time and money, increasing close rates, enabling real-time collaboration, building AI-powered deals, and offering branded templates for content creation. However, it has disadvantages such as limited customization options, potential security concerns, and dependency on internet connectivity.
Graphy
Graphy is a data visualization and reporting tool that helps marketers create beautiful, interactive reports in minutes. It is powered by AI to increase productivity and make data more accessible and understandable. With Graphy, you can unify your data from all your tools into a single, shareable view. You can also explore data in the tools you've already mastered, then save it in Graphy to tell your data story with AI Insights, comments, annotations, goals, trend lines, and even emojis.
VDraw
VDraw is an AI-powered visual design tool that allows users to turn their ideas and text into stunning infographics, flowcharts, and designs without the need for advanced design skills. With VDraw, users can create professional visuals quickly and easily, personalize their designs with various fonts, colors, and icons, and share their creations on social media or embed them in blogs and websites. The tool leverages smart AI technology to automate the design process, making it accessible to users of all skill levels.
Hex
Hex is a collaborative data workspace that provides a variety of tools for working with data, including queries, notebooks, reports, data apps, and AI. It is designed to be easy to use for people of all technical skill levels, and it integrates with a variety of other tools and services. Hex is a powerful tool for data exploration, analysis, and visualization.
Powerdrill
Powerdrill is a platform that provides swift insights from knowledge and data. It offers a range of features such as discovering datasets, creating BI dashboards, accessing various apps, resources, blogs, documentation, and changelogs. The platform is available in English and fosters a community through its affiliate program. Users can sign up for a basic plan to start utilizing the tools and services offered by Powerdrill.
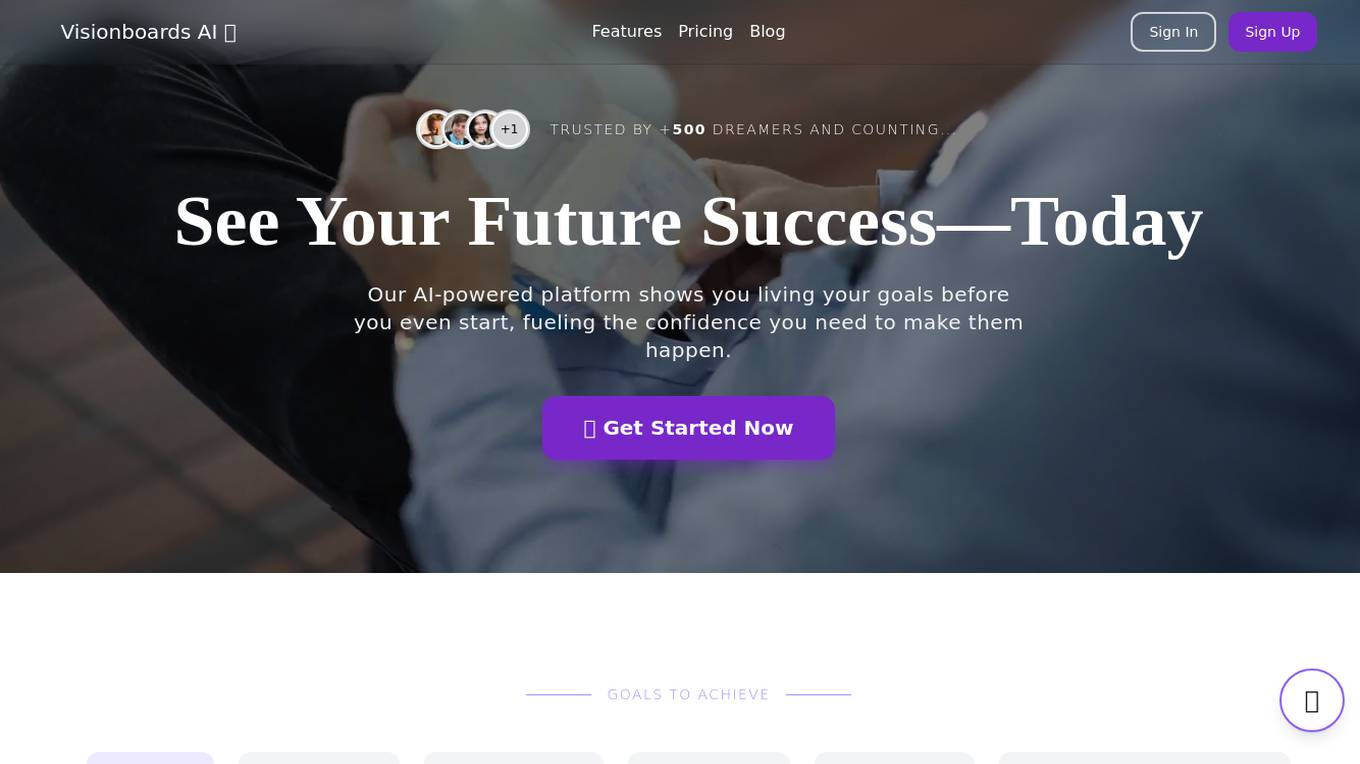
Visionboards AI
Visionboards AI is an AI-powered platform that helps users visualize and achieve their goals by creating personalized vision boards. The platform uses AI to generate inspiring images aligned with users' aspirations, fueling confidence and motivation. Users can share their goals, generate customized vision boards, and stay motivated to turn their dreams into reality. Visionboards AI offers different pricing packages with unique features and benefits, including high-resolution visuals, psychology-backed success visualization, and commercial use licenses. The platform aims to empower users to see themselves achieving their specific goals and progress through stages of their journey.
1 - Open Source AI Tools
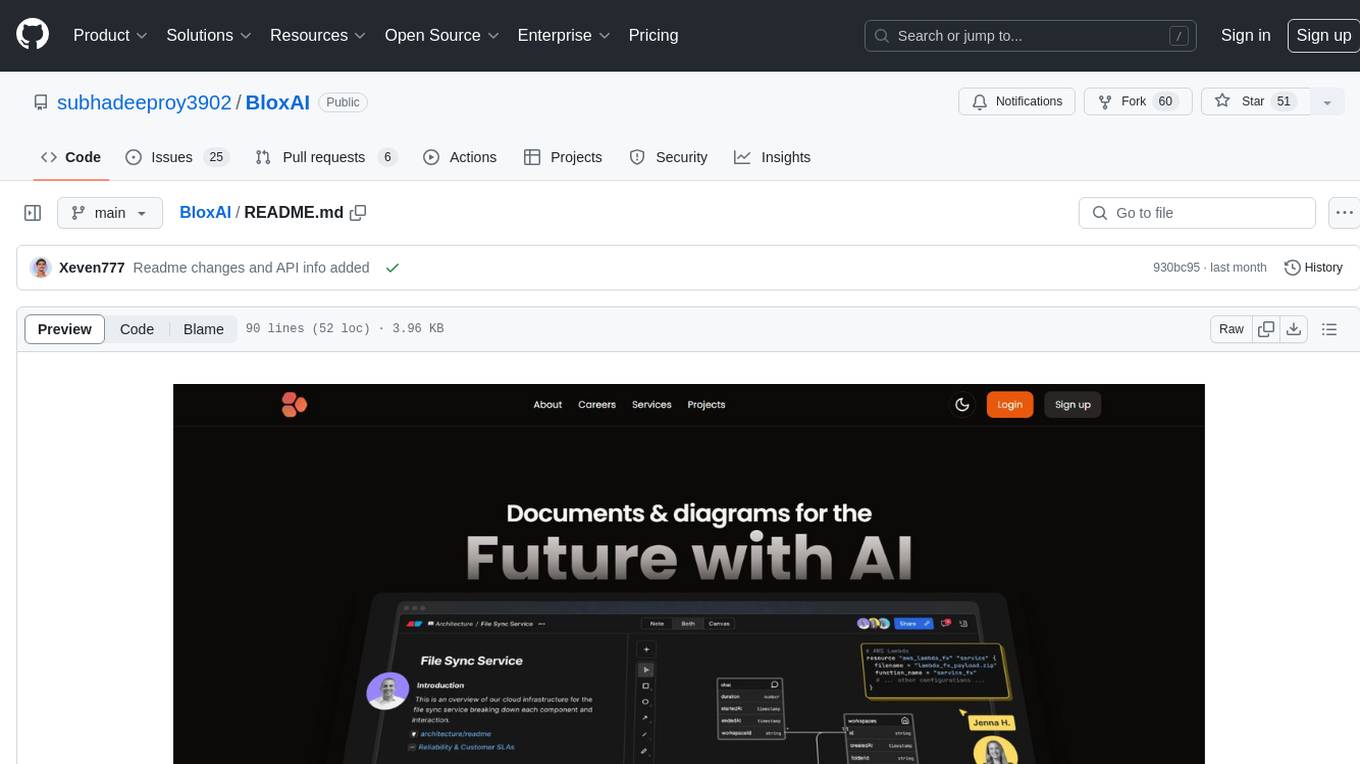
BloxAI
Blox AI is a platform that allows users to effortlessly create flowcharts and diagrams, collaborate with teams, and receive explanations from the Google Gemini model. It offers rich text editing, versatile visualizations, secure workspaces, and limited files allotment. Users can install it as an app and use it for wireframes, mind maps, and algorithms. The platform is built using Next.Js, Typescript, ShadCN UI, TailwindCSS, Convex, Kinde, EditorJS, and Excalidraw.
20 - OpenAI Gpts
Streamlit Assistant
This GPT can read all Streamlit Documantation and helps you about Streamlit.
Addy™ for Power BI Data Analytics
Advisor for Power BI Analytics, aiding in solution planning, design, and construction. Ask Hi or type /help for how to get started.
LI Article Share
Writes LI posts from article links you share, and you give tone and style for personalization, Then copy and paste to LI social profile, or via sharing tool
Cloudy with a Chance of Creation
Share a shape and 3 colours and I will generate a beautiful generative art.