Best AI tools for< Data Visualization >
13 - AI tool Sites
Arcwise
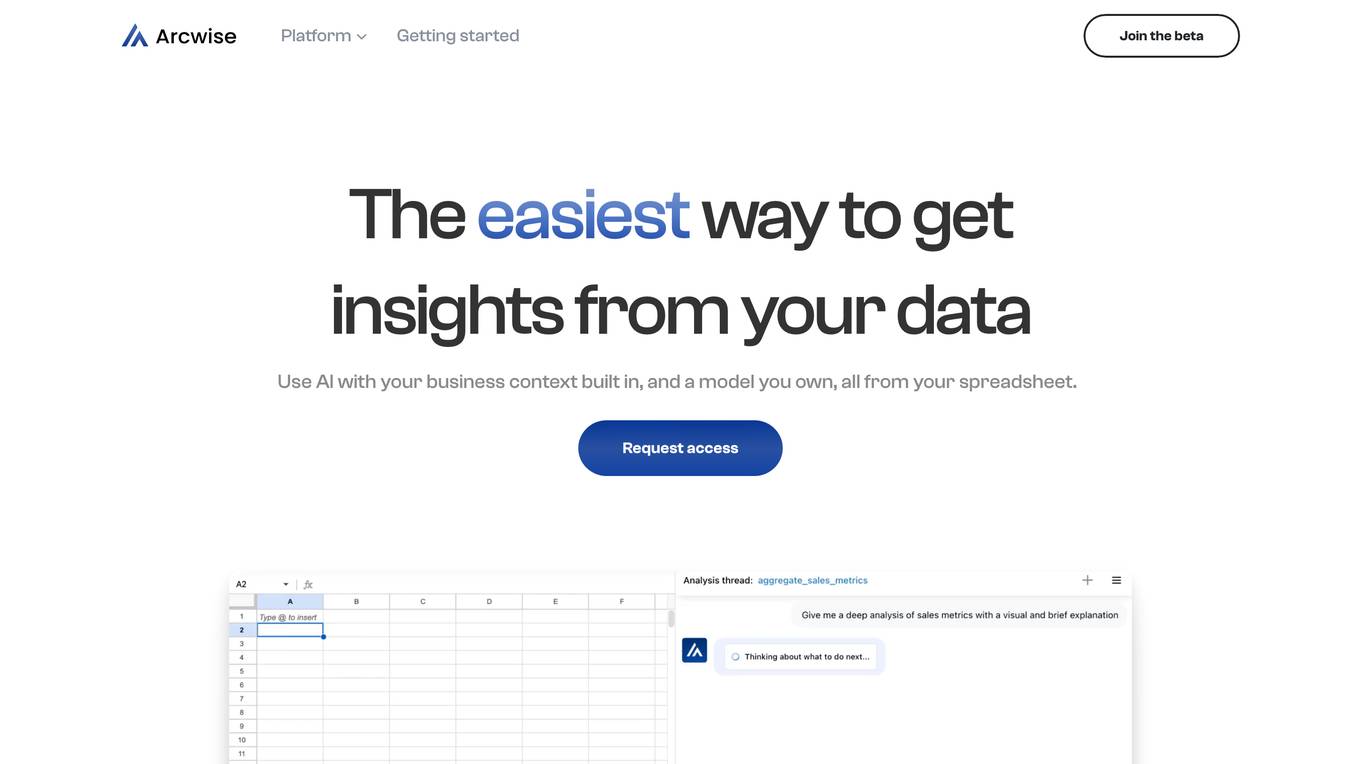
Arcwise is a cloud-based data science platform that provides a comprehensive set of tools for data preparation, exploration, modeling, and deployment. It is designed to make data science accessible to users of all skill levels, from beginners to experts. Arcwise offers a user-friendly interface, drag-and-drop functionality, and a wide range of pre-built templates and algorithms. This makes it easy for users to get started with data science and quickly build and deploy machine learning models.
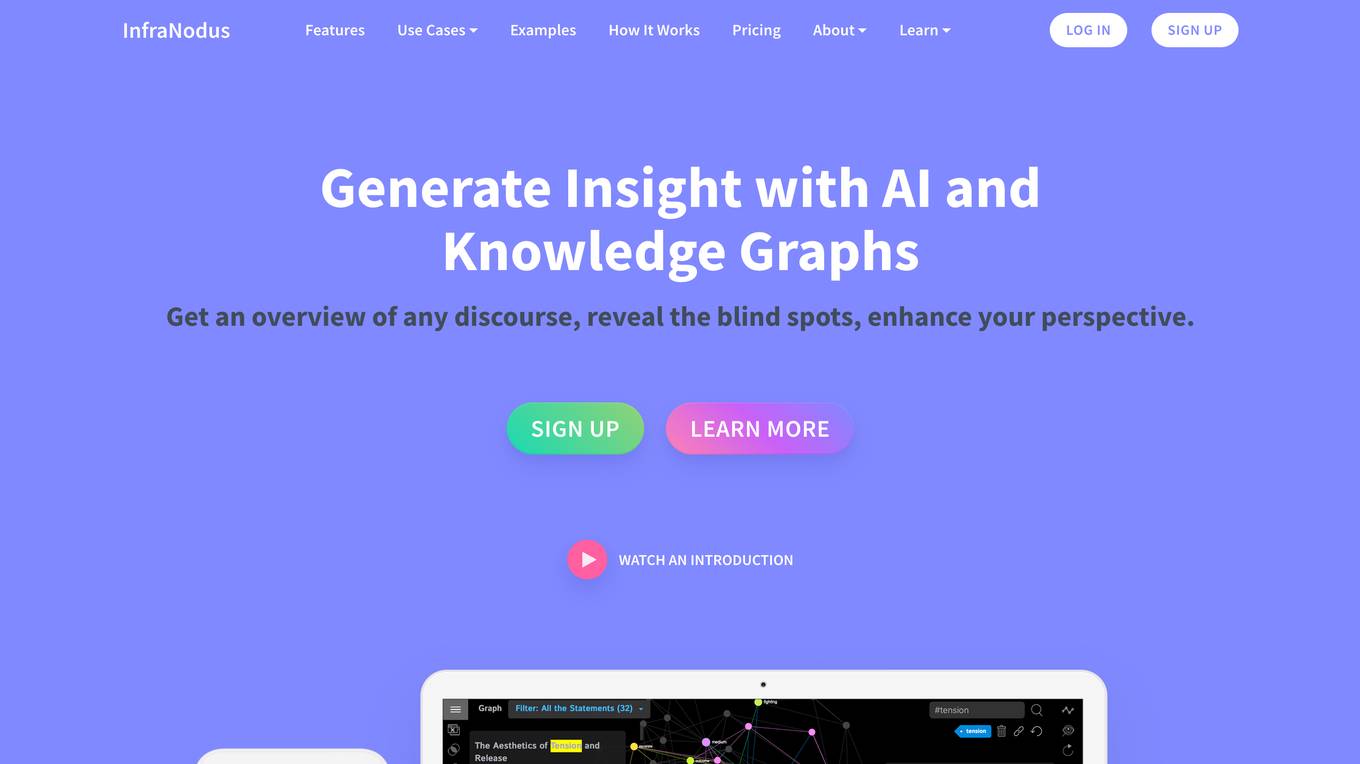
InfraNodus
InfraNodus is a text network visualization tool that helps users generate insights from any discourse by representing it as a network. It uses AI-powered algorithms to identify structural gaps in the text and suggest ways to bridge them. InfraNodus can be used for a variety of purposes, including research, creative writing, marketing, and SEO.
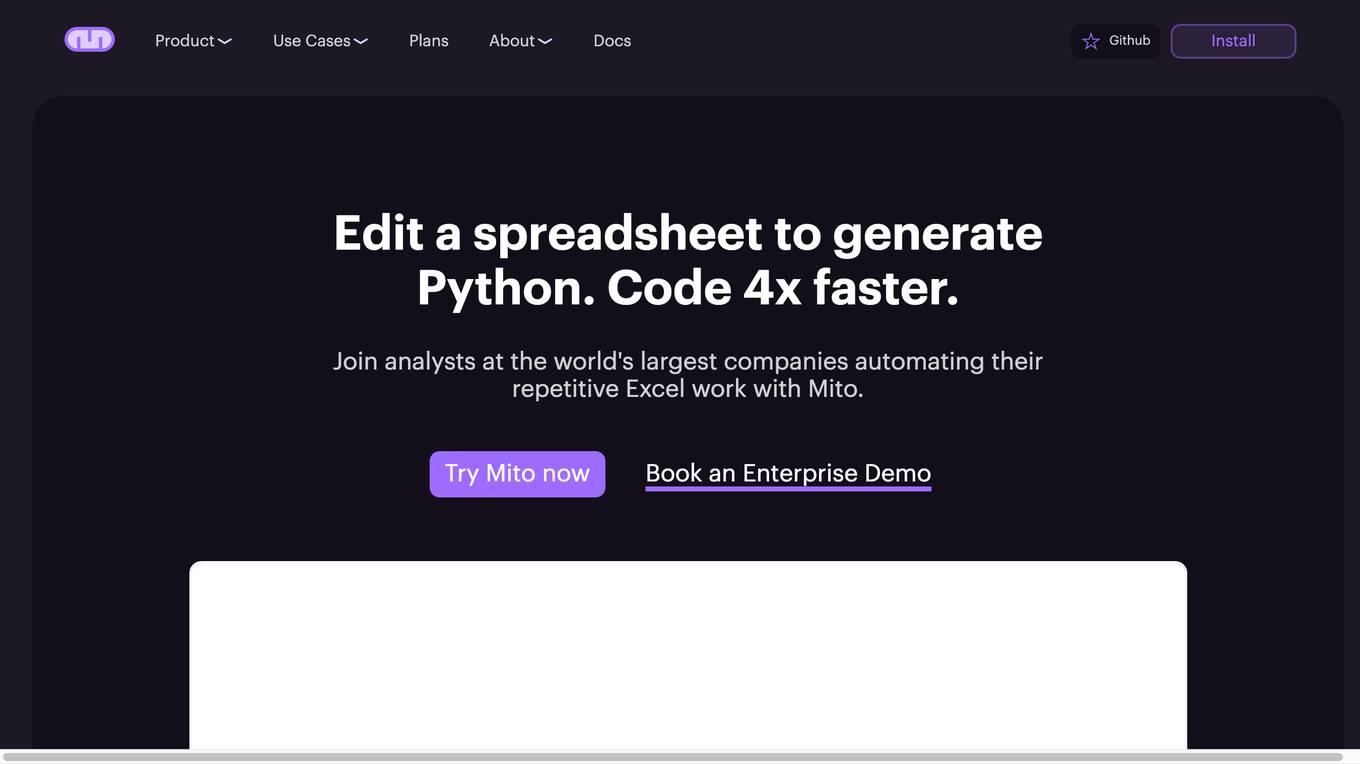
Mito
Mito is a low-code data app infrastructure that allows users to edit spreadsheets and automatically generate Python code. It is designed to help analysts automate their repetitive Excel work and take automation into their own hands. Mito is a Jupyter extension and Streamlit component, so users don't need to set up any new infrastructure. It is easy to get started with Mito, simply install it using pip and start using it in Jupyter or Streamlit.
DataCamp
DataCamp is an online learning platform that offers courses in data science, AI, and machine learning. The platform provides interactive exercises, short videos, and hands-on projects to help learners develop the skills they need to succeed in the field. DataCamp also offers a variety of resources for businesses, including team training, custom content development, and data science consulting.
IndexBox
IndexBox is a market intelligence platform that provides data, tools, and analytics to help businesses make informed decisions. The platform offers a variety of features, including access to market data, predictive modeling, and report generation. IndexBox is used by thousands of companies of all sizes, from startups to Fortune 500s.
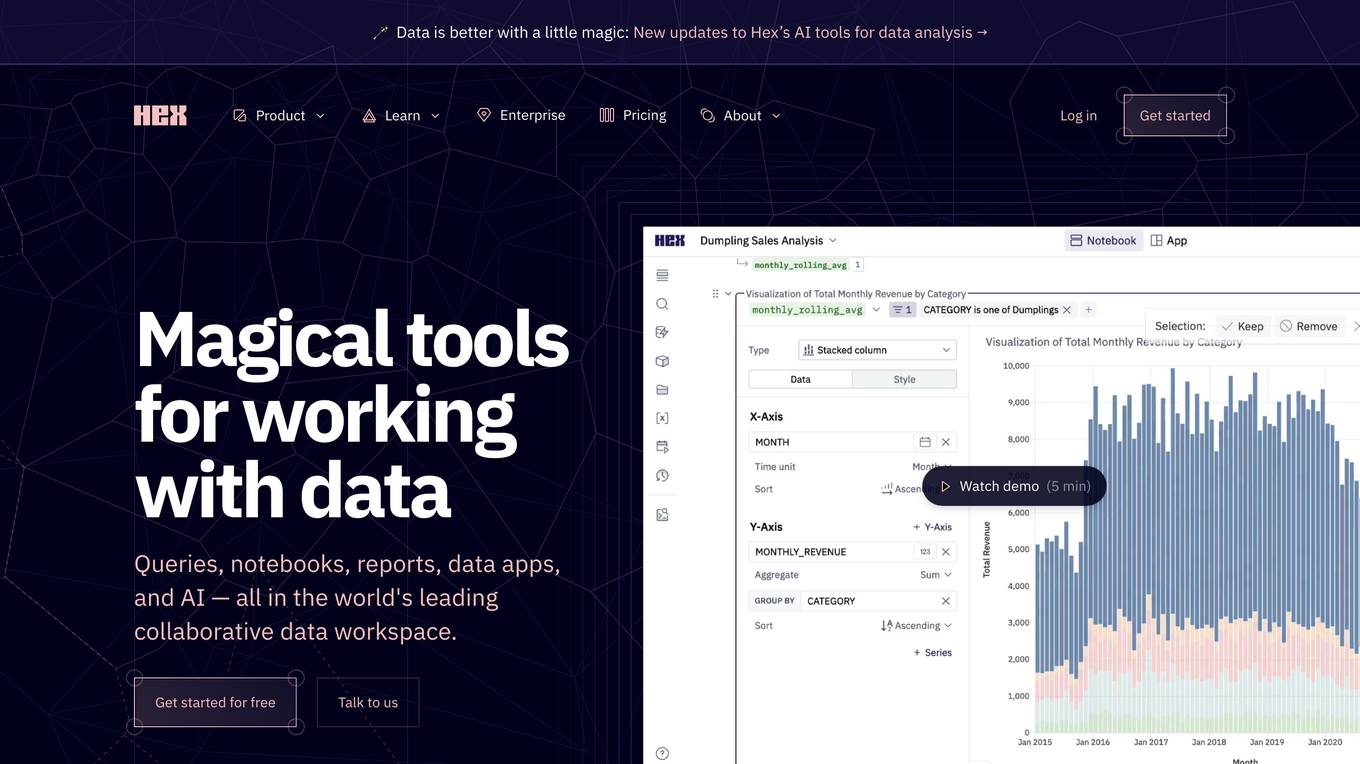
Hex
Hex is a collaborative data workspace that provides a variety of tools for working with data, including queries, notebooks, reports, data apps, and AI. It is designed to be easy to use for people of all technical skill levels, and it integrates with a variety of other tools and services. Hex is a powerful tool for data exploration, analysis, and visualization.
Databricks
Databricks is a data and AI company that provides a unified platform for data, analytics, and AI. The platform includes a variety of tools and services for data management, data warehousing, real-time analytics, data engineering, data science, and AI development. Databricks also offers a variety of integrations with other tools and services, such as ETL tools, data ingestion tools, business intelligence tools, AI tools, and governance tools.
KNIME
KNIME is a data science platform that enables users to analyze, blend, transform, model, visualize, and deploy data science solutions without coding. It provides a range of features and advantages for business and domain experts, data experts, end users, and MLOps & IT professionals across various industries and departments.
Posit
Posit is an open-source data science company that provides a suite of tools and services for data scientists. Its products include the RStudio IDE, Shiny, and Posit Connect. Posit also offers cloud-based solutions and enterprise support. The company's mission is to make data science accessible to everyone, regardless of their economic means or technical expertise.
Dataiku
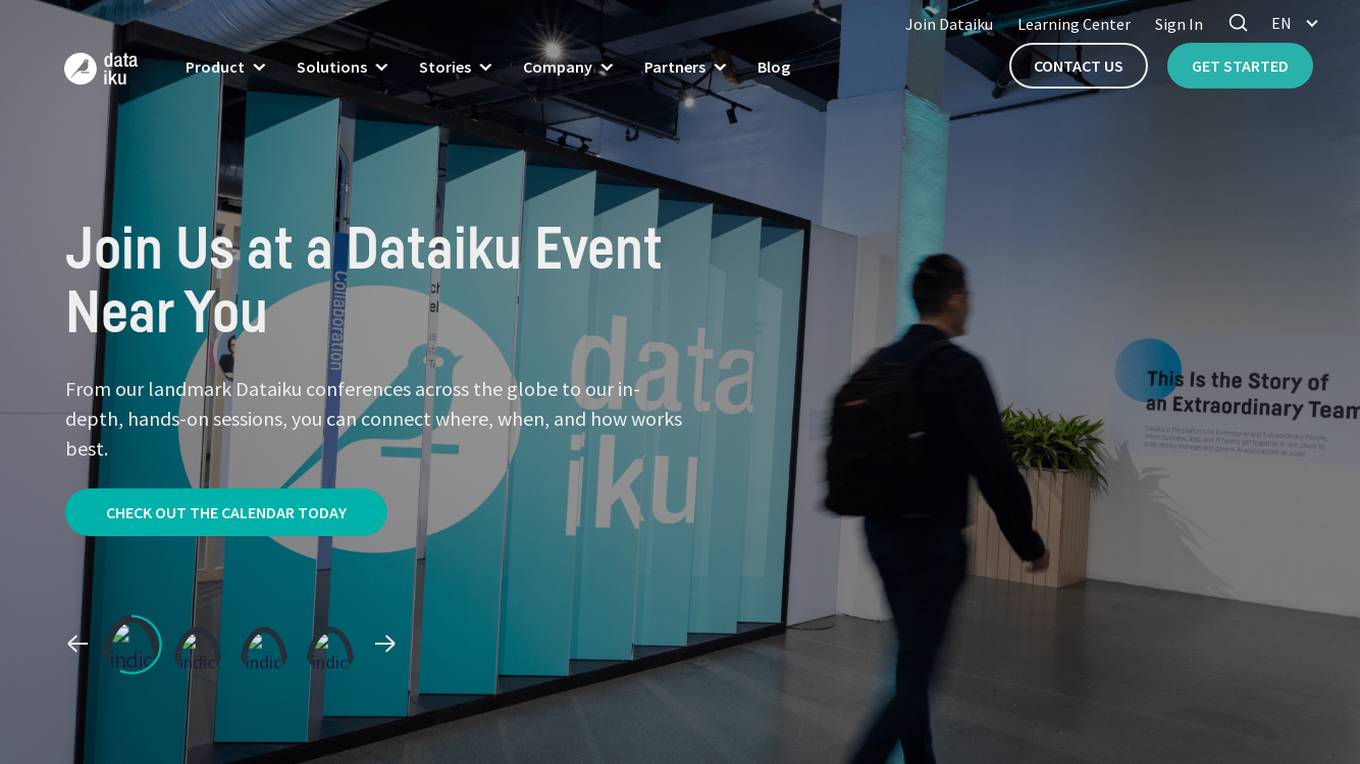
Dataiku is an end-to-end platform for data and AI projects. It provides a range of capabilities, including data preparation, machine learning, data visualization, and collaboration tools. Dataiku is designed to make it easy for users to build, deploy, and manage AI projects at scale.
Quantarium
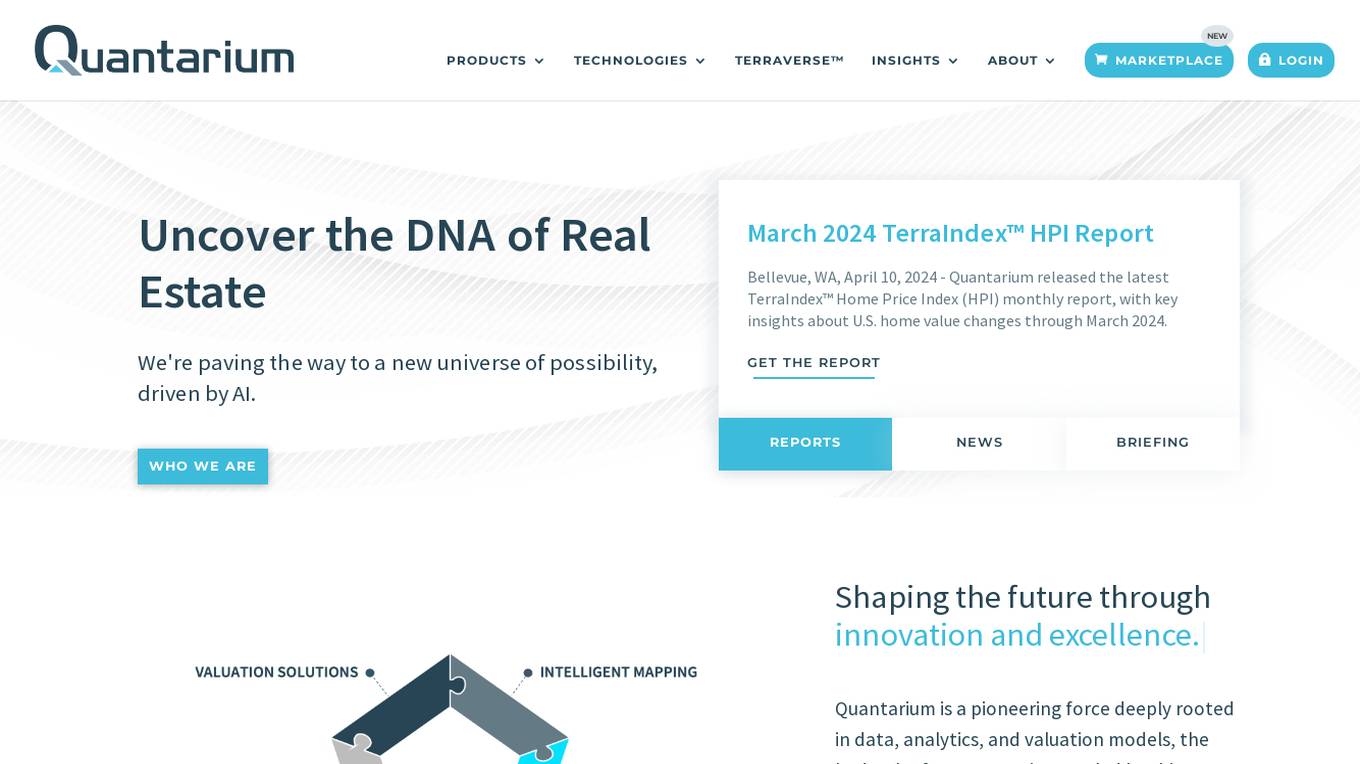
Quantarium is a pioneering force deeply rooted in data, analytics, and valuation models, the bedrock of our reputation. Fueled by this expertise, we crafted the Terraverse™ vision, which integrates Visual Technologies, Intelligent Mapping, and Large Language Models. Our dual commitment to delivering exceptional products and driving technological advancement is what sets us apart in our vast marketplace.
Tabula
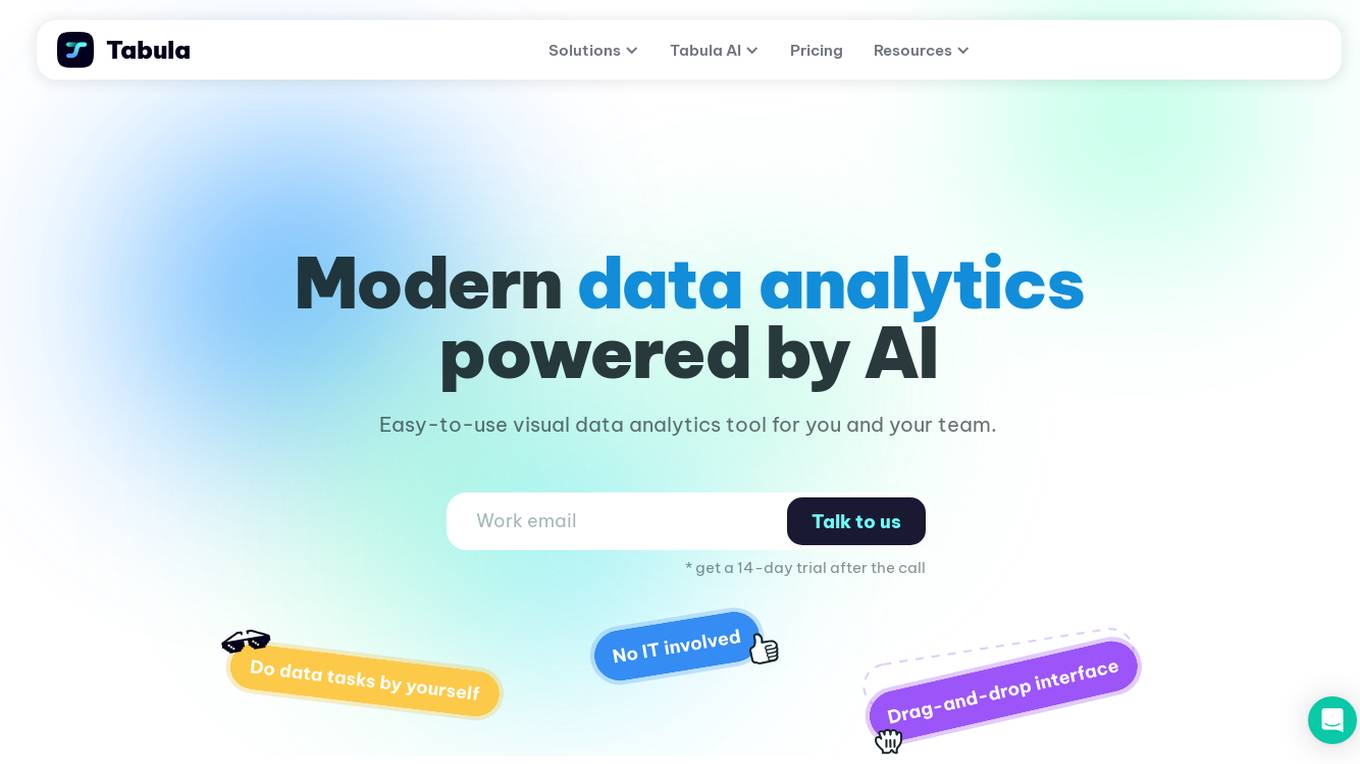
Tabula is a visual data analytics tool that uses AI to help businesses get insights from their data. It is easy to use and can be used by anyone, regardless of their technical expertise. Tabula can be used to access and unify data from a variety of sources, standardize and blend datasets, add custom metrics, build stunning reports, and automate repetitive tasks. Tabula is integrated with a variety of data sources and platforms, making it easy to get started.
Alteryx
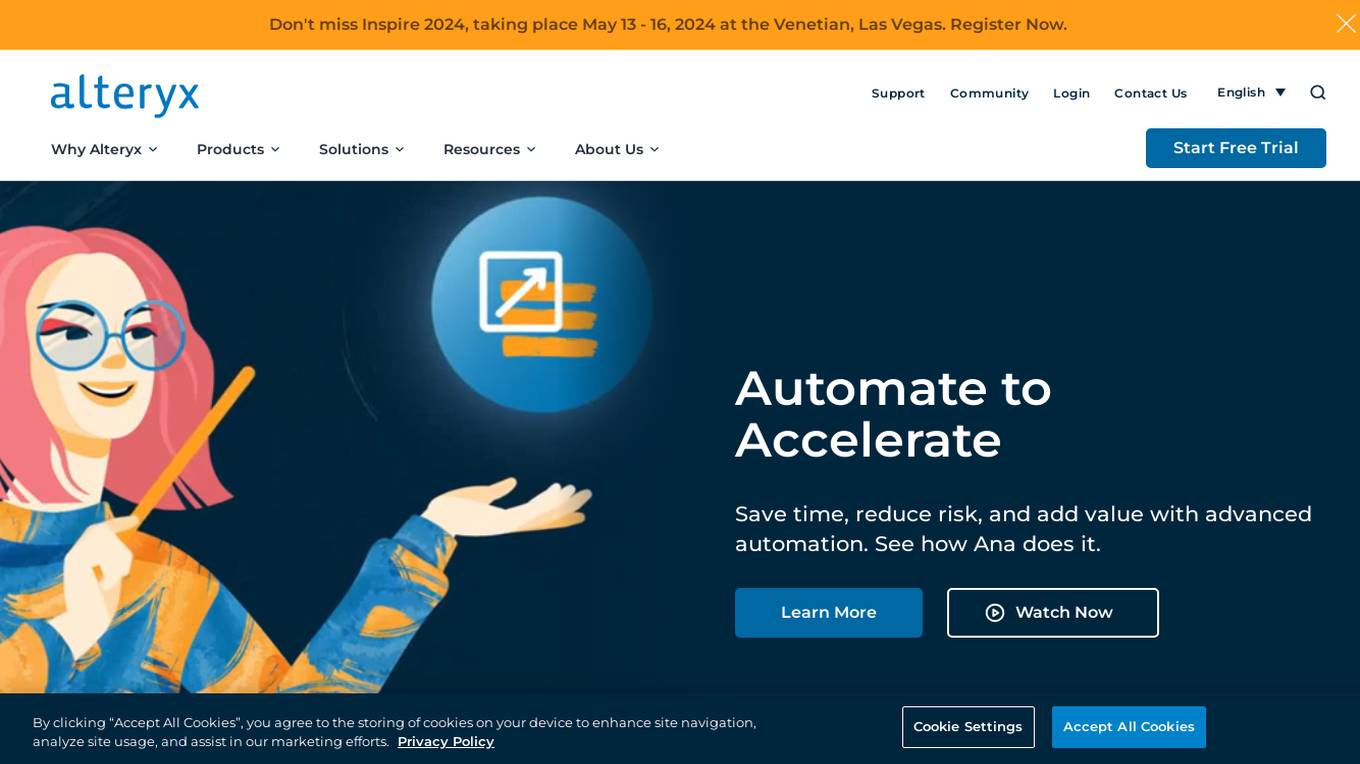
Alteryx offers a leading AI Platform for Enterprise Analytics that delivers actionable insights by automating analytics. The platform combines the power of data preparation, analytics, and machine learning to help businesses make better decisions faster. With Alteryx, businesses can connect to a wide variety of data sources, prepare and clean data, perform advanced analytics, and build and deploy machine learning models. The platform is designed to be easy to use, even for non-technical users, and it can be deployed on-premises or in the cloud.
20 - Open Source AI Tools
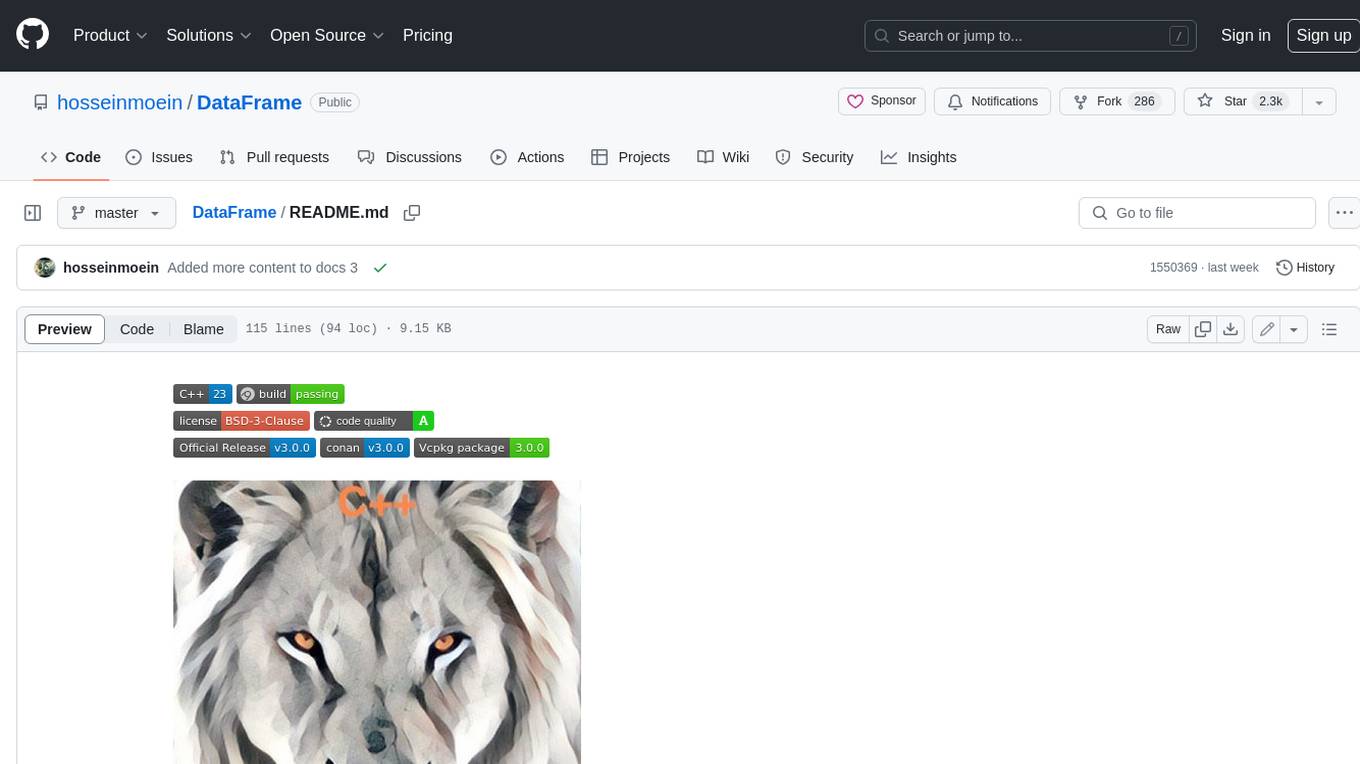
data-formulator
Data Formulator is an AI-powered tool developed by Microsoft Research to help data analysts create rich visualizations iteratively. It combines user interface interactions with natural language inputs to simplify the process of describing chart designs while delegating data transformation to AI. Users can utilize features like blended UI and NL inputs, data threads for history navigation, and code inspection to create impressive visualizations. The tool supports local installation for customization and Codespaces for quick setup. Developers can build new data analysis tools on top of Data Formulator, and research papers are available for further reading.
ai-data-analysis-MulitAgent
AI-Driven Research Assistant is an advanced AI-powered system utilizing specialized agents for data analysis, visualization, and report generation. It integrates LangChain, OpenAI's GPT models, and LangGraph for complex research processes. Key features include hypothesis generation, data processing, web search, code generation, and report writing. The system's unique Note Taker agent maintains project state, reducing overhead and improving context retention. System requirements include Python 3.10+ and Jupyter Notebook environment. Installation involves cloning the repository, setting up a Conda virtual environment, installing dependencies, and configuring environment variables. Usage instructions include setting data, running Jupyter Notebook, customizing research tasks, and viewing results. Main components include agents for hypothesis generation, process supervision, visualization, code writing, search, report writing, quality review, and note-taking. Workflow involves hypothesis generation, processing, quality review, and revision. Customization is possible by modifying agent creation and workflow definition. Current issues include OpenAI errors, NoteTaker efficiency, runtime optimization, and refiner improvement. Contributions via pull requests are welcome under the MIT License.
data-scientist-roadmap2024
The Data Scientist Roadmap2024 provides a comprehensive guide to mastering essential tools for data science success. It includes programming languages, machine learning libraries, cloud platforms, and concepts categorized by difficulty. The roadmap covers a wide range of topics from programming languages to machine learning techniques, data visualization tools, and DevOps/MLOps tools. It also includes web development frameworks and specific concepts like supervised and unsupervised learning, NLP, deep learning, reinforcement learning, and statistics. Additionally, it delves into DevOps tools like Airflow and MLFlow, data visualization tools like Tableau and Matplotlib, and other topics such as ETL processes, optimization algorithms, and financial modeling.
VMind
VMind is an open-source solution for intelligent visualization, providing an intelligent chart component based on LLM by VisActor. It allows users to create chart narrative works with natural language interaction, edit charts through dialogue, and export narratives as videos or GIFs. The tool is easy to use, scalable, supports various chart types, and offers one-click export functionality. Users can customize chart styles, specify themes, and aggregate data using LLM models. VMind aims to enhance efficiency in creating data visualization works through dialogue-based editing and natural language interaction.
dataline
DataLine is an AI-driven data analysis and visualization tool designed for technical and non-technical users to explore data quickly. It offers privacy-focused data storage on the user's device, supports various data sources, generates charts, executes queries, and facilitates report building. The tool aims to speed up data analysis tasks for businesses and individuals by providing a user-friendly interface and natural language querying capabilities.
OAD
OAD is a powerful open-source tool for analyzing and visualizing data. It provides a user-friendly interface for exploring datasets, generating insights, and creating interactive visualizations. With OAD, users can easily import data from various sources, clean and preprocess data, perform statistical analysis, and create customizable visualizations to communicate findings effectively. Whether you are a data scientist, analyst, or researcher, OAD can help you streamline your data analysis workflow and uncover valuable insights from your data.
preswald
Preswald is a full-stack platform for building, deploying, and managing interactive data applications in Python. It simplifies the process by combining ingestion, storage, transformation, and visualization into one lightweight SDK. With Preswald, users can connect to various data sources, customize app themes, and easily deploy apps locally. The platform focuses on code-first simplicity, end-to-end coverage, and efficiency by design, making it suitable for prototyping internal tools or deploying production-grade apps with reduced complexity and cost.
scira
Scira is a powerful open-source tool for analyzing and visualizing data. It provides a user-friendly interface for data exploration, cleaning, and modeling. With Scira, users can easily import datasets, perform statistical analysis, create insightful visualizations, and generate reports. The tool supports various data formats and offers a wide range of statistical functions and visualization options. Whether you are a data scientist, researcher, or student, Scira can help you uncover valuable insights from your data and communicate your findings effectively.
awesome-ai-tools
Awesome AI Tools is a curated list of popular tools and resources for artificial intelligence enthusiasts. It includes a wide range of tools such as machine learning libraries, deep learning frameworks, data visualization tools, and natural language processing resources. Whether you are a beginner or an experienced AI practitioner, this repository aims to provide you with a comprehensive collection of tools to enhance your AI projects and research. Explore the list to discover new tools, stay updated with the latest advancements in AI technology, and find the right resources to support your AI endeavors.
kweaver
KWeaver is an open-source cognitive intelligence development framework that provides data scientists, application developers, and domain experts with the ability for rapid development, comprehensive openness, and high-performance knowledge network generation and cognitive intelligence large model framework. It offers features such as automated and visual knowledge graph construction, visualization and analysis of knowledge graph data, knowledge graph integration, knowledge graph resource management, large model prompt engineering and debugging, and visual configuration for large model access.
SQLAgent
DataAgent is a multi-agent system for data analysis, capable of understanding data development and data analysis requirements, understanding data, and generating SQL and Python code for tasks such as data query, data visualization, and machine learning.
airda
airda(Air Data Agent) is a multi-agent system for data analysis, which can understand data development and data analysis requirements, understand data, and generate SQL and Python code for data query, data visualization, machine learning and other tasks.
Azure-OpenAI-demos
Azure OpenAI demos is a repository showcasing various demos and use cases of Azure OpenAI services. It includes demos for tasks such as image comparisons, car damage copilot, video to checklist generation, automatic data visualization, text analytics, and more. The repository provides a wide range of examples on how to leverage Azure OpenAI for different applications and industries.
smile
Smile (Statistical Machine Intelligence and Learning Engine) is a comprehensive machine learning, NLP, linear algebra, graph, interpolation, and visualization system in Java and Scala. It covers every aspect of machine learning, including classification, regression, clustering, association rule mining, feature selection, manifold learning, multidimensional scaling, genetic algorithms, missing value imputation, efficient nearest neighbor search, etc. Smile implements major machine learning algorithms and provides interactive shells for Java, Scala, and Kotlin. It supports model serialization, data visualization using SmilePlot and declarative approach, and offers a gallery showcasing various algorithms and visualizations.
ezdata
Ezdata is a data processing and task scheduling system developed based on Python backend and Vue3 frontend. It supports managing multiple data sources, abstracting various data sources into a unified data model, integrating chatgpt for data question and answer functionality, enabling low-code data integration and visualization processing, scheduling single and dag tasks, and integrating a low-code data visualization dashboard system.
edge2ai-workshop
The edge2ai-workshop repository provides a hands-on workshop for building an IoT Predictive Maintenance workflow. It includes lab exercises for setting up components like NiFi, Streams Processing, Data Visualization, and more on a single host. The repository also covers use cases such as credit card fraud detection. Users can follow detailed instructions, prerequisites, and connectivity guidelines to connect to their cluster and explore various services. Additionally, troubleshooting tips are provided for common issues like MiNiFi not sending messages or CEM not picking up new NARs.
Auto-Analyst
Auto-Analyst is an AI-driven data analytics agentic system designed to simplify and enhance the data science process. By integrating various specialized AI agents, this tool aims to make complex data analysis tasks more accessible and efficient for data analysts and scientists. Auto-Analyst provides a streamlined approach to data preprocessing, statistical analysis, machine learning, and visualization, all within an interactive Streamlit interface. It offers plug and play Streamlit UI, agents with data science speciality, complete automation, LLM agnostic operation, and is built using lightweight frameworks.
awesome-mlops
Awesome MLOps is a curated list of tools related to Machine Learning Operations, covering areas such as AutoML, CI/CD for Machine Learning, Data Cataloging, Data Enrichment, Data Exploration, Data Management, Data Processing, Data Validation, Data Visualization, Drift Detection, Feature Engineering, Feature Store, Hyperparameter Tuning, Knowledge Sharing, Machine Learning Platforms, Model Fairness and Privacy, Model Interpretability, Model Lifecycle, Model Serving, Model Testing & Validation, Optimization Tools, Simplification Tools, Visual Analysis and Debugging, and Workflow Tools. The repository provides a comprehensive collection of tools and resources for individuals and teams working in the field of MLOps.
LLM4DB
LLM4DB is a repository focused on the intersection of Large Language Models (LLMs) and Database technologies. It covers various aspects such as data processing, data analysis, database optimization, and data management for LLMs. The repository includes research papers, tools, and techniques related to leveraging LLMs for tasks like data cleaning, entity matching, schema matching, data discovery, NL2SQL, data exploration, data visualization, knob tuning, query optimization, and database diagnosis.
data-engineering-zoomcamp
Data Engineering Zoomcamp is a comprehensive course covering various aspects of data engineering, including data ingestion, workflow orchestration, data warehouse, analytics engineering, batch processing, and stream processing. The course provides hands-on experience with tools like Python, Rust, Terraform, Airflow, BigQuery, dbt, PySpark, Kafka, and more. Students will learn how to work with different data technologies to build scalable and efficient data pipelines for analytics and processing. The course is designed for individuals looking to enhance their data engineering skills and gain practical experience in working with big data technologies.
20 - OpenAI Gpts
Emmi Data Analysis and Visualizer
Expert in data analysis and visualization, offering clear explanations and guidance.
Illuminous - The Data Exploration AI
Expert in data analysis, visualizations, and predictions.
Addy™ for Power BI Data Analytics
Advisor for Power BI Analytics, aiding in solution planning, design, and construction. Ask Hi or type /help for how to get started.
Vicky Vega
Generates Vega-Lite JSON code for Power BI visuals from data and descriptions.
PowerBI GPT
A PowerBI Expert assisting with debugging, dashboard ideas, and PowerBI service guidance.
Projeto BRAPEL Digital
Faça perguntas, analise dados e crie gráficos da história dos jogos do clássico BRAPEL (Grêmio Esportivo Brasil e Esporte Clube Pelotas)
Plotter
Provide a hand-drawing or screenshot of your desired plot along with the data and I'll make the plot.