Best AI tools for< Create Interactive Data Visualizations >
20 - AI tool Sites
Infogram
Infogram is an AI-powered platform that enables users to create interactive data visualizations, infographics, reports, maps, charts, tables, slides, and dashboards effortlessly. With a wide range of features such as AI chart recommendations, interactive content, embeds, custom maps, data import, and advanced editing tools, Infogram empowers users to craft compelling visual stories. The platform also offers content engagement analytics, real-time collaboration, and a brand kit for consistent branding. Trusted by over 10 million users worldwide, Infogram is a go-to tool for individuals, teams, and organizations looking to transform data into engaging visuals.
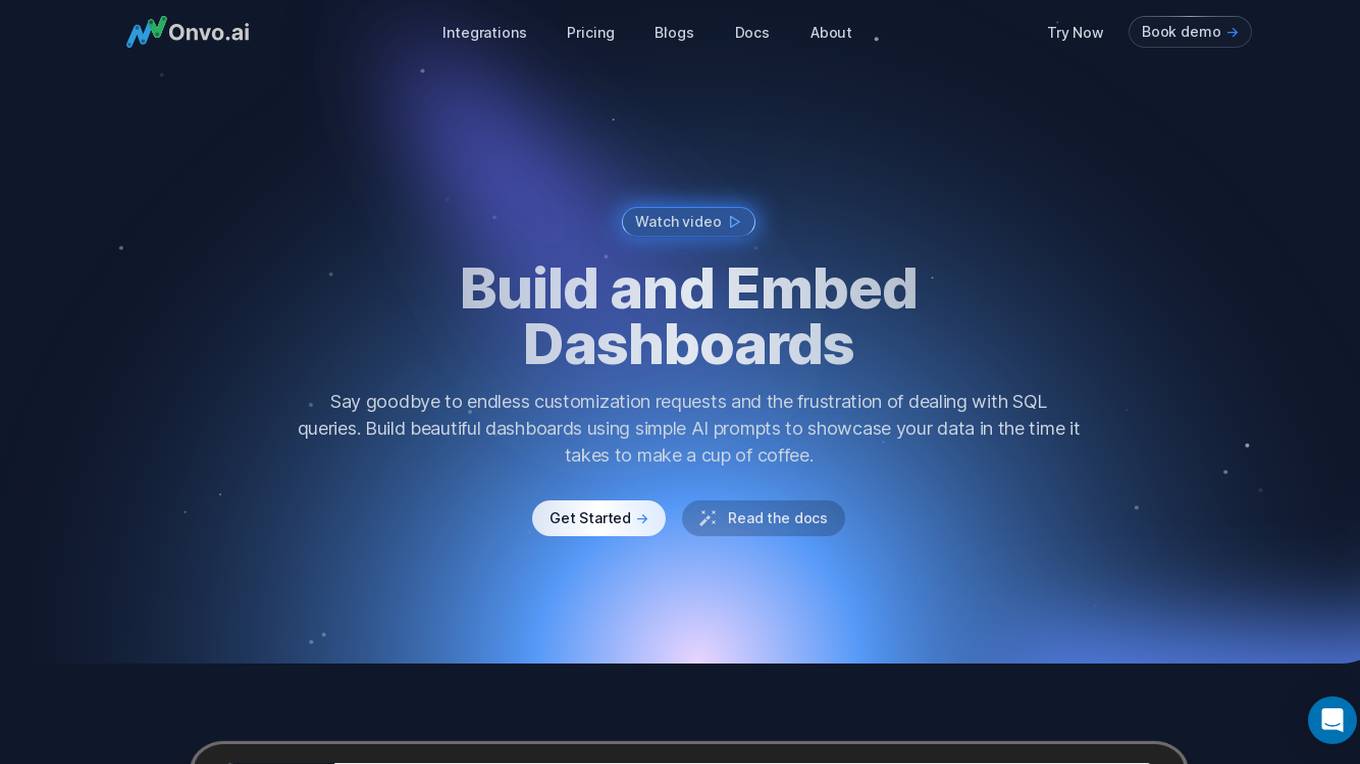
Onvo AI
Onvo AI is an embedded data visualization platform that allows users to create interactive dashboards and data visualizations using simple AI prompts. It connects to various data sources, enabling users to build insightful charts and visualizations without the need for complex queries or manual data manipulation. Onvo AI offers customization options, allowing users to match their brand's identity and provides secure sharing and embedding features. It also includes analytics capabilities, enabling users to track dashboard usage and user engagement.
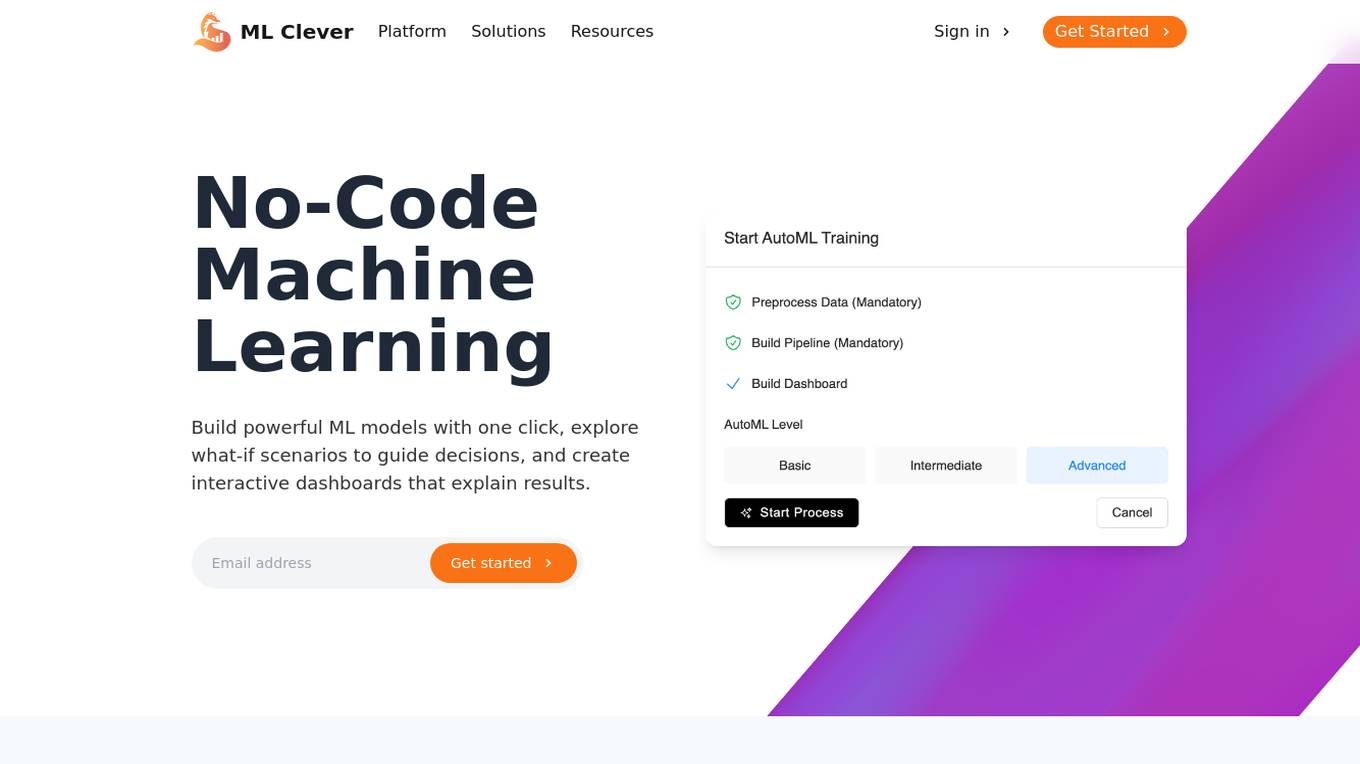
ML Clever
ML Clever is a no-code machine learning platform that empowers users to build powerful ML models with one click, explore what-if scenarios to guide decisions, and create interactive dashboards to explain results. It combines automated machine learning, interactive dashboards, and flexible prediction tools in one platform, allowing users to transform data into business insights without the need for data scientists or coding skills.
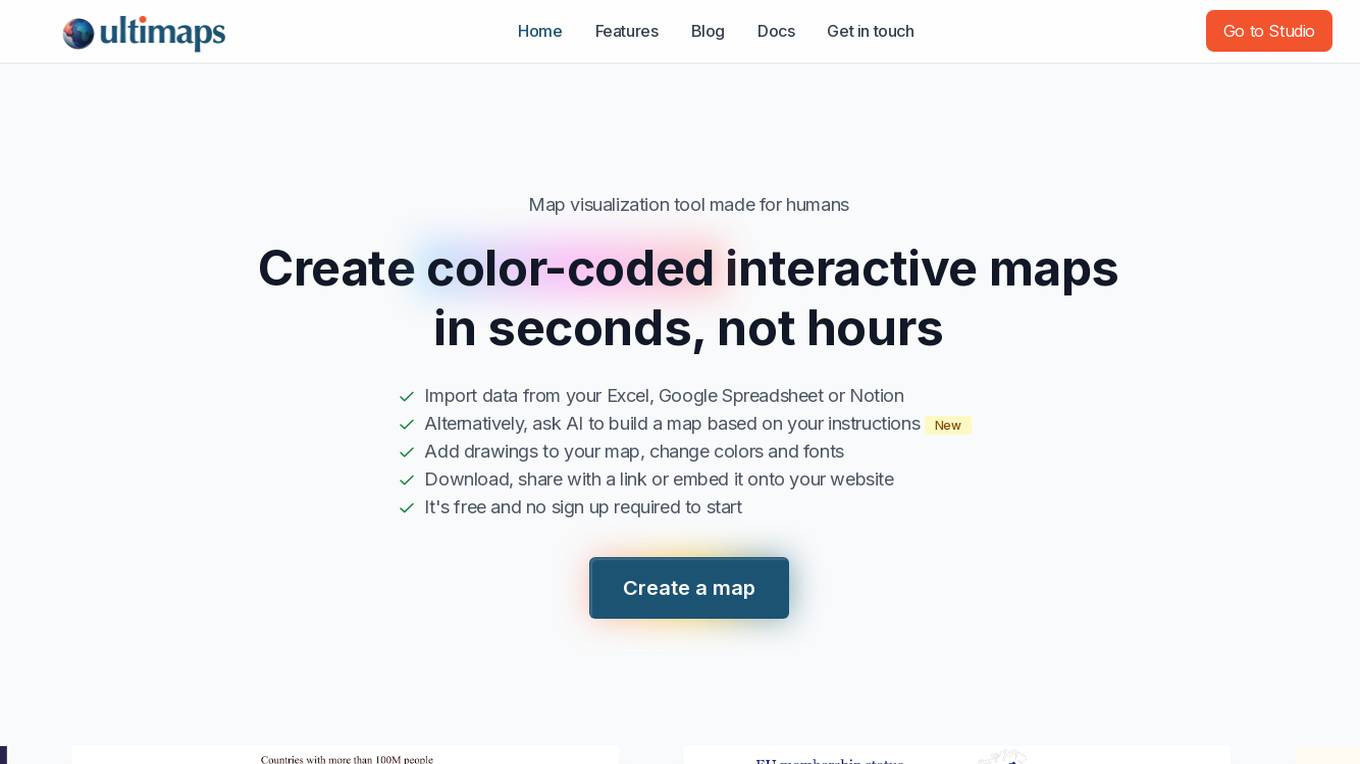
Ultimaps
Ultimaps is an AI-powered map visualization tool designed for humans to create color-coded interactive maps in seconds. Users can import data from Excel, Google Spreadsheet, or Notion, or instruct the AI to build a map based on their requirements. The tool allows users to add drawings, change colors and fonts, and easily download, share, or embed the maps. Ultimaps offers features like automatic color-coding based on imported data, customization options, auto-saving of visualizations, and the ability to create interactive maps without any coding. It is a user-friendly platform suitable for various mapping needs.

Streamlit
Streamlit is a web application framework that allows users to create interactive web applications effortlessly using Python. It enables data scientists and developers to build and deploy data-driven applications quickly and easily. With Streamlit, users can create interactive visualizations, dashboards, and machine learning models without the need for extensive web development knowledge. The platform provides a simple and intuitive way to turn data scripts into shareable web apps, making it ideal for prototyping, showcasing projects, and sharing insights with others.
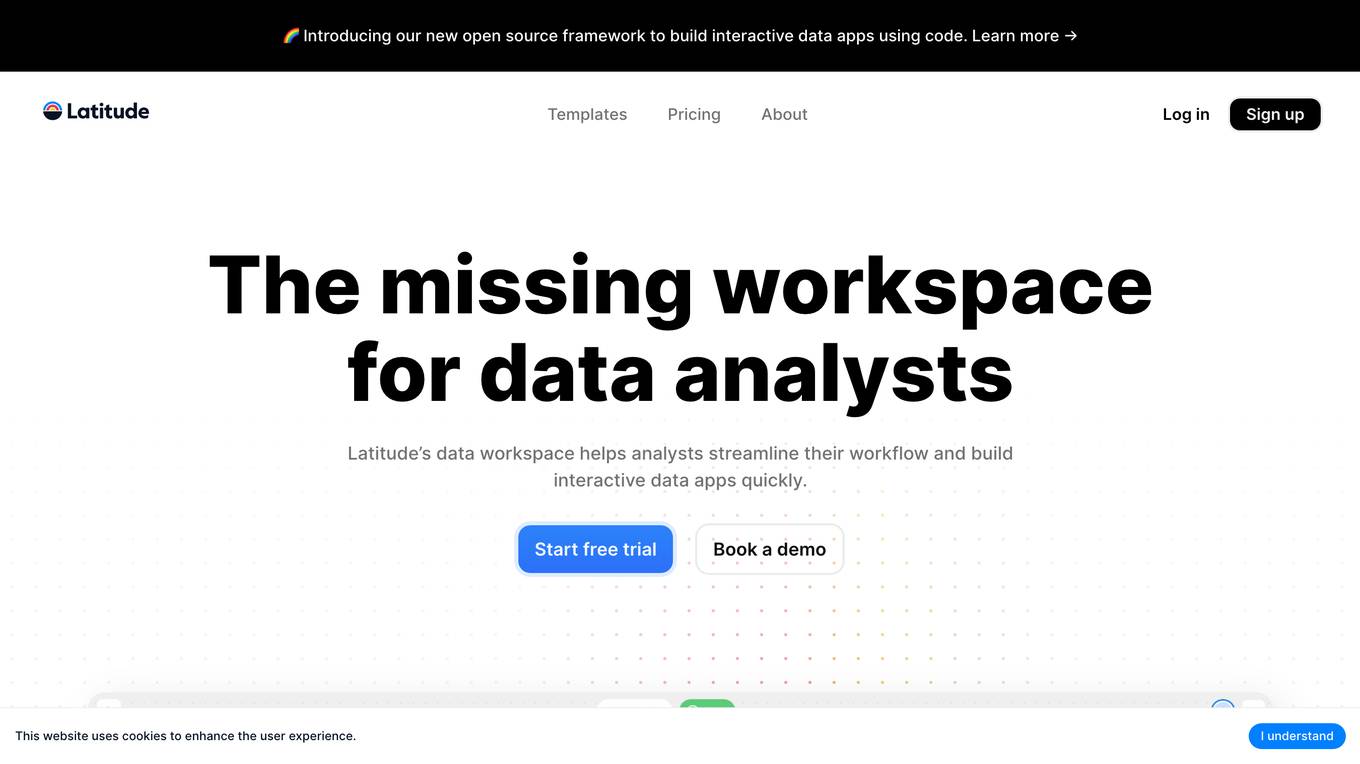
Latitude
Latitude is an open-source framework for building interactive data apps using code. It provides a workspace for data analysts to streamline their workflow, connect to various data sources, perform data transformations, create visualizations, and collaborate with others. Latitude aims to simplify the data analysis process by offering features such as data snapshots, a data profiler, a built-in AI assistant, and tight integration with dbt.
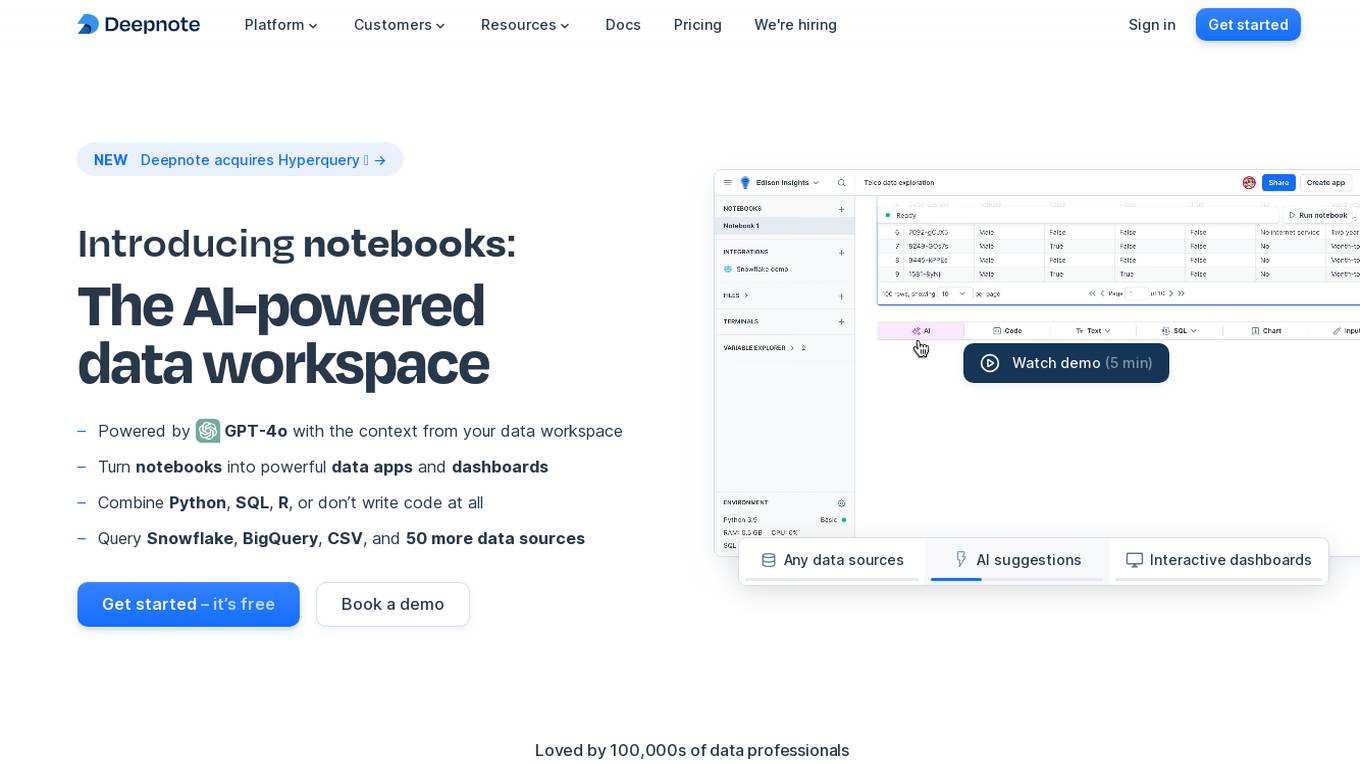
Deepnote
Deepnote is an AI-powered analytics and data science notebook platform designed for teams. It allows users to turn notebooks into powerful data apps and dashboards, combining Python, SQL, R, or even working without writing code at all. With Deepnote, users can query various data sources, generate code, explain code, and create interactive visualizations effortlessly. The platform offers features like collaborative workspaces, scheduling notebooks, deploying APIs, and integrating with popular data warehouses and databases. Deepnote prioritizes security and compliance, providing users with control over data access and encryption. It is loved by a community of data professionals and widely used in universities and by data analysts and scientists.

Streamlit
Streamlit is a web application framework that allows data scientists and machine learning engineers to create interactive web applications quickly and easily. It simplifies the process of building and sharing data-focused applications by providing a simple Python script that can be turned into a shareable web app with just a few lines of code. With Streamlit, users can create interactive visualizations, dashboards, and machine learning models without the need for web development expertise.
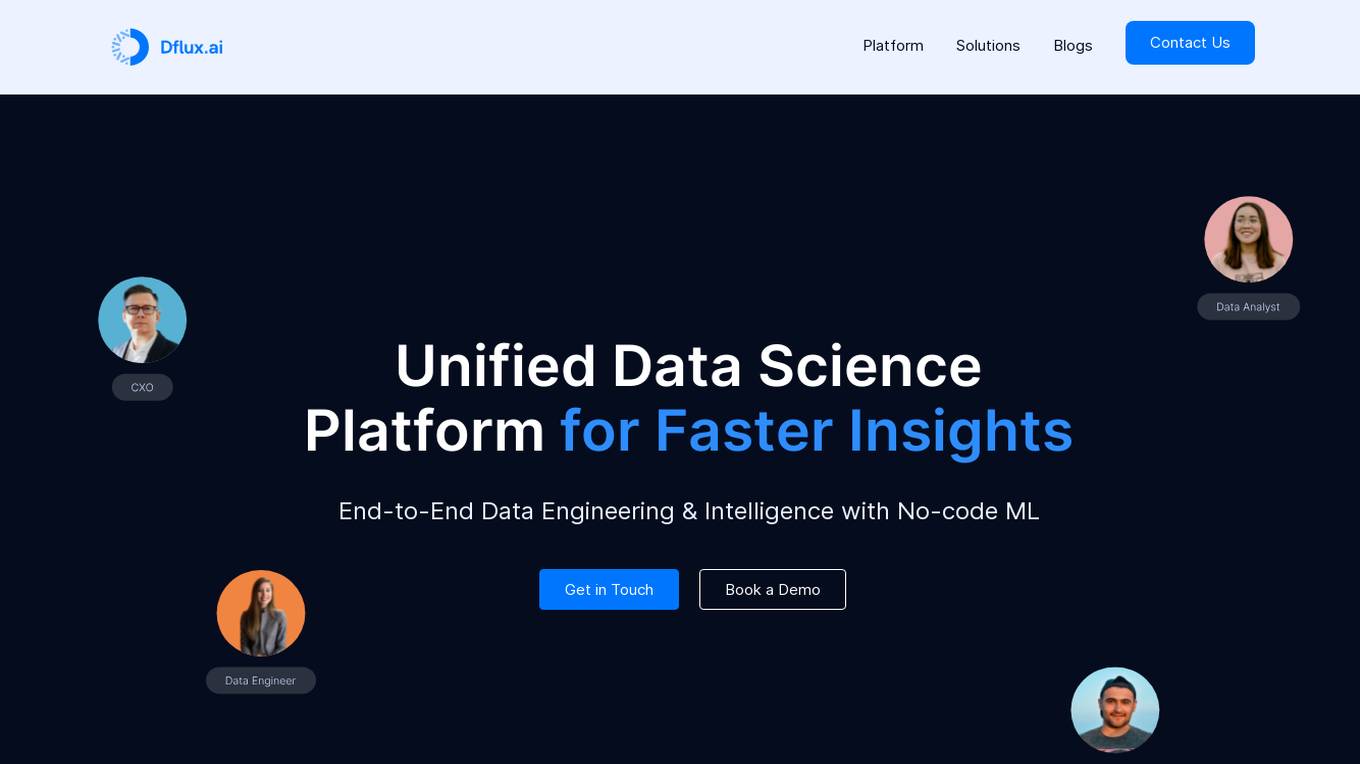
Dflux
Dflux is a cloud-based Unified Data Science Platform that offers end-to-end data engineering and intelligence with a no-code ML approach. It enables users to integrate data, perform data engineering, create customized models, analyze interactive dashboards, and make data-driven decisions for customer retention and business growth. Dflux bridges the gap between data strategy and data science, providing powerful SQL editor, intuitive dashboards, AI-powered text to SQL query builder, and AutoML capabilities. It accelerates insights with data science, enhances operational agility, and ensures a well-defined, automated data science life cycle. The platform caters to Data Engineers, Data Scientists, Data Analysts, and Decision Makers, offering all-round data preparation, AutoML models, and built-in data visualizations. Dflux is a secure, reliable, and comprehensive data platform that automates analytics, machine learning, and data processes, making data to insights easy and accessible for enterprises.
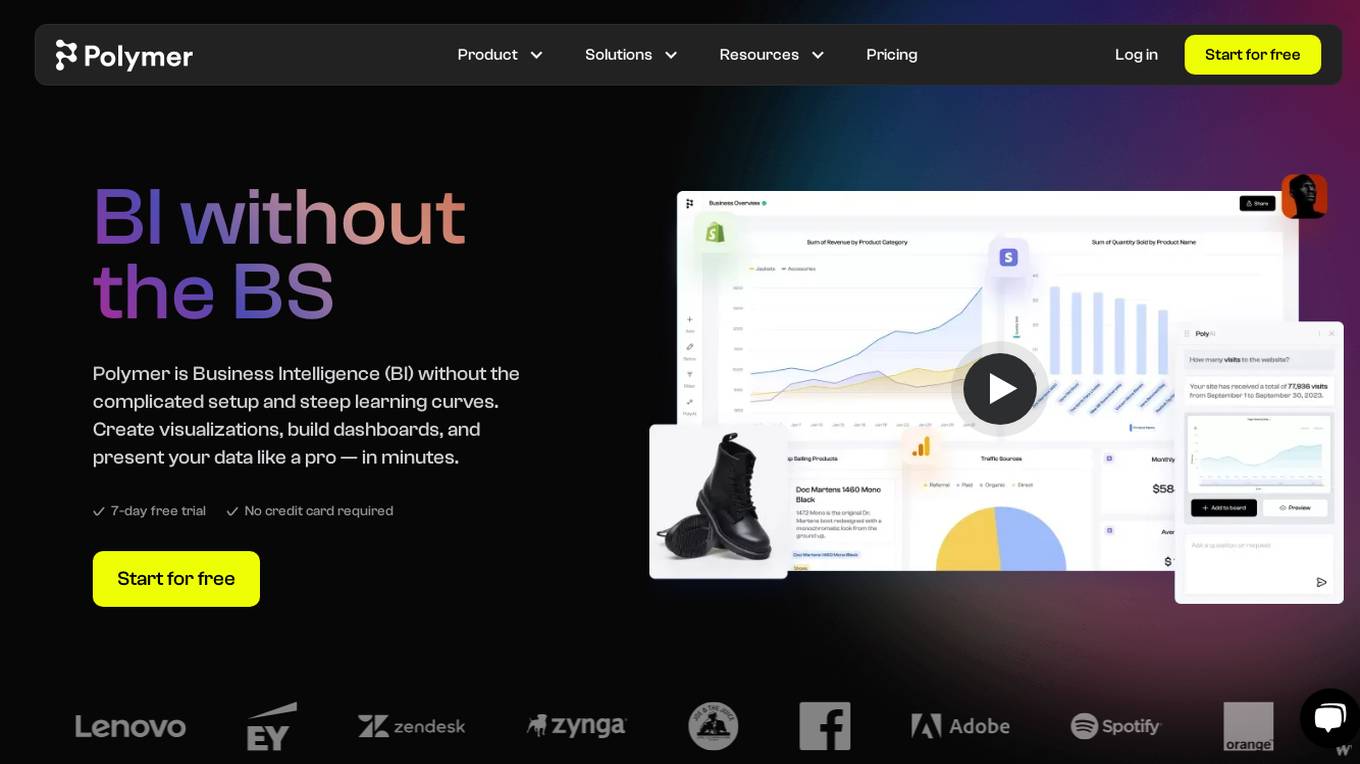
Polymer
Polymer is a business intelligence (BI) tool that makes it easy to connect to your data, build visualizations, and share insights. With Polymer, you don't need to be a data analyst to create beautiful dashboards and interactive reports. Polymer's AI-powered features make it easy to get started, even if you're new to BI. With Polymer, you can:
Claude Artifacts Store
Claude Artifacts Store is an AI-powered platform that offers a wide range of innovative tools and games. It provides users with interactive simulations, gaming experiences, and customization options for cartoon characters. The platform also features strategic planning tools like BCG Matrix visualizations and job search artifacts. With captivating website animations and a word cloud generator, Claude Artifacts Store aims to enhance user engagement and provide a unique online experience.
ChartPixel
ChartPixel is an AI-assisted data analysis platform that empowers users to effortlessly generate charts, insights, and actionable statistics in just 30 seconds. The platform is designed to demystify data and analysis, making it accessible to users of all skill levels. ChartPixel combines the power of AI with domain expertise to provide secure and reliable output, ensuring trustworthy results without compromising data privacy. With user-friendly features and educational tools, ChartPixel helps users clean, wrangle, visualize, and present data with ease, catering to both beginners and professionals.
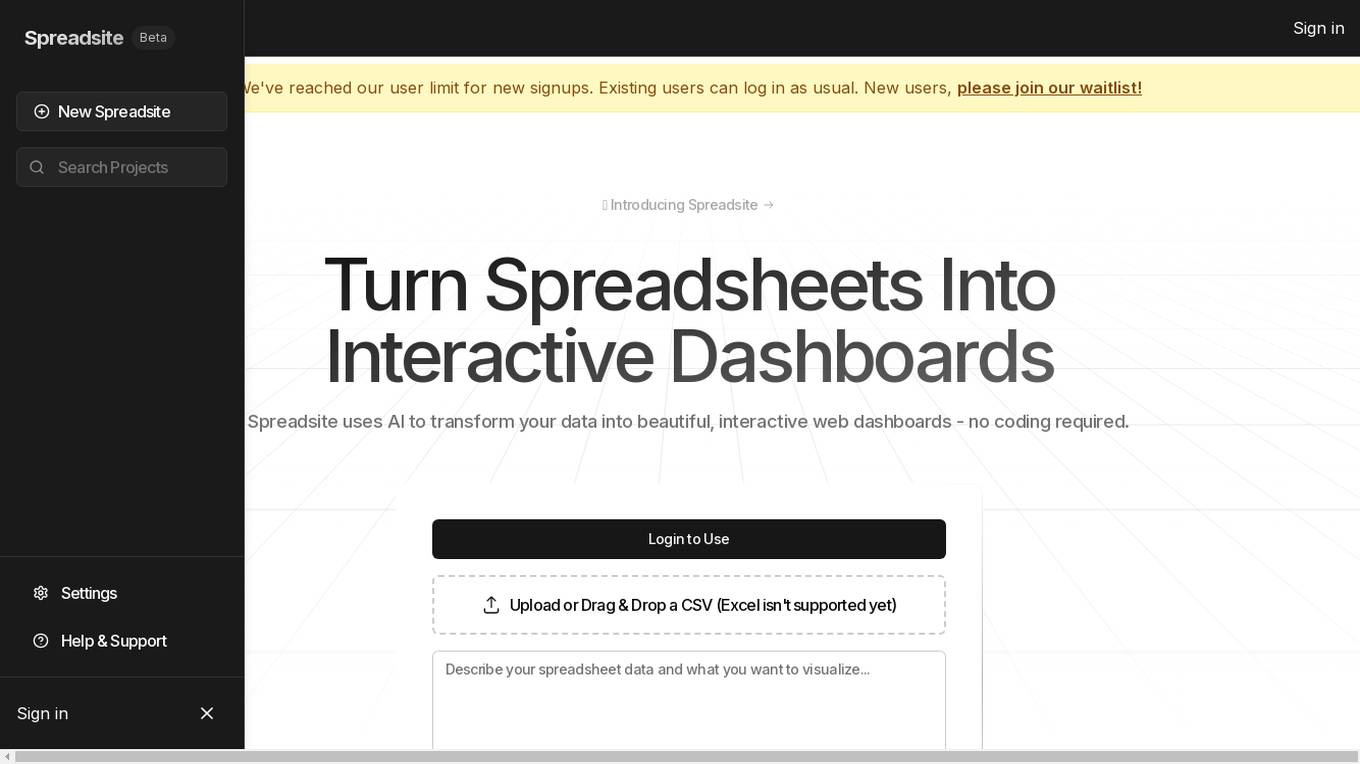
Spreadsite
Spreadsite is an AI-powered platform that turns spreadsheets into interactive web dashboards without the need for coding. It utilizes AI to transform data into visually appealing and interactive dashboards, offering features like agent-powered workflows, interactive data visualization, seamless sharing, and endless possibilities for data exploration. Spreadsite caters to various industries such as finance, marketing, and energy, providing users with the ability to create custom websites from their spreadsheet data effortlessly.
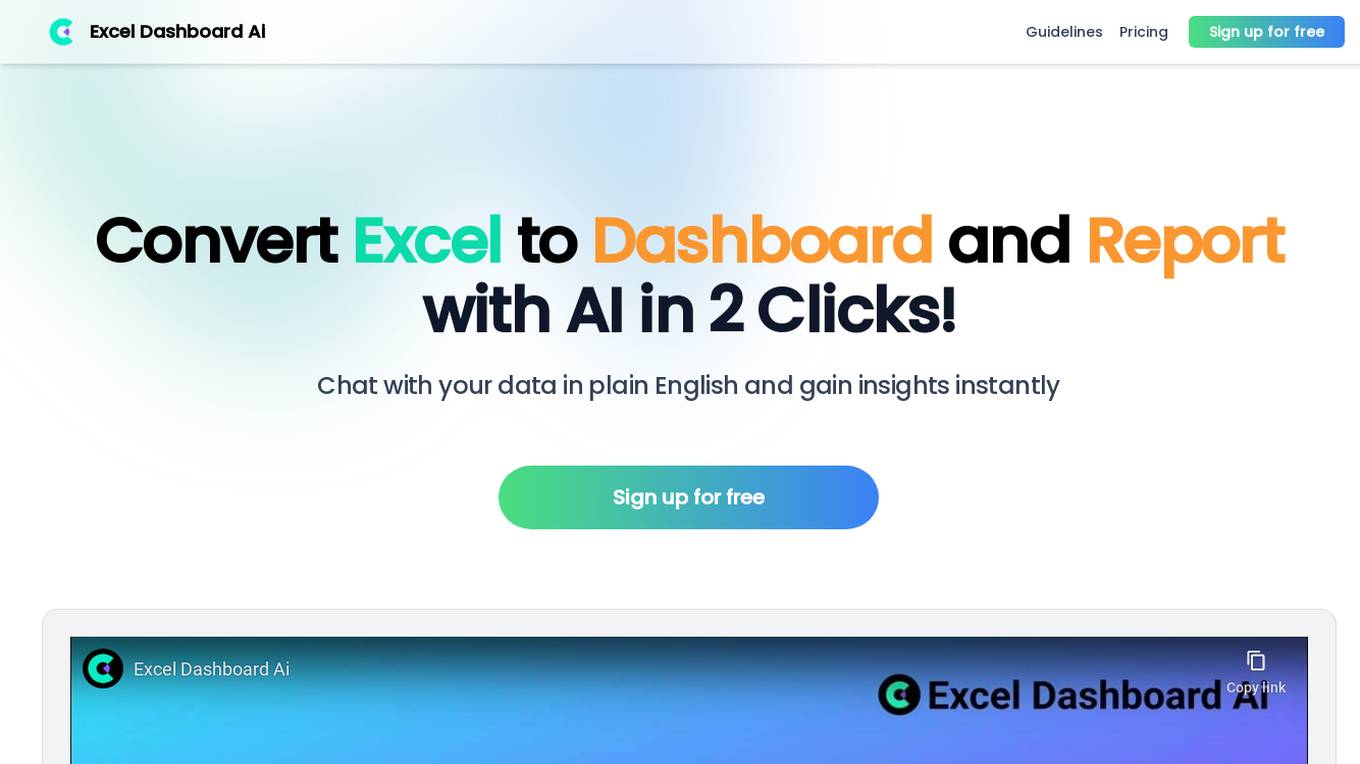
ExcelDashboard Ai
ExcelDashboard Ai is an AI tool that allows users to instantly convert Excel data into interactive dashboards. The tool simplifies the process of creating visually appealing and insightful dashboards without the need for complex coding or design skills. Users can easily upload their Excel files, customize the dashboard layout, and visualize data in a user-friendly format. ExcelDashboard Ai streamlines the dashboard creation process, saving time and effort for individuals and businesses looking to present data in a more engaging way.
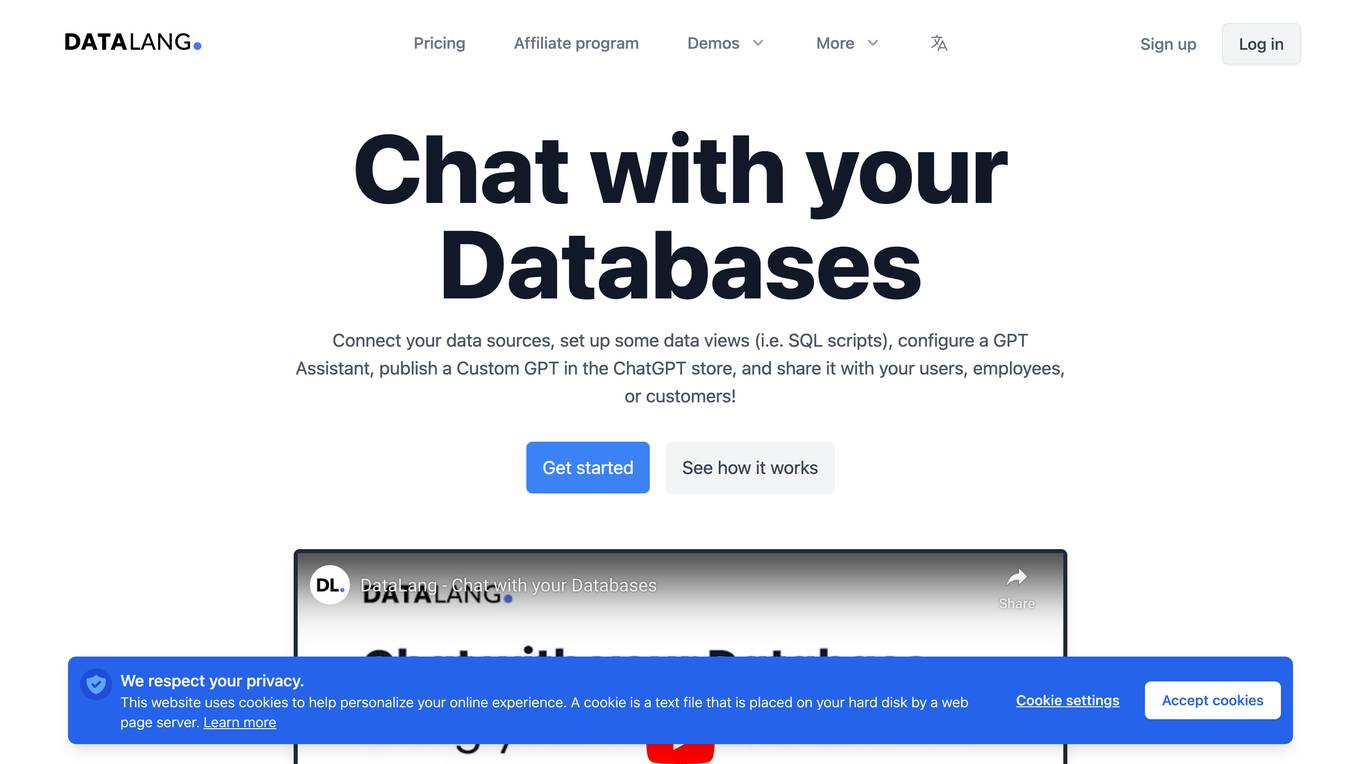
DataLang
DataLang is a tool that allows you to chat with your databases, expose a specific set of data (using SQL) to train GPT, and then chat with it in natural language. You can also use DataLang to automatically make your SQL views available via API, share it with your privately users, or make it public.
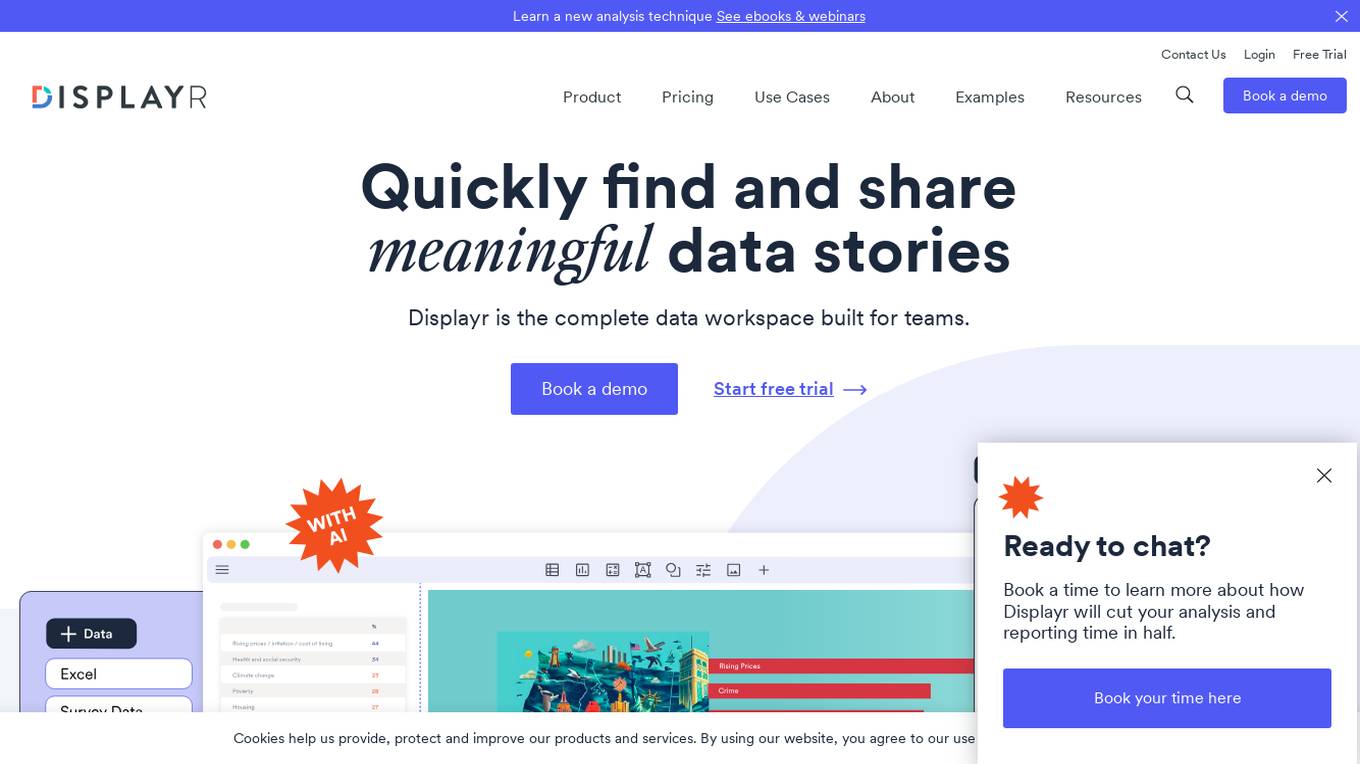
Displayr
Displayr is a comprehensive data workspace designed for teams, offering a range of capabilities including survey analysis, data visualization, dashboarding, automatic updating, PowerPoint reporting, finding data stories, and data cleaning. The platform aims to streamline workflow efficiency, promote self-sufficiency through DIY analytics, enable data storytelling with compelling narratives, and ensure quality control to minimize errors. Displayr caters to statisticians, market researchers, report creators, and professionals working with data, providing a user-friendly interface for creating interactive and insightful data stories.
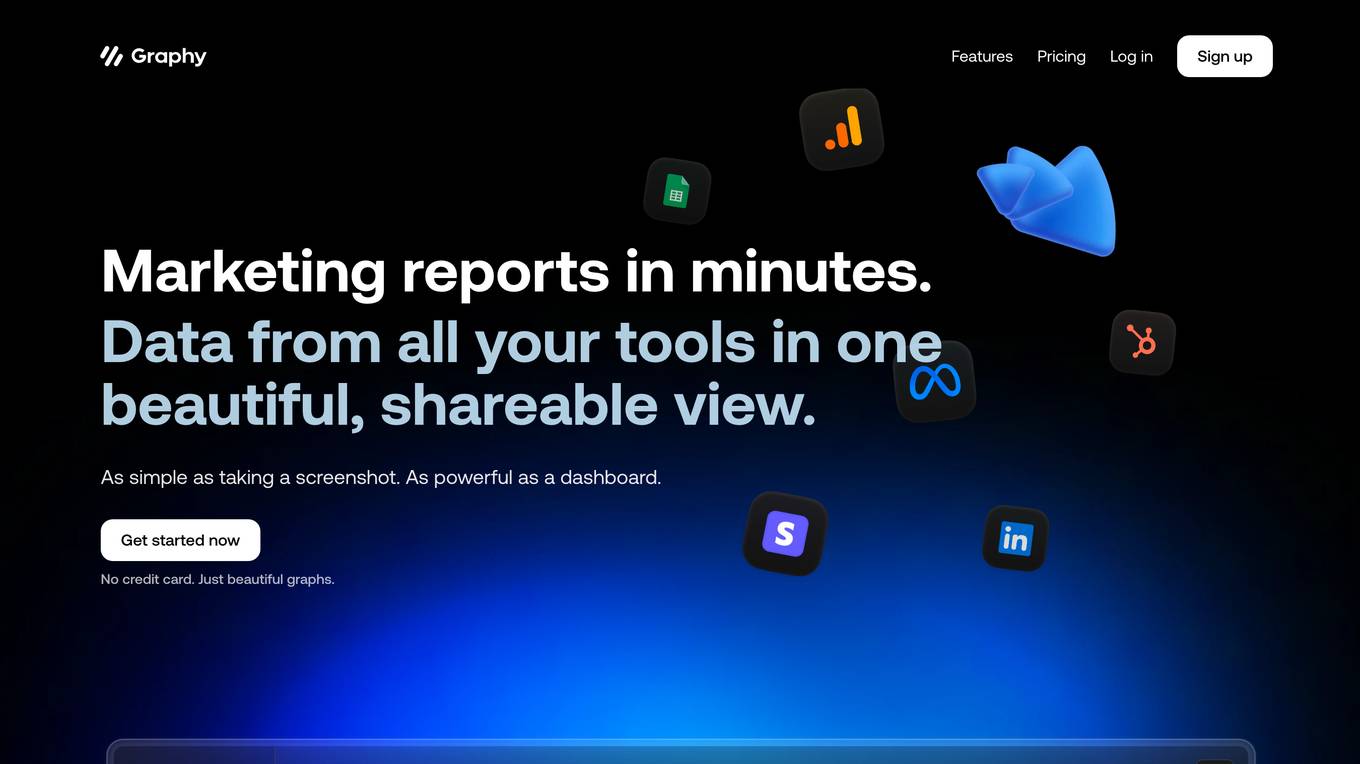
Graphy
Graphy is a data visualization and reporting tool that helps marketers create beautiful, interactive reports in minutes. It is powered by AI to increase productivity and make data more accessible and understandable. With Graphy, you can unify your data from all your tools into a single, shareable view. You can also explore data in the tools you've already mastered, then save it in Graphy to tell your data story with AI Insights, comments, annotations, goals, trend lines, and even emojis.
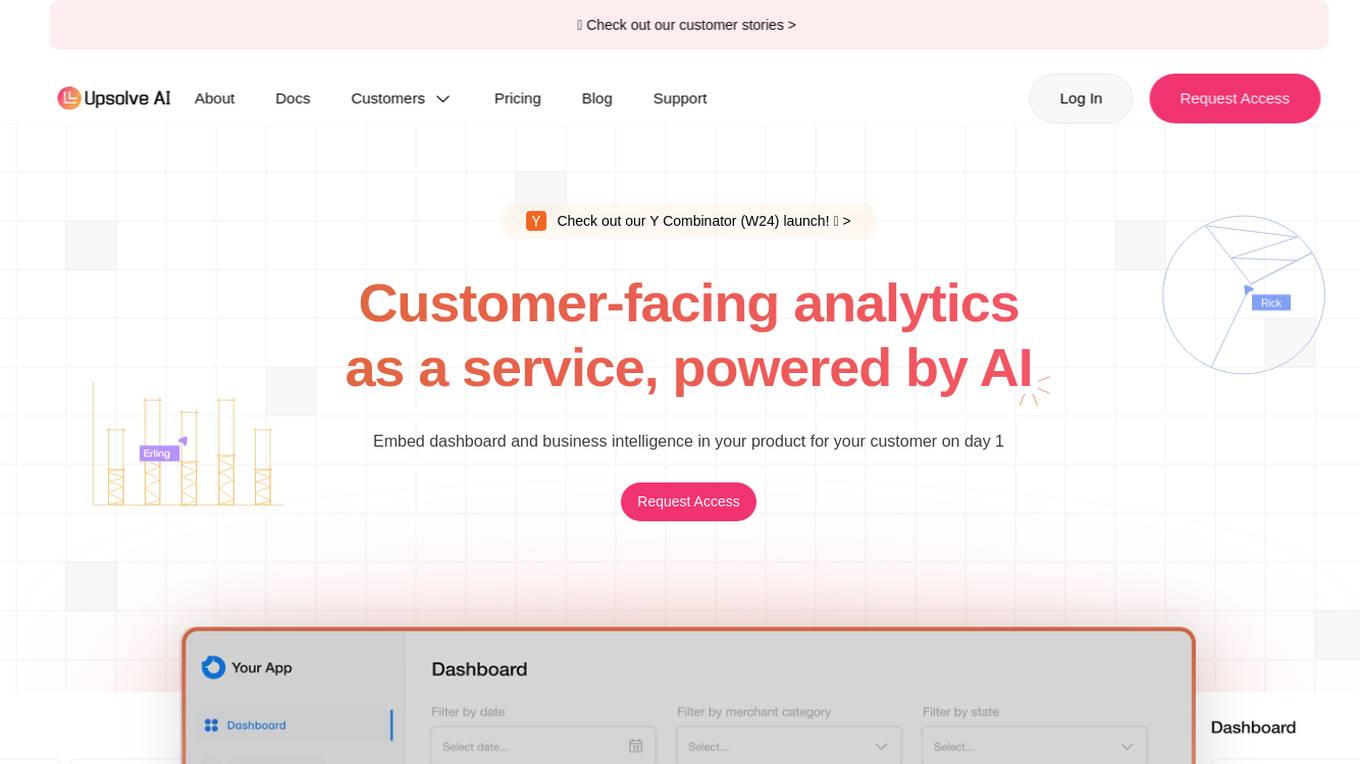
Upsolve AI
Upsolve AI is a customer-facing analytics service powered by AI that allows businesses to embed dashboard and business intelligence in their products for customers. It manages customer analytics, empowers users with product data insights, and provides out-of-the-box connections to popular databases. With features like building interactive analytics dashboards, creating custom charts, and offering self-service customization, Upsolve AI aims to help businesses make data-driven decisions and communicate values to stakeholders. The platform also offers easy deployment, theme customization, and AI-powered chart exploration for enhanced user experience.
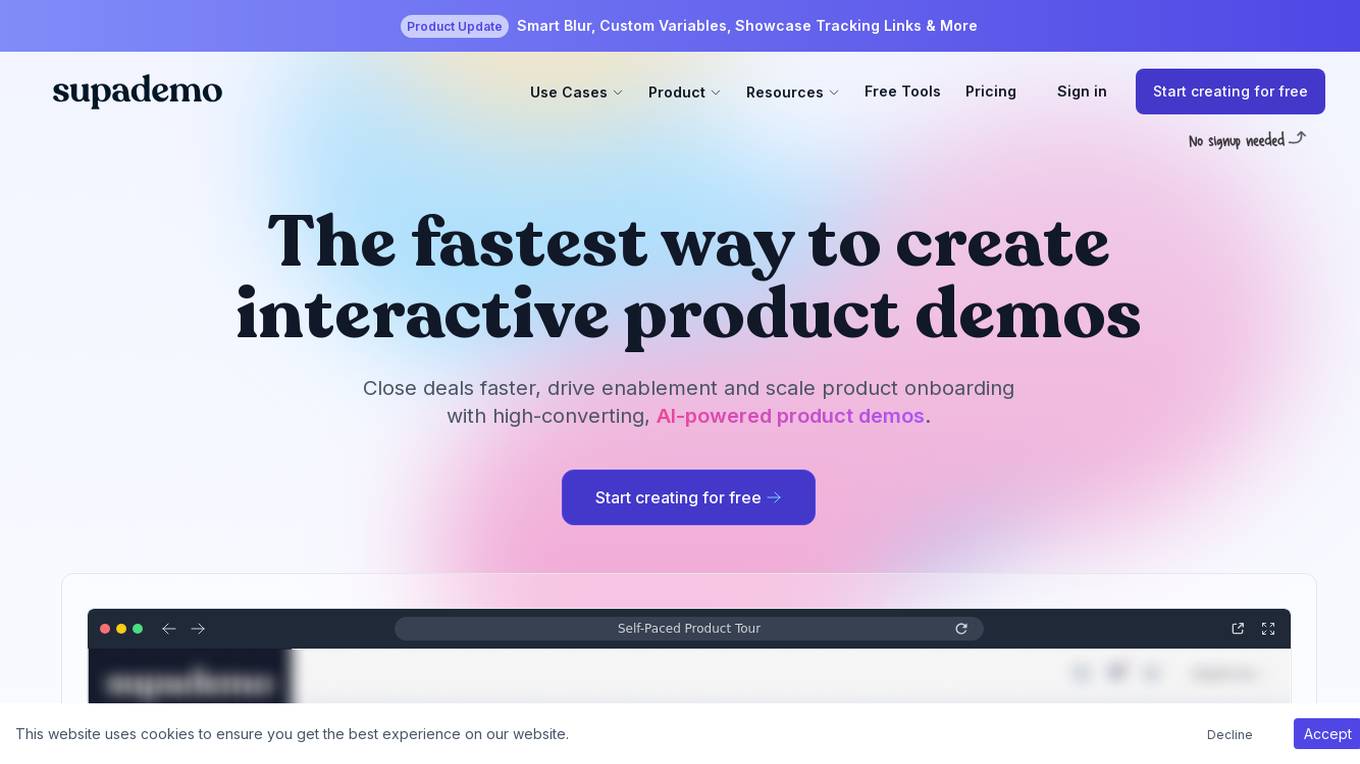
Supademo
Supademo is an AI-powered platform that enables users to create interactive product demos quickly and efficiently. It helps in driving enablement, scaling product onboarding, and closing deals faster. With features like Smart Blur, Custom Variables, Showcase Tracking Links, and more, Supademo offers a seamless way to replace static screenshots and video monologues. Users can personalize demos, enhance them with AI-generated content, and share them across various platforms. The platform also provides advanced analytics, team workspaces, and in-app tours to improve user engagement and drive conversions.
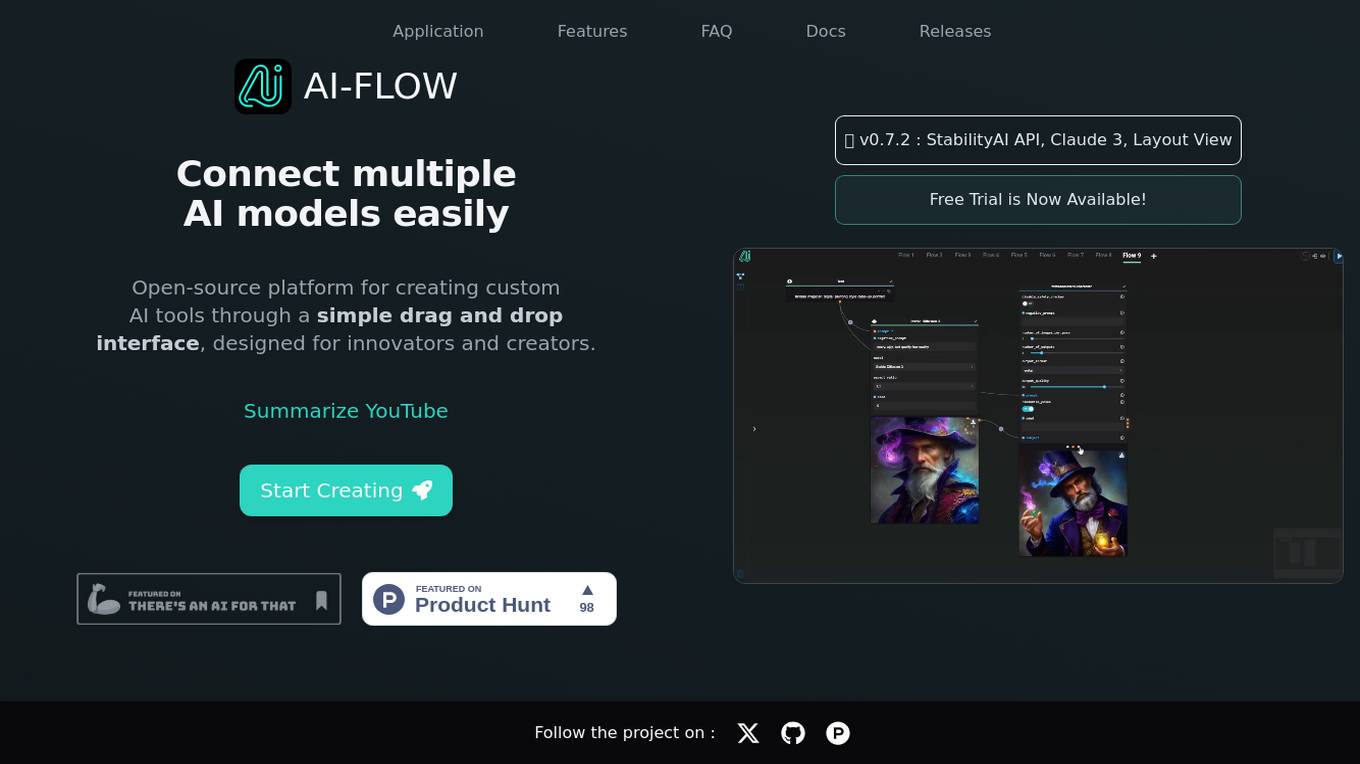
AI-Flow
AI-Flow is an open-source platform designed for innovators and creators to easily connect and integrate multiple AI models. Users can create custom AI tools through a simple drag-and-drop interface, experiment with AI models, and discover tailored AI solutions for their specific needs. The platform offers features like combining AI models seamlessly, building custom AI tools quickly, and automating AI-powered story creation. AI-Flow is suitable for individuals and businesses looking to leverage artificial intelligence for various tasks and projects.
0 - Open Source AI Tools
20 - OpenAI Gpts
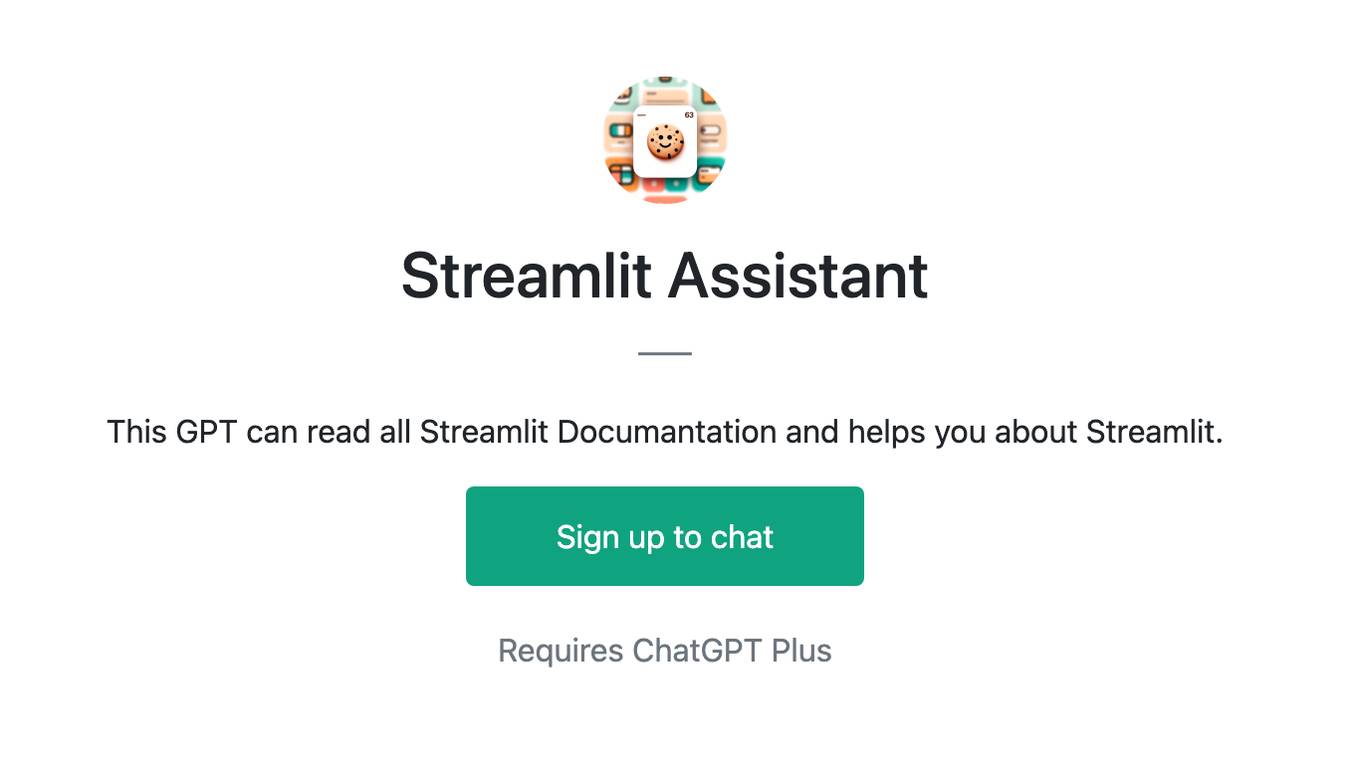
Streamlit Assistant
This GPT can read all Streamlit Documantation and helps you about Streamlit.

Flex MindMap Generator
なんでもマインドマップにするGPTです。テーマを指定すると関連するサブテーマに展開したマインドマップを作成し、具体的な情報(URL,txtなど)を提供すると、その情報に基づいたマインドマップを作成します。

Education AI Strategist
I provide a structured way of using AI to support teaching and learning. I use the the CHOICE method (i.e., Clarify, Harness, Originate, Iterate, Communicate, Evaluate) to ensure that your use of AI can help you meet your educational goals.
Interactive Spring API Creator
Pass in the attributes of Pojo entity class objects, generate corresponding addition, deletion, modification, and pagination query functions, including generating database connection configuration files yaml and database script files, as well as XML dynamic SQL concatenation statements.
Retool-Helper
Robust Retool app development guide with interactive examples, personalized paths, and community features.
AI Dissertation Guru
Comprehensive dissertation aid with interactive and analytical tools
Conceptual Intelligence
The world's first interactive Al Agency. (Previously Conceptuality)
GPT URL Tracking Tag Wizard
Interactive step-by-step UTM Tag Generator for marketing campaigns.

Excelのショートカットキー答えられるかな?クイズジェネレーター
私はExcelのショートカットキーのクイズを出題するボットです。私の出した問題に正しく回答してください。採点します。
Fabric Journey Builder
Build geospatial mixed-reality experiences for live events using Fabric's Platform
![[latest] Vue.js GPT Screenshot](/screenshots_gpts/g-LXEGvZLUS.jpg)
[latest] Vue.js GPT
Versatile, up-to-date Vue.js assistant with knowledge of the latest version. Part of the [latest] GPTs family.
Prompt Peerless - Complete Prompt Optimization
Premier AI Prompt Engineer for Advanced LLM Optimization, Enhancing AI-to-AI Interaction and Comprehension. Create -> Optimize -> Revise iteratively
Notion Formula Assistant
A GPT specialized in Notion formulas, emphasizing accuracy and iterative solutions.
Apple MapKit Complete Code Expert
A detailed expert trained on all 5,961 pages of Apple MapKit, offering complete coding solutions. Saving time? https://www.buymeacoffee.com/parkerrex ☕️❤️