Best AI tools for< Create Data Visualizations >
20 - AI tool Sites
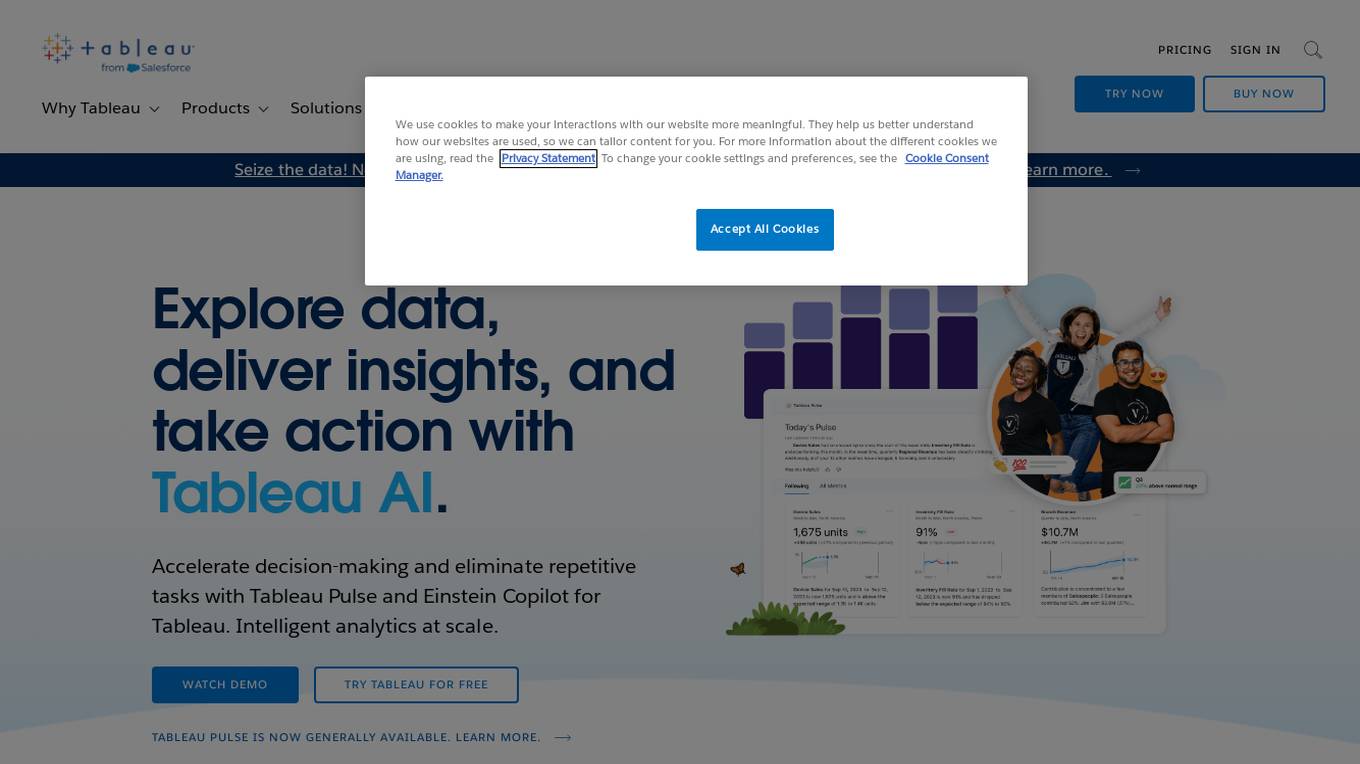
Tableau
Tableau is a visual analytics platform that helps people see, understand, and act on data. It is used by organizations of all sizes to solve problems, make better decisions, and improve operations. Tableau's platform is intuitive and easy to use, making it accessible to people of all skill levels. It also offers a wide range of features and capabilities, making it a powerful tool for data analysis and visualization.
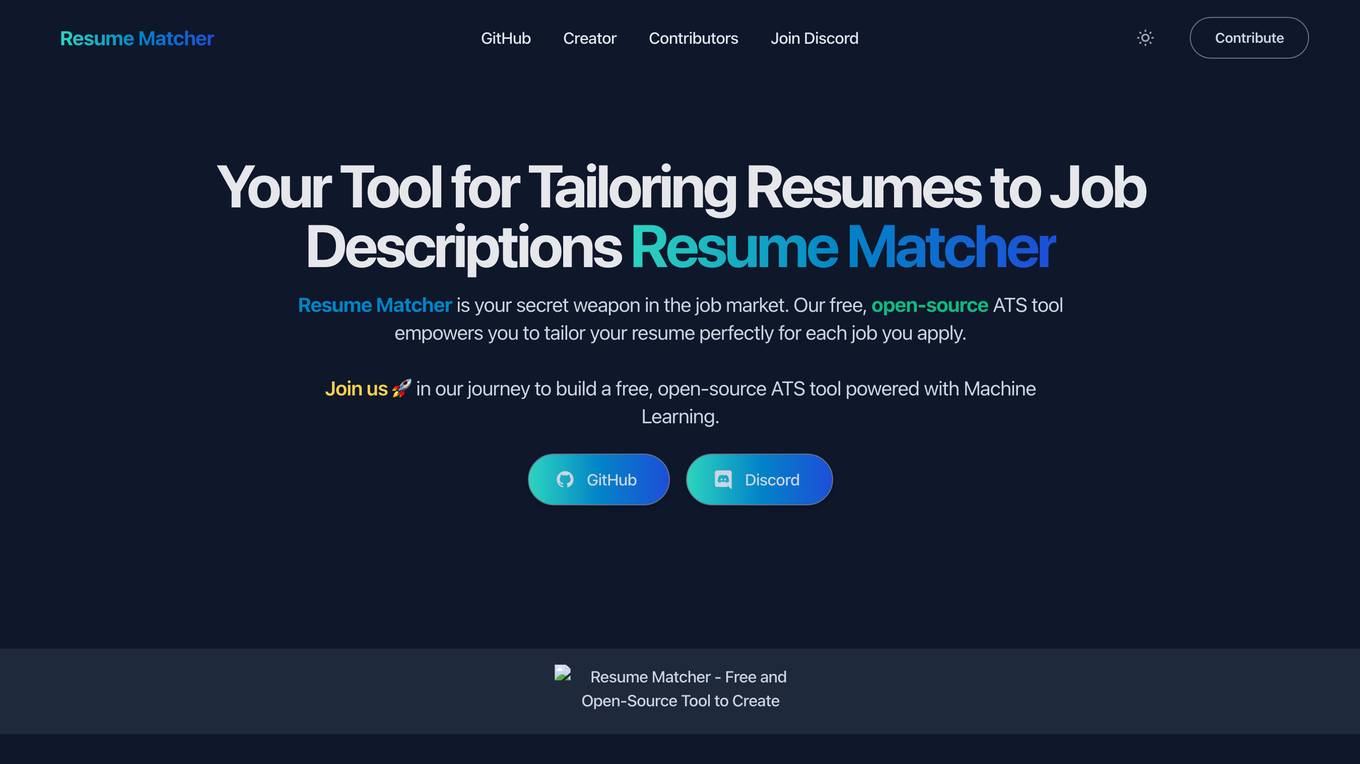
Resume Matcher
Resume Matcher is a free, open-source Applicant Tracking System (ATS) tool that uses Machine Learning and Natural Language Processing to match resumes with job descriptions. It empowers users to tailor their resumes for each job application by providing insights on similarities and differences between the resume and job requirements. The platform offers data visualizations, text similarity analysis, and plans to incorporate advanced features like Vector Similarity. With a user-friendly interface and Python-based technology, Resume Matcher aims to simplify the job search process for developers.
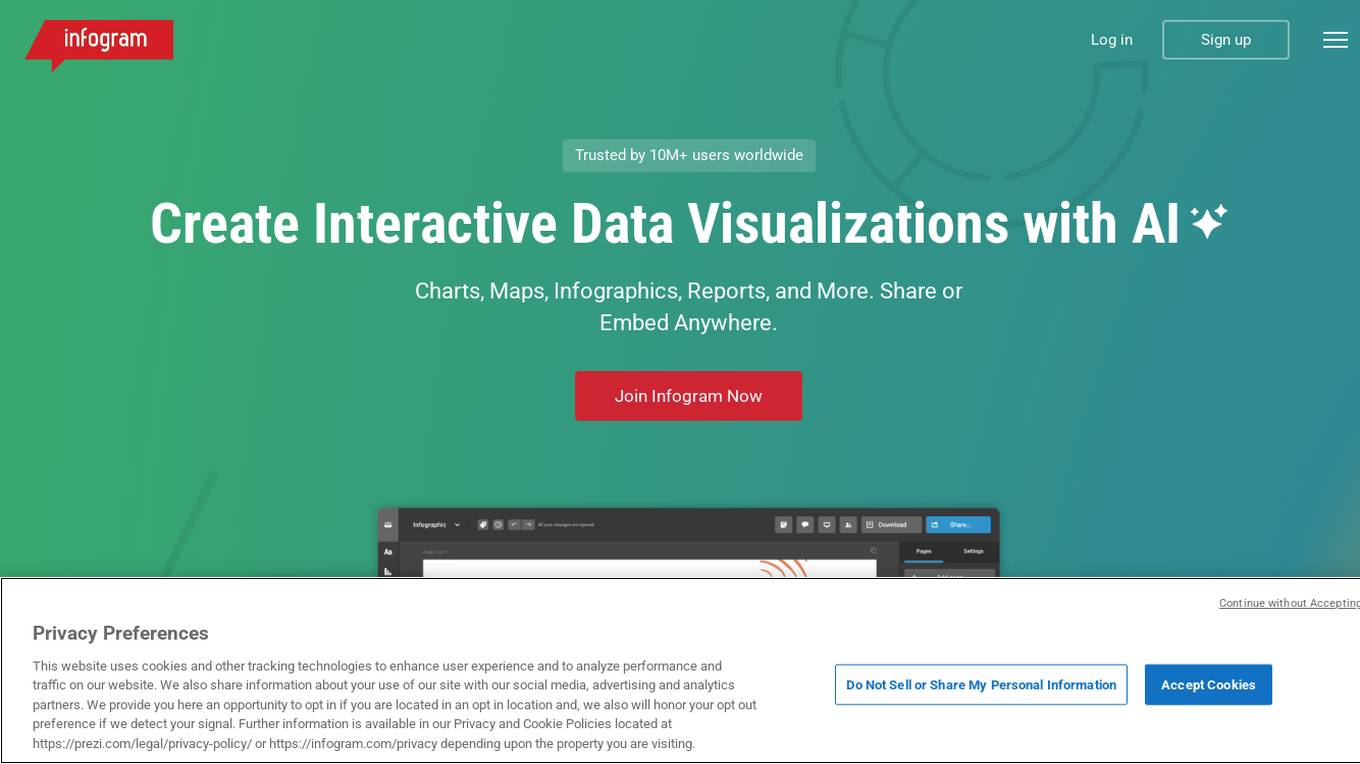
Infogram
Infogram is an AI-powered platform that enables users to create interactive data visualizations, infographics, reports, maps, charts, tables, slides, and dashboards effortlessly. With a wide range of features such as AI chart recommendations, interactive content, embeds, custom maps, data import, and advanced editing tools, Infogram empowers users to craft compelling visual stories. The platform also offers content engagement analytics, real-time collaboration, and a brand kit for consistent branding. Trusted by over 10 million users worldwide, Infogram is a go-to tool for individuals, teams, and organizations looking to transform data into engaging visuals.

Julius AI
Julius AI is an advanced AI data analyst tool that allows users to analyze data with computational AI, chat with files to get expert-level insights, create sleek data visualizations, perform modeling and predictive forecasting, solve math, physics, and chemistry problems, generate polished analyses and summaries, save time by automating data work, and unlock statistical modeling without complexity. It offers features like generating visualizations, asking data questions, effortless cleaning, instant data export, creating animations, and supercharging data analysis. Julius AI is loved by over 1,200,000 users worldwide and is designed to help knowledge workers make the most out of their data.
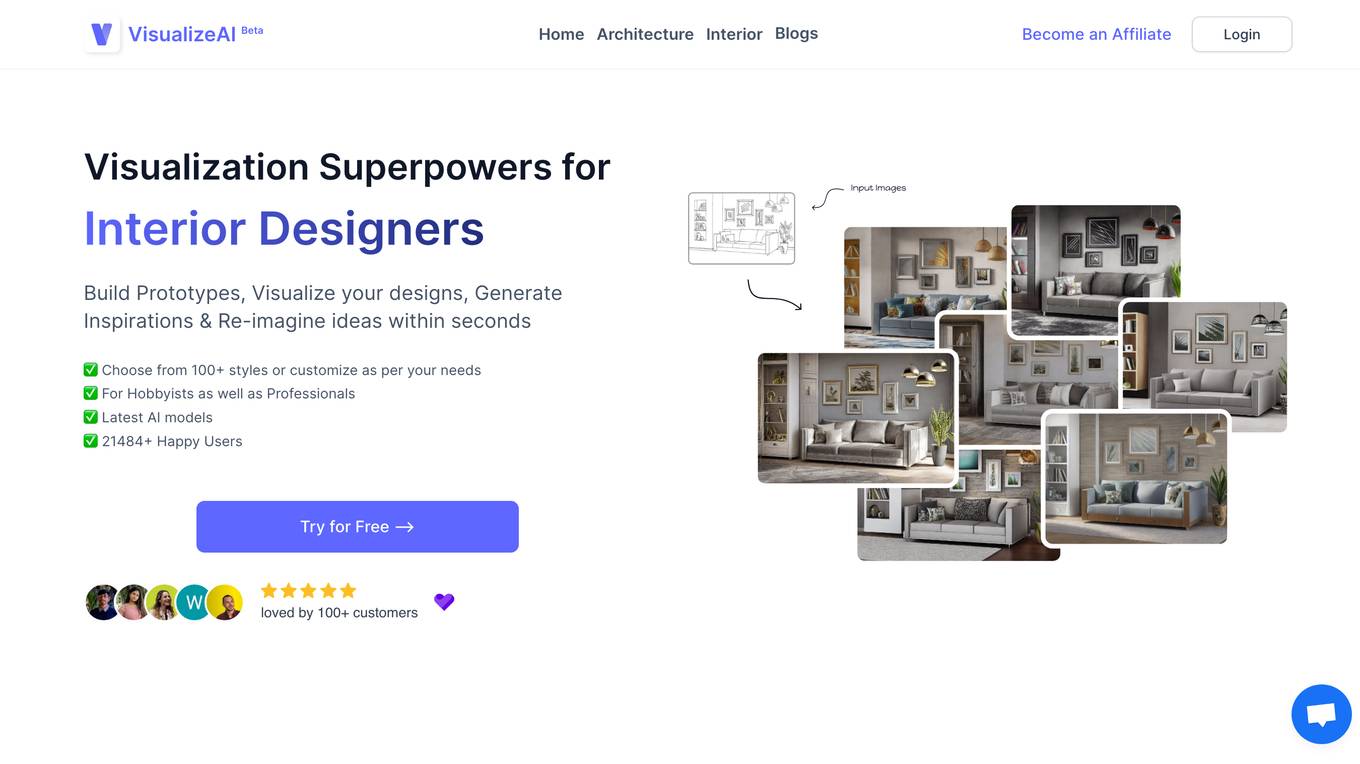
VisualizeAI
VisualizeAI is a powerful AI-powered platform that helps businesses visualize and analyze their data. With VisualizeAI, you can easily create stunning data visualizations, dashboards, and reports that will help you make better decisions. VisualizeAI is perfect for businesses of all sizes, from startups to large enterprises. It is easy to use and affordable, and it can help you save time and money while improving your decision-making.
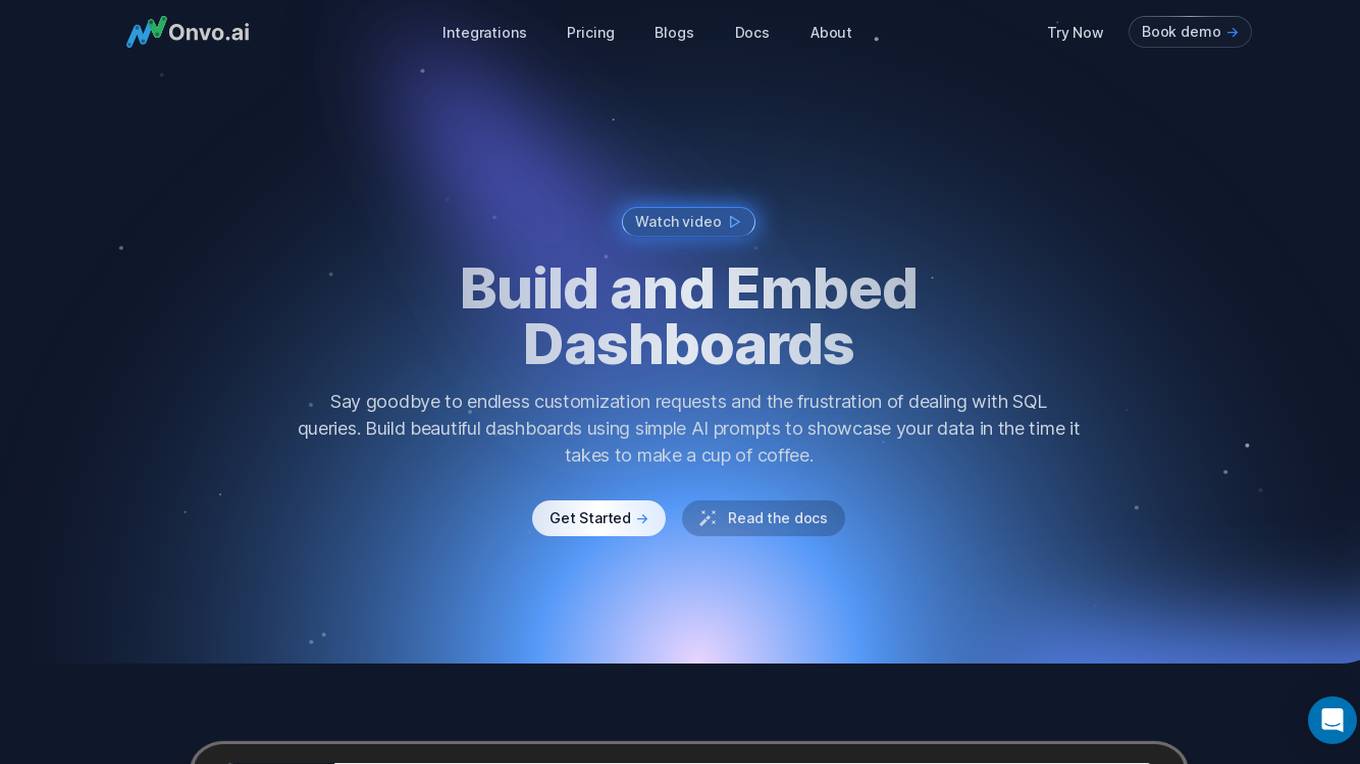
Onvo AI
Onvo AI is an embedded data visualization platform that allows users to create interactive dashboards and data visualizations using simple AI prompts. It connects to various data sources, enabling users to build insightful charts and visualizations without the need for complex queries or manual data manipulation. Onvo AI offers customization options, allowing users to match their brand's identity and provides secure sharing and embedding features. It also includes analytics capabilities, enabling users to track dashboard usage and user engagement.
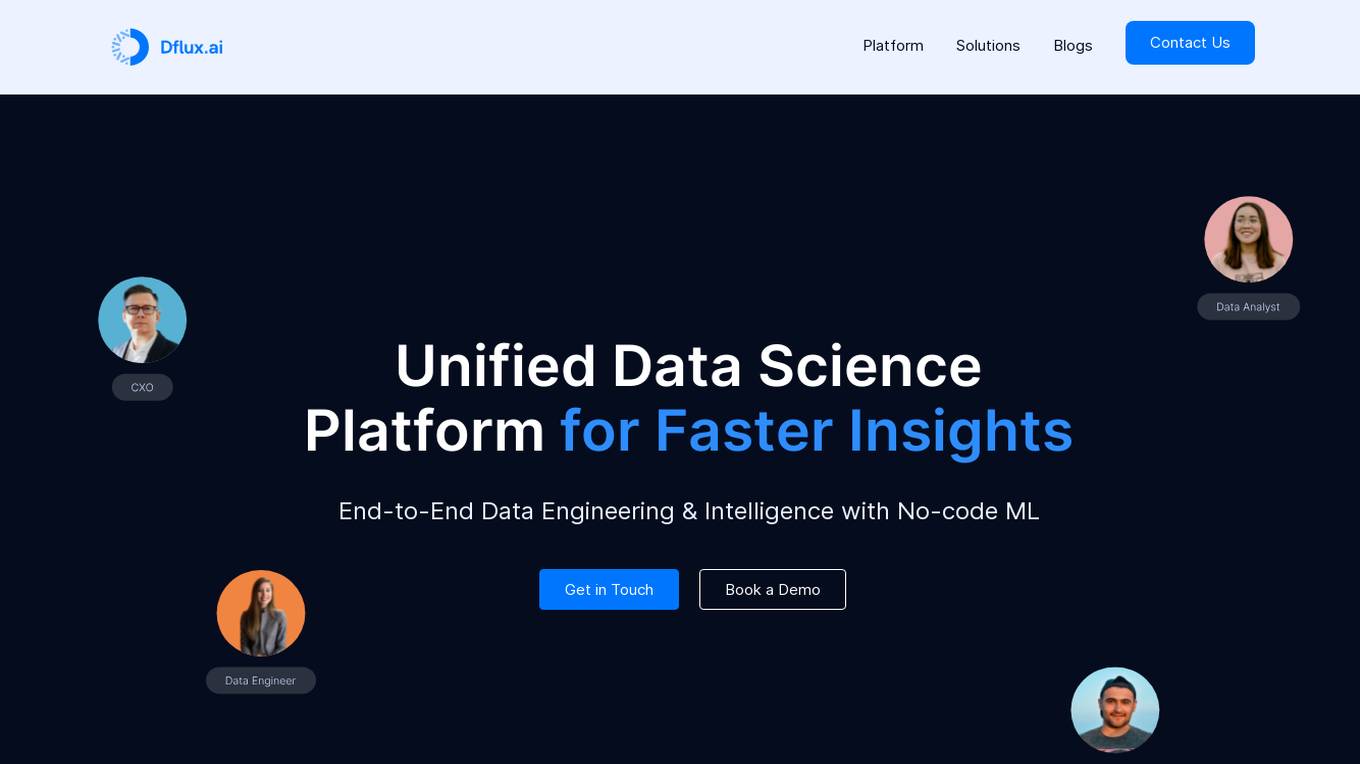
Dflux
Dflux is a cloud-based Unified Data Science Platform that offers end-to-end data engineering and intelligence with a no-code ML approach. It enables users to integrate data, perform data engineering, create customized models, analyze interactive dashboards, and make data-driven decisions for customer retention and business growth. Dflux bridges the gap between data strategy and data science, providing powerful SQL editor, intuitive dashboards, AI-powered text to SQL query builder, and AutoML capabilities. It accelerates insights with data science, enhances operational agility, and ensures a well-defined, automated data science life cycle. The platform caters to Data Engineers, Data Scientists, Data Analysts, and Decision Makers, offering all-round data preparation, AutoML models, and built-in data visualizations. Dflux is a secure, reliable, and comprehensive data platform that automates analytics, machine learning, and data processes, making data to insights easy and accessible for enterprises.
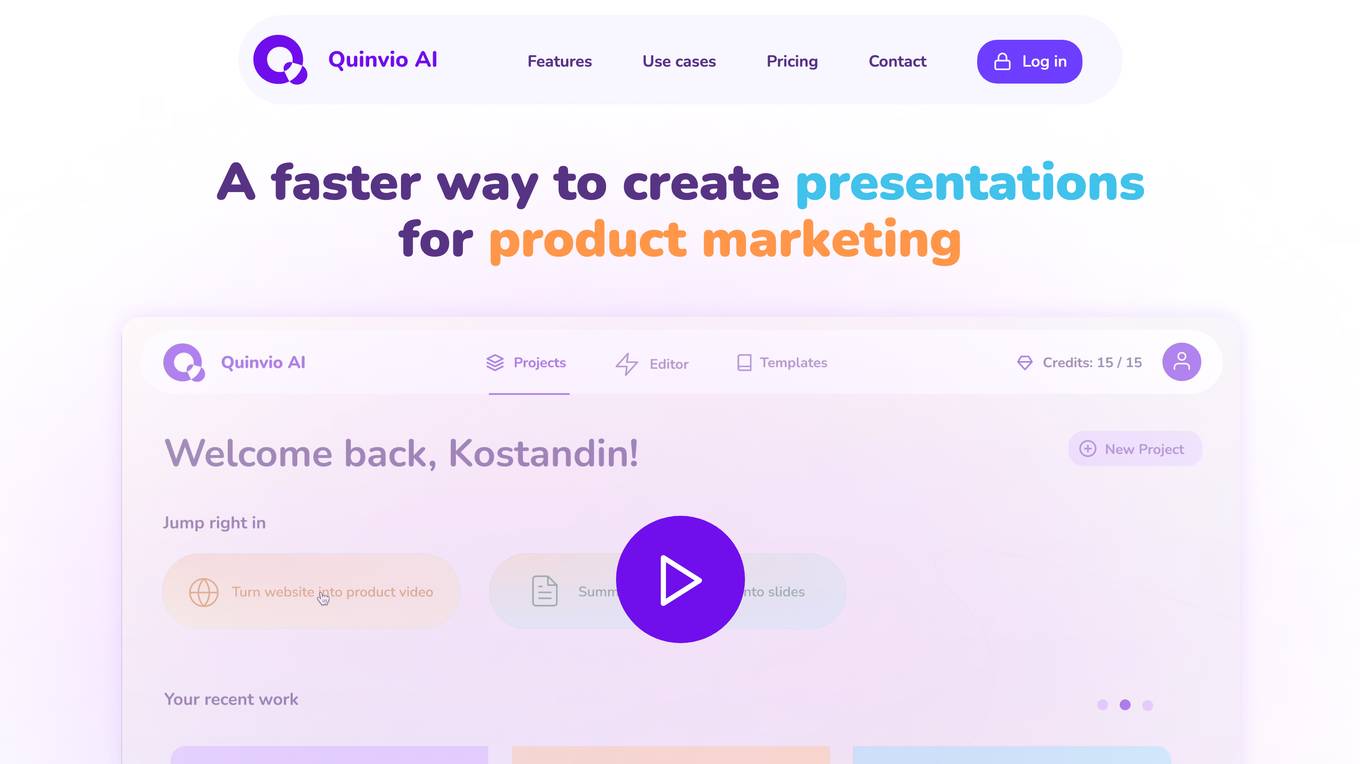
Quinvio
Quinvio is an AI-powered presentation tool that helps users create engaging and professional presentations effortlessly. With Quinvio, users can easily design visually appealing slides, generate insightful data visualizations, and enhance their presentations with AI-driven suggestions. The platform offers a user-friendly interface and a range of templates to streamline the presentation creation process. Quinvio aims to revolutionize the way presentations are made by leveraging AI technology to empower users with impactful and impressive presentation capabilities.
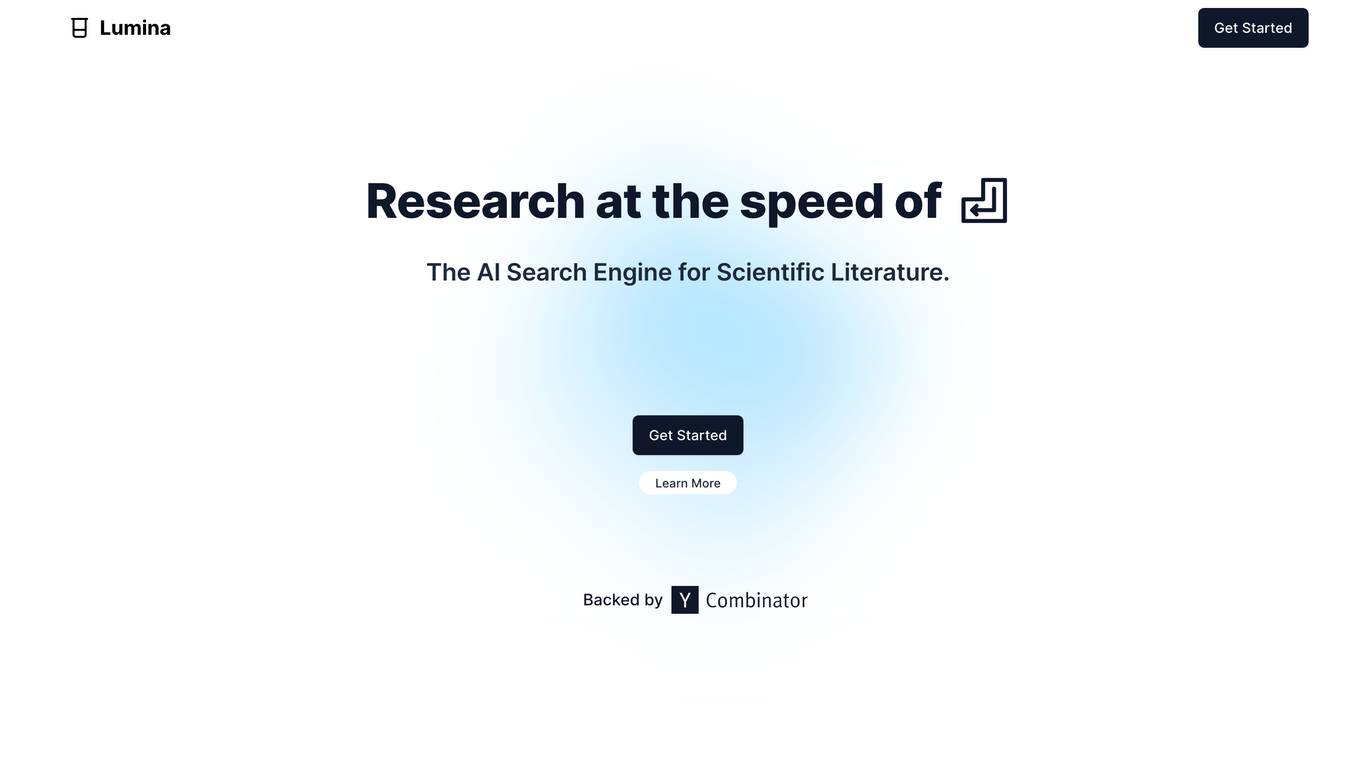
Lumina
Lumina is a research tool that uses artificial intelligence to help researchers find and analyze information more quickly and easily. It can be used to search for articles, books, and other resources, and it can also be used to analyze data and create visualizations. Lumina is designed to make research more efficient and productive.
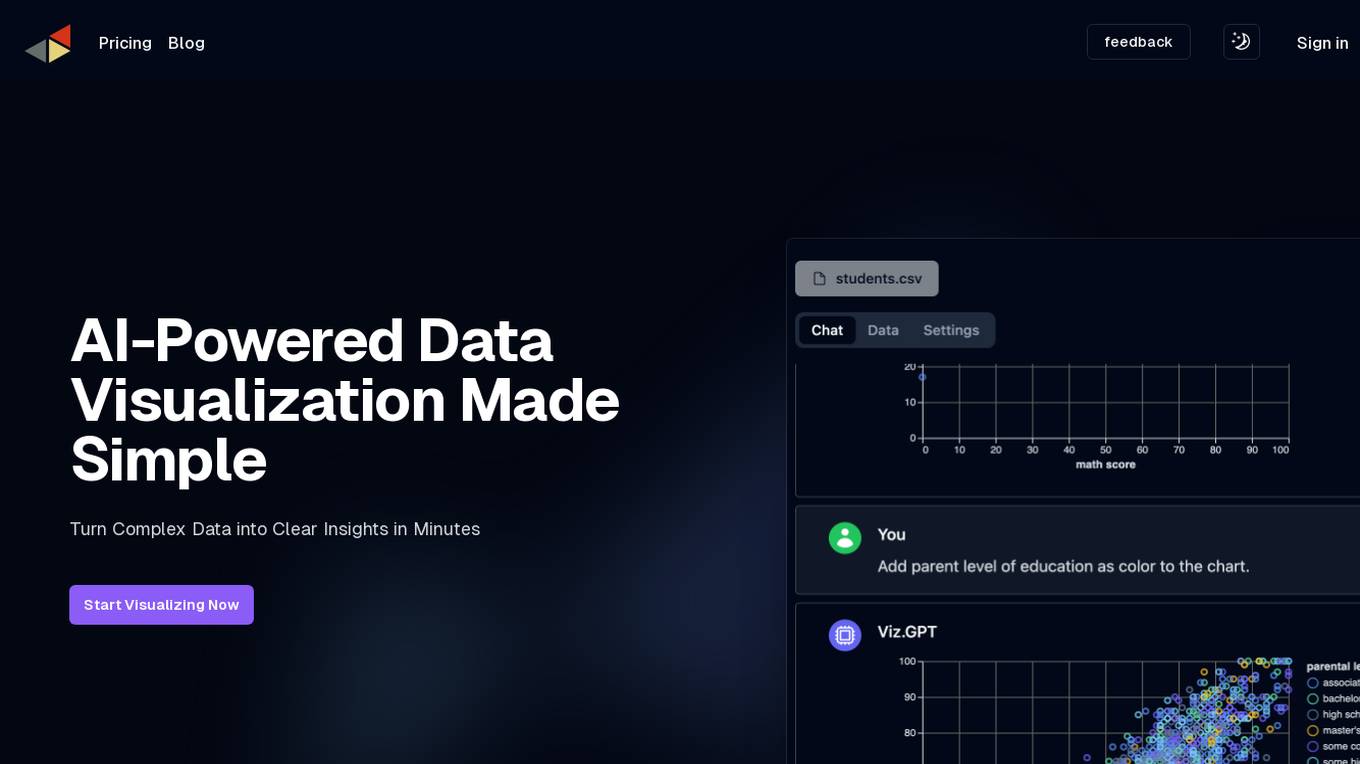
vizGPT
vizGPT is an AI-powered data visualization tool that simplifies the process of turning complex data into clear insights. The software offers contextual understanding, intelligent conversation, and natural language processing capabilities to help users quickly generate and understand complex visualizations. With real-time responses and contextual memory features, vizGPT provides a seamless data storytelling experience. Users can create visualizations using a no-code GUI with drag-and-drop functionality and leverage powerful data transformation and profiling tools. vizGPT aims to revolutionize data visualization by offering an intuitive and efficient solution for data analysis.
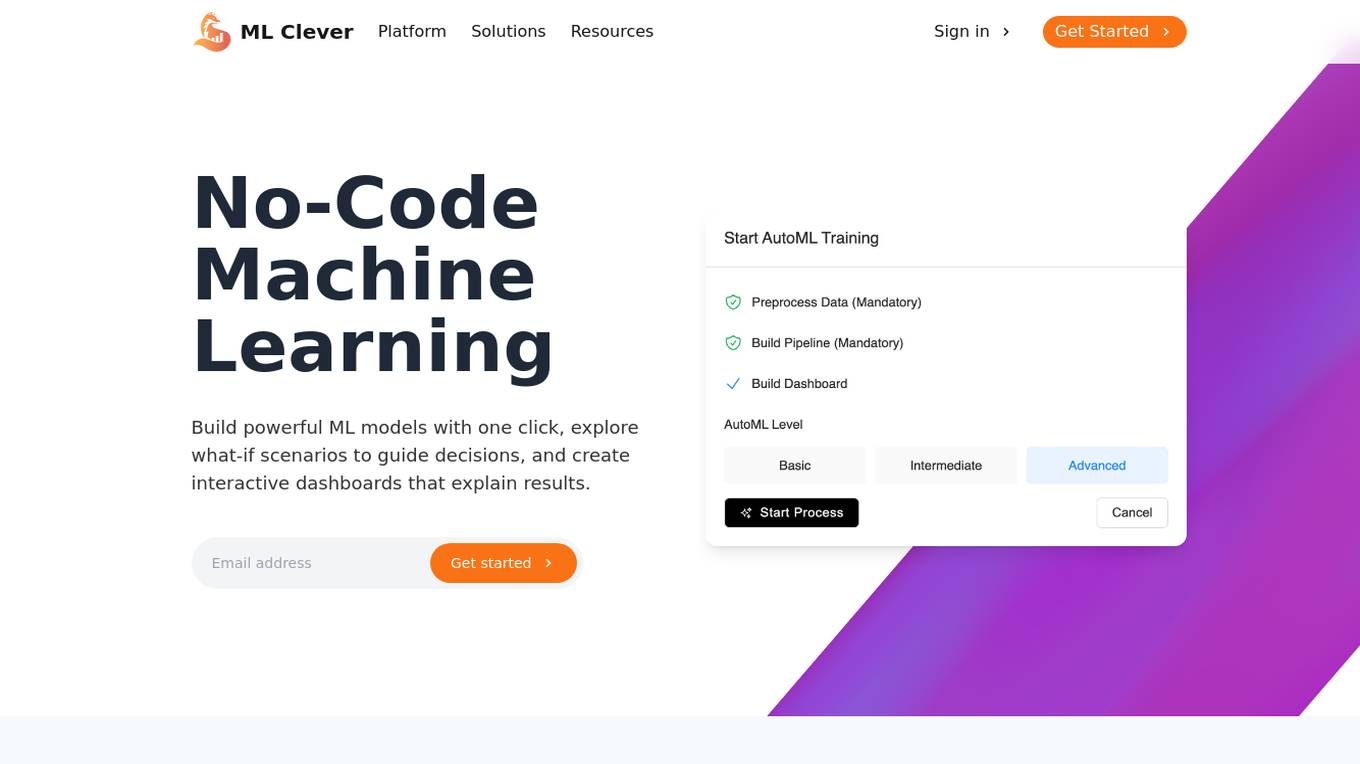
ML Clever
ML Clever is a no-code machine learning platform that empowers users to build powerful ML models with one click, explore what-if scenarios to guide decisions, and create interactive dashboards to explain results. It combines automated machine learning, interactive dashboards, and flexible prediction tools in one platform, allowing users to transform data into business insights without the need for data scientists or coding skills.
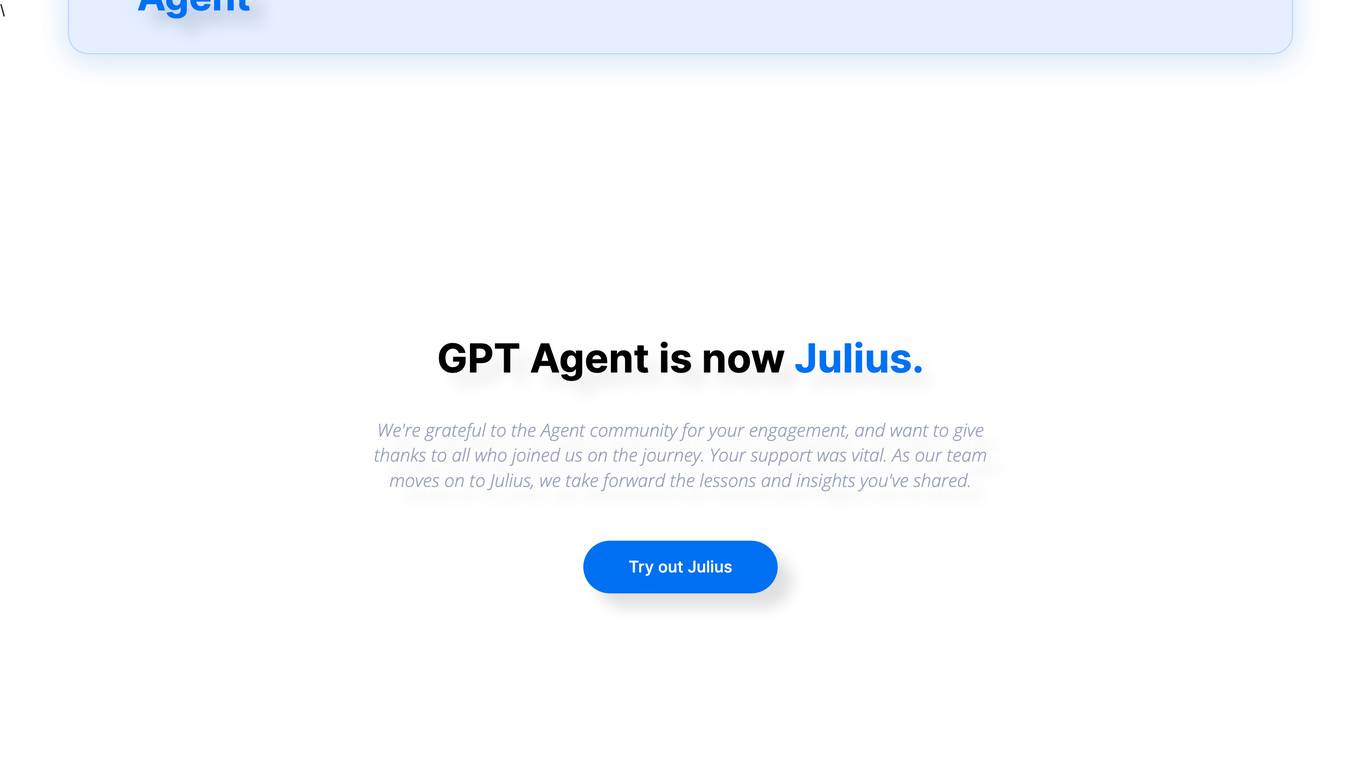
Julius
Julius is an AI-powered tool that helps users analyze data and files. It can perform various tasks such as generating visualizations, answering data questions, and performing statistical modeling. Julius is designed to save users time and effort by automating complex data analysis tasks.
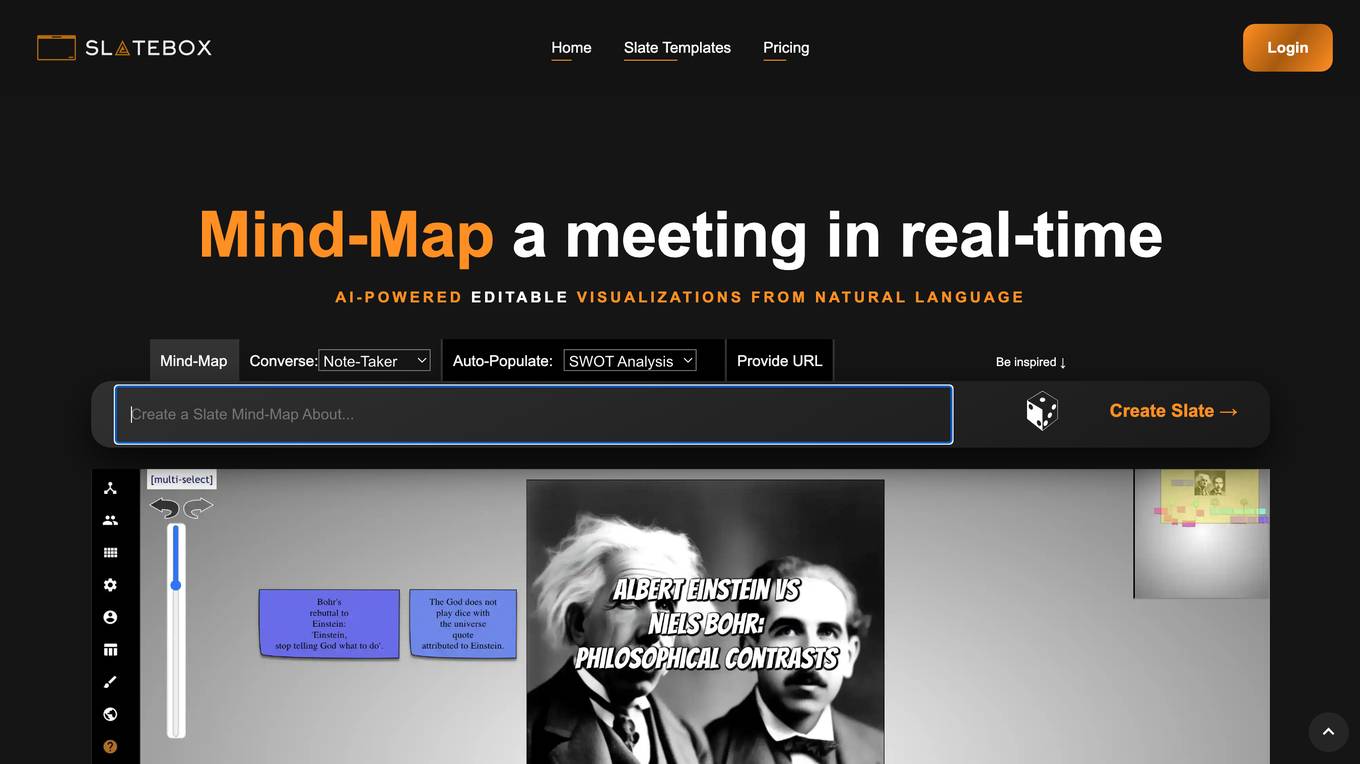
Slatebox
Slatebox is an AI-powered visualization platform that allows users to create editable visualizations from natural language. With Slatebox, users can create mind maps, flowcharts, diagrams, and more, simply by providing a text prompt or URL. Slatebox also offers a variety of templates and features to help users get started, including real-time collaboration, auto-population, and API integration.
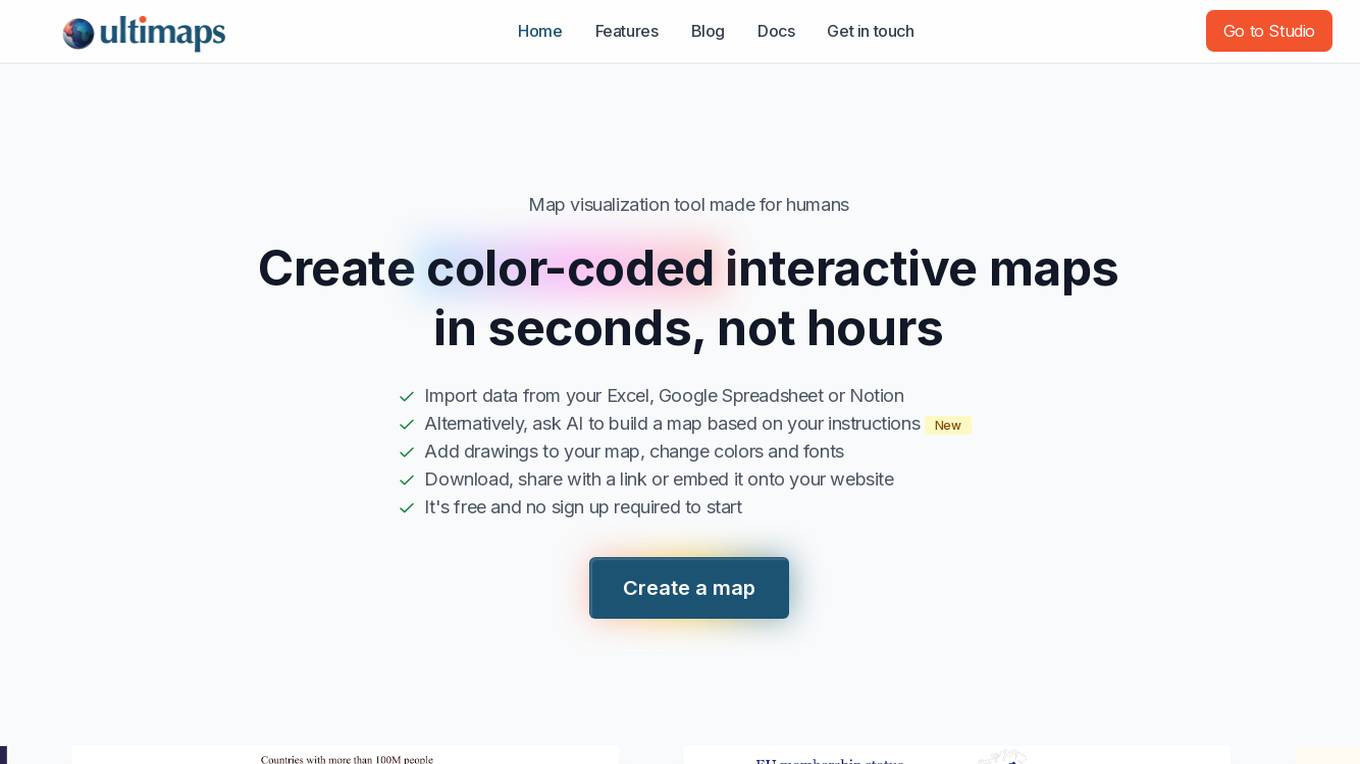
Ultimaps
Ultimaps is an AI-powered map visualization tool designed for humans to create color-coded interactive maps in seconds. Users can import data from Excel, Google Spreadsheet, or Notion, or instruct the AI to build a map based on their requirements. The tool allows users to add drawings, change colors and fonts, and easily download, share, or embed the maps. Ultimaps offers features like automatic color-coding based on imported data, customization options, auto-saving of visualizations, and the ability to create interactive maps without any coding. It is a user-friendly platform suitable for various mapping needs.
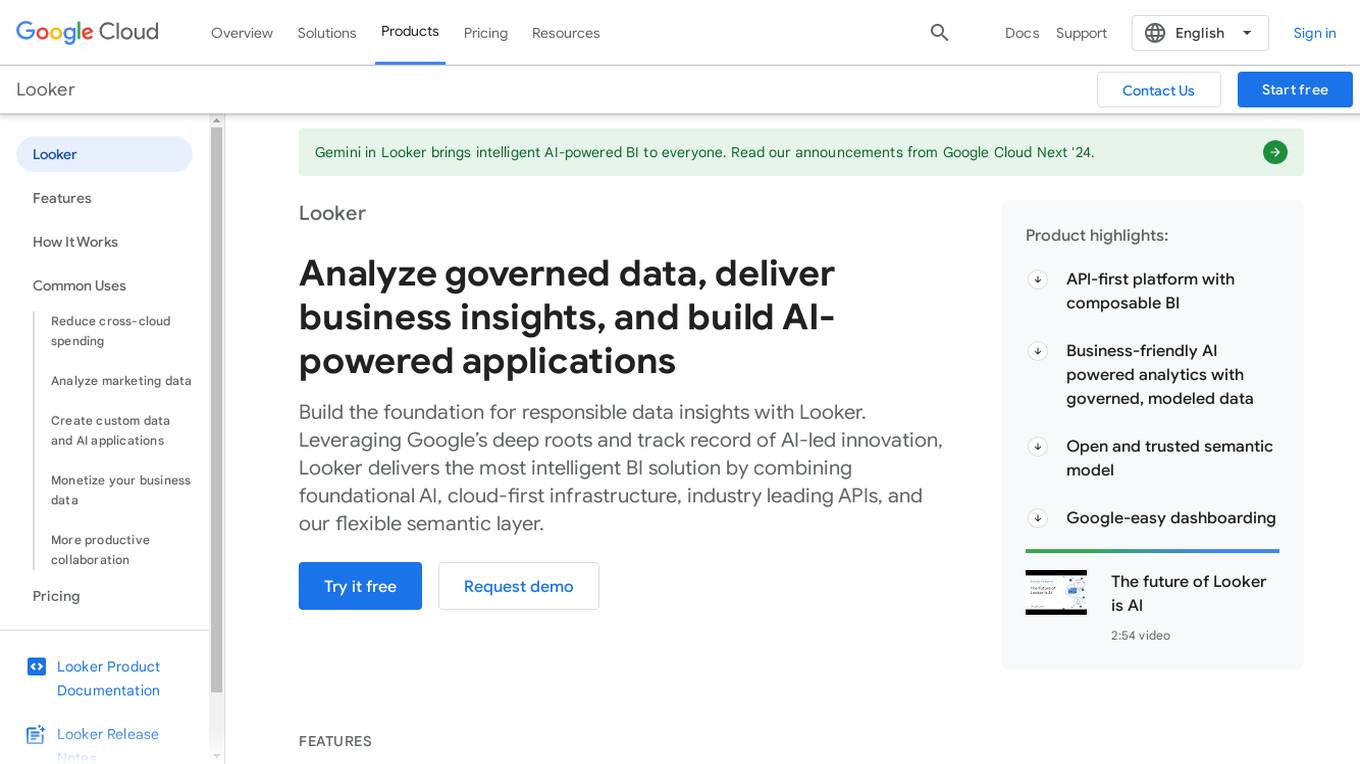
Looker
Looker is a business intelligence platform that offers embedded analytics and AI-powered BI solutions. Leveraging Google's AI-led innovation, Looker delivers intelligent BI by combining foundational AI, cloud-first infrastructure, industry-leading APIs, and a flexible semantic layer. It allows users to build custom data experiences, transform data into integrated experiences, and create deeply integrated dashboards. Looker also provides a universal semantic modeling layer for unified, trusted data sources and offers self-service analytics capabilities through Looker and Looker Studio. Additionally, Looker features Gemini, an AI-powered analytics assistant that accelerates analytical workflows and offers a collaborative and conversational user experience.
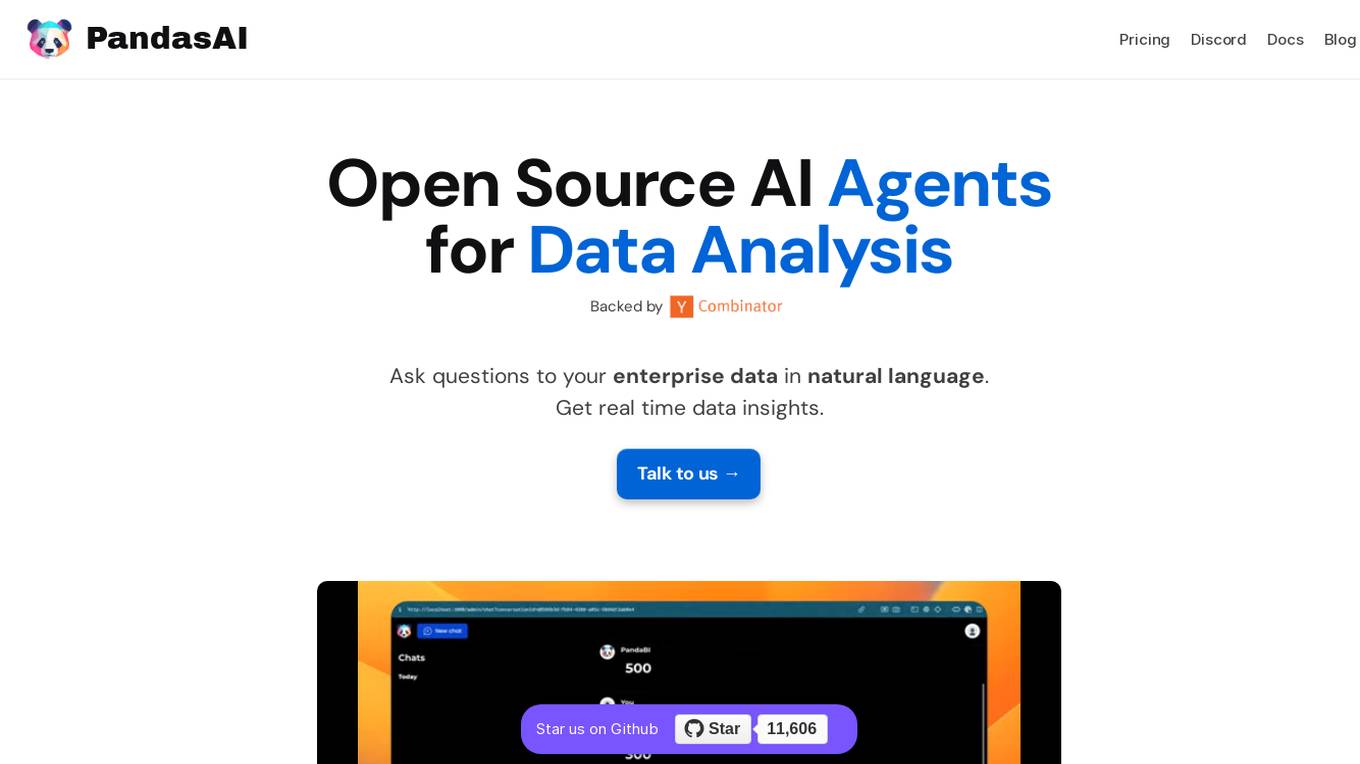
PandasAI
PandasAI is an open-source AI tool designed for conversational data analysis. It allows users to ask questions in natural language to their enterprise data and receive real-time data insights. The tool is integrated with various data sources and offers enhanced analytics, actionable insights, detailed reports, and visual data representation. PandasAI aims to democratize data analysis for better decision-making, offering enterprise solutions for stable and scalable internal data analysis. Users can also fine-tune models, ingest universal data, structure data automatically, augment datasets, extract data from websites, and forecast trends using AI.
Sonify
Sonify is a company that specializes in the intersection of audio, data, and emerging technologies. They design and develop audio-first products and data-driven solutions. Sonify's mission is to make data more accessible and understandable through the use of sound. They believe that sound is a powerful tool that can be used to communicate complex information in a way that is both engaging and informative.
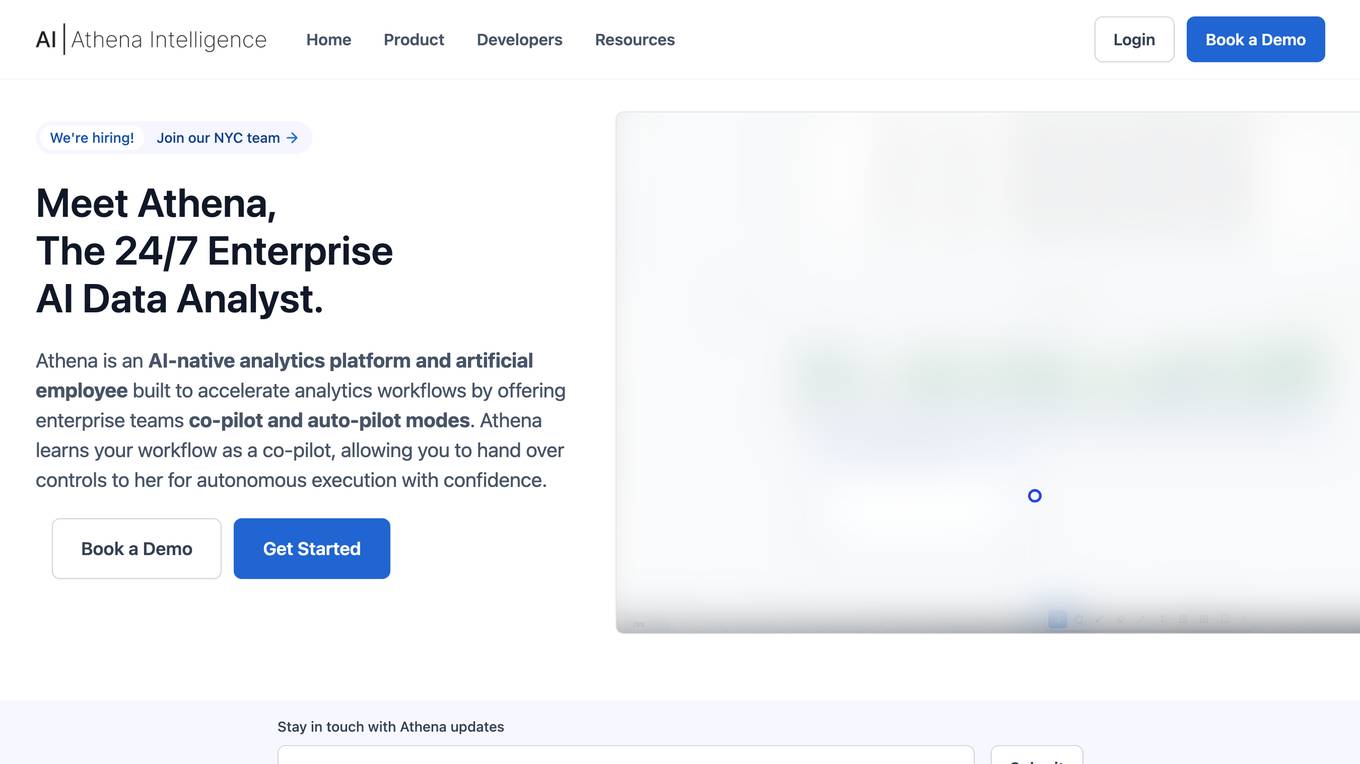
Athena Intelligence
Athena Intelligence is an AI-native analytics platform and artificial employee designed to accelerate analytics workflows by offering enterprise teams co-pilot and auto-pilot modes. Athena learns your workflow as a co-pilot, allowing you to hand over controls to her for autonomous execution with confidence. With Athena, everyone in your enterprise has access to a data analyst, and she doesn't take days off. Simple integration to your Enterprise Data Warehouse Chat with Athena to query data, generate visualizations, analyze enterprise data and codify workflows. Athena's AI learns from existing documentation, data and analyses, allowing teams to focus on creating new insights. Athena as a platform can be used collaboratively with co-workers or Athena, with over 100 users in the same report or whiteboard environment concurrently making edits. From simple queries and visualizations to complex industry specific workflows, Athena enables you with SQL and Python-based execution environments.
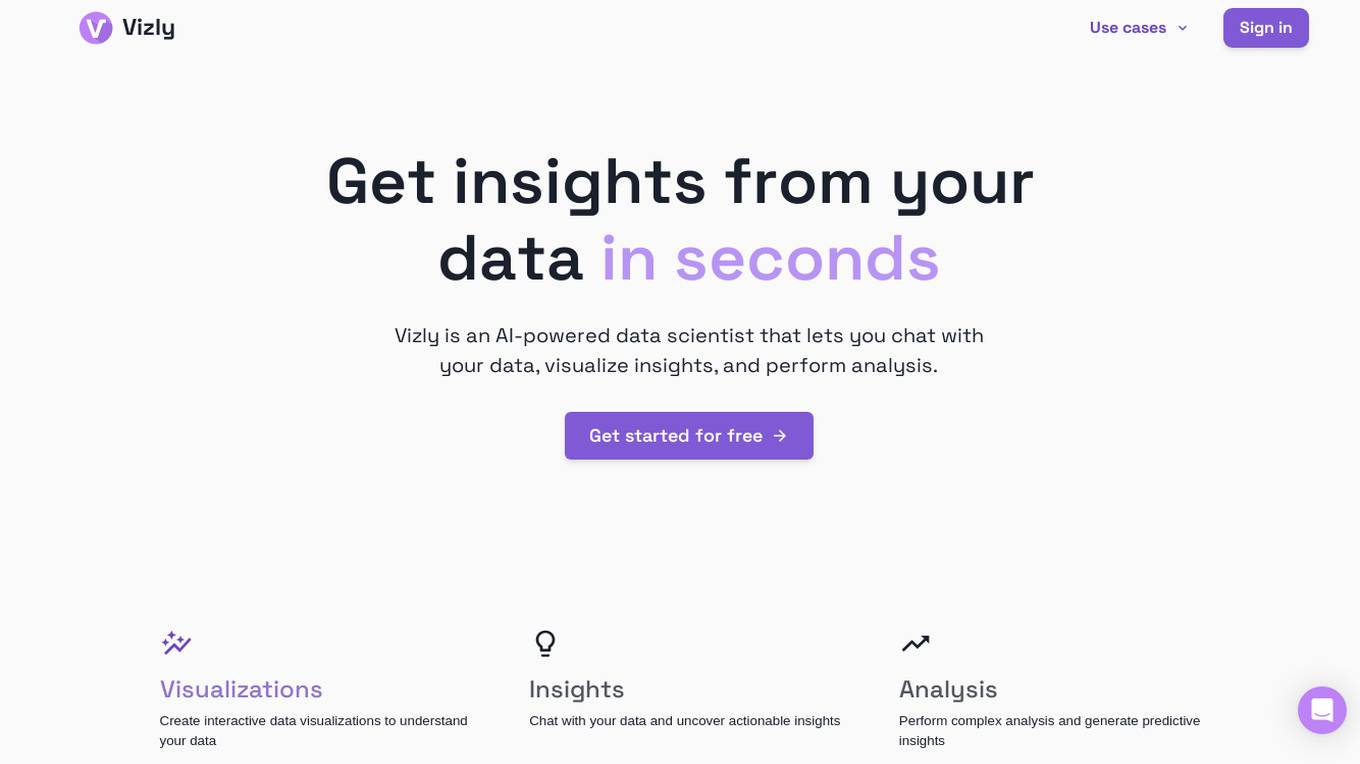
Vizly
Vizly is an AI-powered data analysis tool that empowers users to make the most of their data. It allows users to chat with their data, visualize insights, and perform complex analysis. Vizly supports various file formats like CSV, Excel, and JSON, making it versatile for different data sources. The tool is free to use for up to 10 messages per month and offers a student discount of 50%. Vizly is suitable for individuals, students, academics, and organizations looking to gain actionable insights from their data.
Baseboard
Baseboard is an AI tool designed to help users generate insights from their data quickly and efficiently. With Baseboard, users can create visually appealing charts and visualizations for their websites or publications with the assistance of an AI-powered designer. The tool aims to streamline the data visualization process and provide users with valuable insights to make informed decisions.
1 - Open Source AI Tools
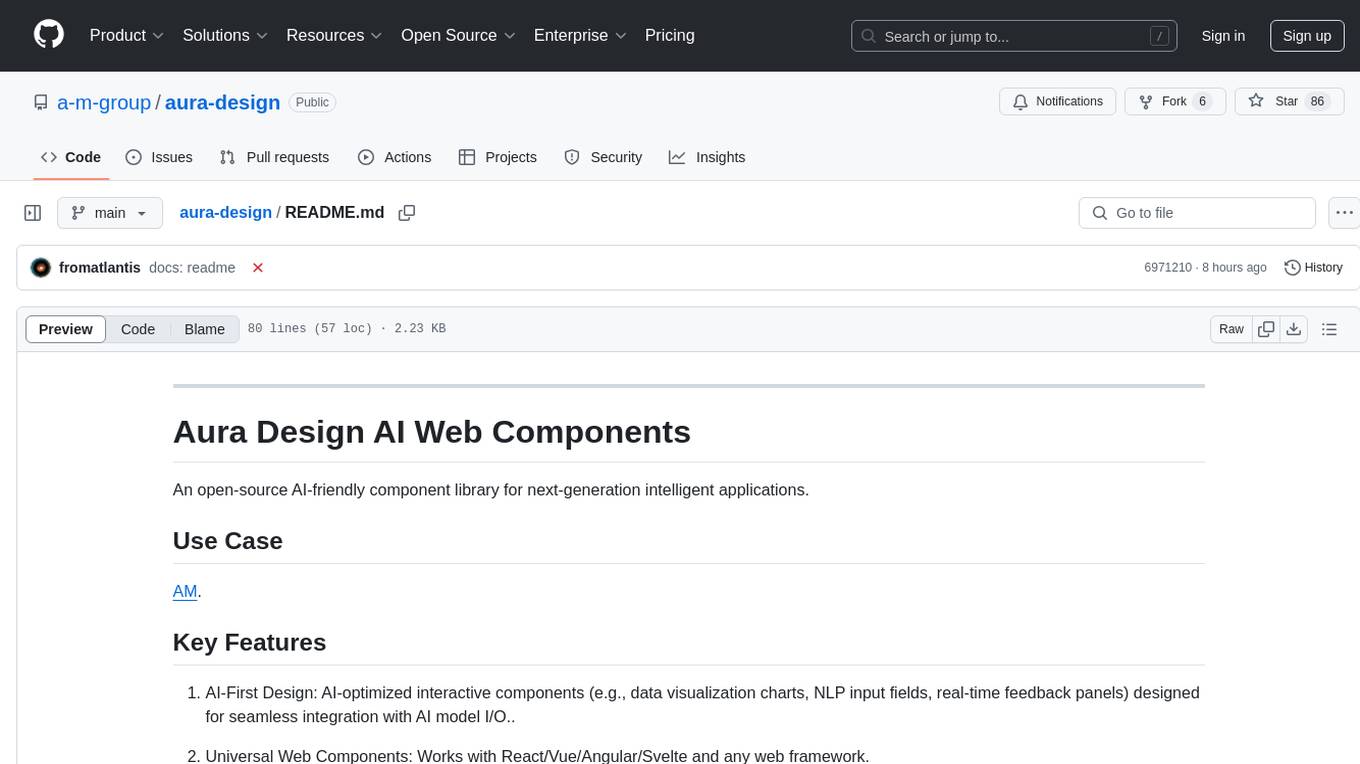
aura-design
Aura Design is an open-source AI-friendly component library for next-generation intelligent applications. It offers AI-optimized interactive components designed for seamless integration with AI model I/O. The library works with various web frameworks and allows easy customization to suit specific requirements. With a modern design and smart markdown renderer, Aura Design enhances the overall user experience.
20 - OpenAI Gpts

Projeto BRAPEL Digital
Faça perguntas, analise dados e crie gráficos da história dos jogos do clássico BRAPEL (Grêmio Esportivo Brasil e Esporte Clube Pelotas)
Streamlit Assistant
This GPT can read all Streamlit Documantation and helps you about Streamlit.
POWERBI_AI
“Data Deep Dive”: This is an expert AI tool for Excel and Power BI. Get expert help with DAX, Power Query, VBA, data models, and visualizations. Ideal for all levels: from basic functions to advanced analytics.
Data Analysis Report Creator
Creates full DOCX data analysis reports with integrated visualizations
Fitness Data Analyst
I analyze your workout data, focusing on brevity and clear visualizations
Diagramas: Muéstrame
Cree diagramas, visualizaciones de arquitectura, diagramas de flujo, mapas mentales, esquemas y más. Ideal para codificación, presentaciones y documentación de códigos. ¡Exporta y edita tu diagrama gratis!
Data Insight Guru
Concise stats, data analysis, and viz expert. Clear, brief, asks for clarifications.
Vicky Vega
Generates Vega-Lite JSON code for Power BI visuals from data and descriptions.
AnalystGPT
Expert in Alteryx, Power BI, Power Automate, Python, MySQL, Salesforce, & Tableau