Best AI tools for< Visualization Specialist >
Infographic
20 - AI tool Sites
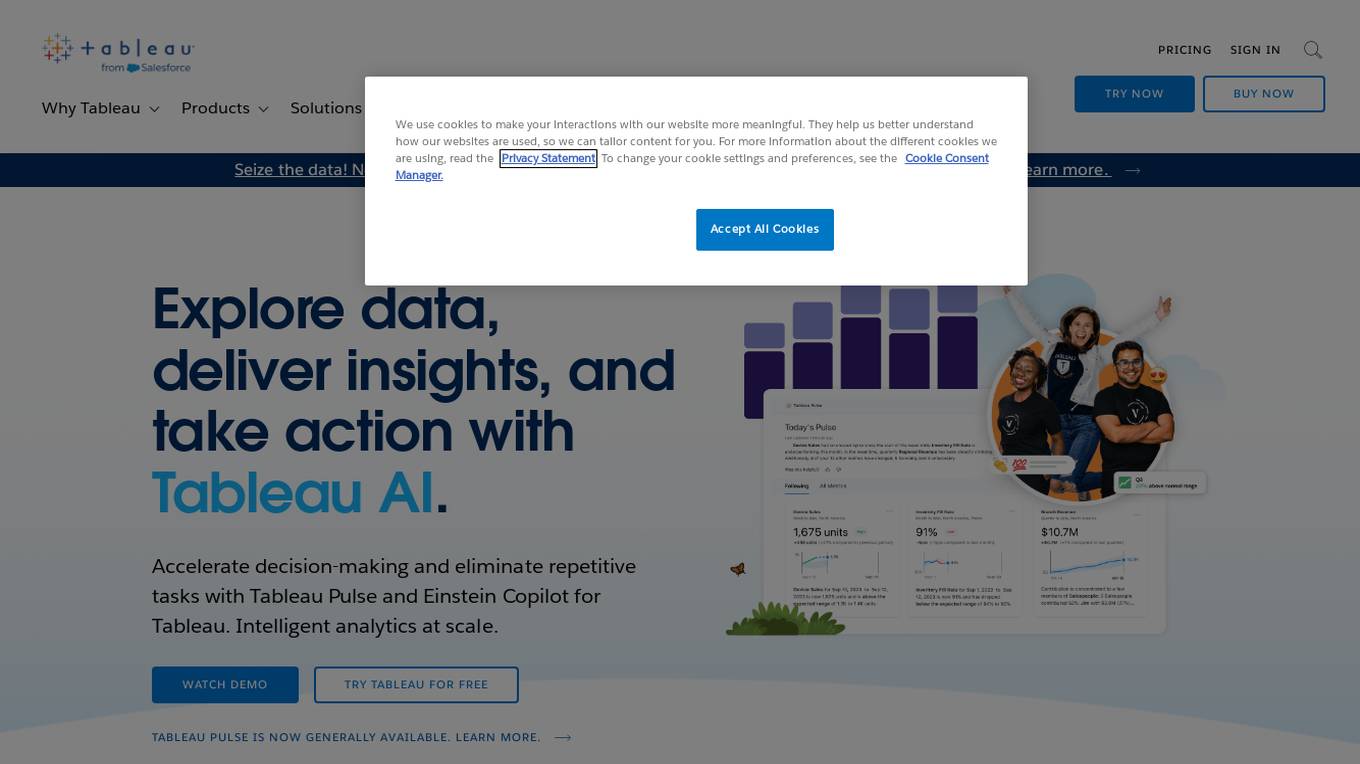
Tableau
Tableau is a visual analytics platform that helps people see, understand, and act on data. It is used by organizations of all sizes to solve problems, make better decisions, and improve operations. Tableau's platform is intuitive and easy to use, making it accessible to people of all skill levels. It also offers a wide range of features and capabilities, making it a powerful tool for data analysis and visualization.
Sertis
Sertis is a leading AI solutions provider in Thailand, offering a comprehensive suite of end-to-end solutions encompassing AI, data analytics, data science, and data engineering. Their services include data analytics, predictive analytics, machine learning, data visualization, AI and data science consulting, and big data engineering. Sertis's mission is to help businesses unlock the full potential of their data and drive growth and innovation across multiple industries.
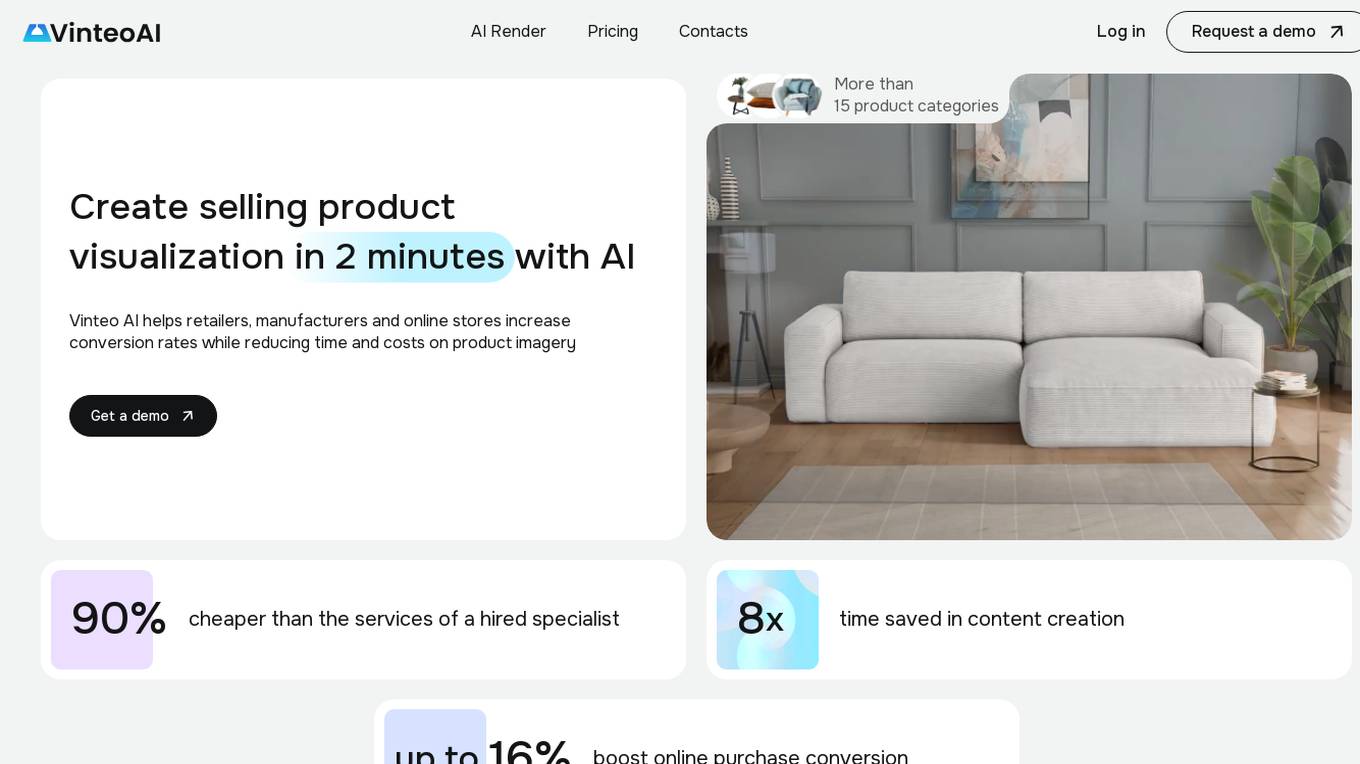
Vinteo AI Render
Vinteo AI Render is a furniture visualizer application that offers effortless design and instantaneous results. It helps retailers, manufacturers, and online stores create product visualizations in just 2 minutes. The AI-powered tool enables users to personalize product appearances, achieve professional-level results with AI editing, set the perfect scene for products, and finalize high-quality visuals for web and print use. Vinteo AI Render caters to various industries such as household item manufacturers, furniture retailers, flooring distributors, outdoor product vendors, interior designers, brands, and online stores, providing them with high-quality, photorealistic visuals to enhance their digital presence and drive sales.
Chat2CSV
The website offers an AI-powered tool for easy data visualization through natural language commands. Users can transform CSV data into various charts without the need for complex coding. The platform provides a wide range of chart types, smart AI support, and prioritizes data security and privacy. It simplifies data visualization tasks, making it intuitive and versatile for users to create visual insights effortlessly.
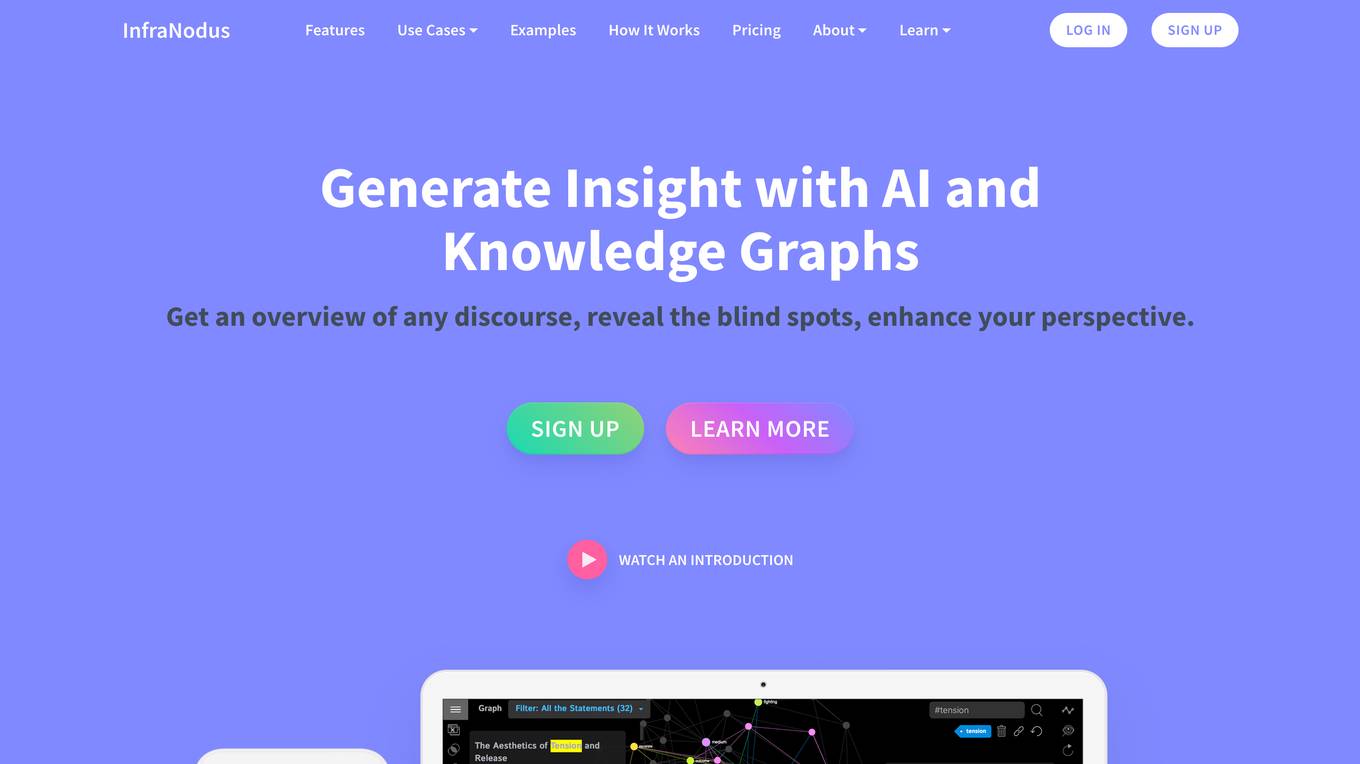
InfraNodus
InfraNodus is a text network visualization tool that helps users generate insights from any discourse by representing it as a network. It uses AI-powered algorithms to identify structural gaps in the text and suggest ways to bridge them. InfraNodus can be used for a variety of purposes, including research, creative writing, marketing, and SEO.
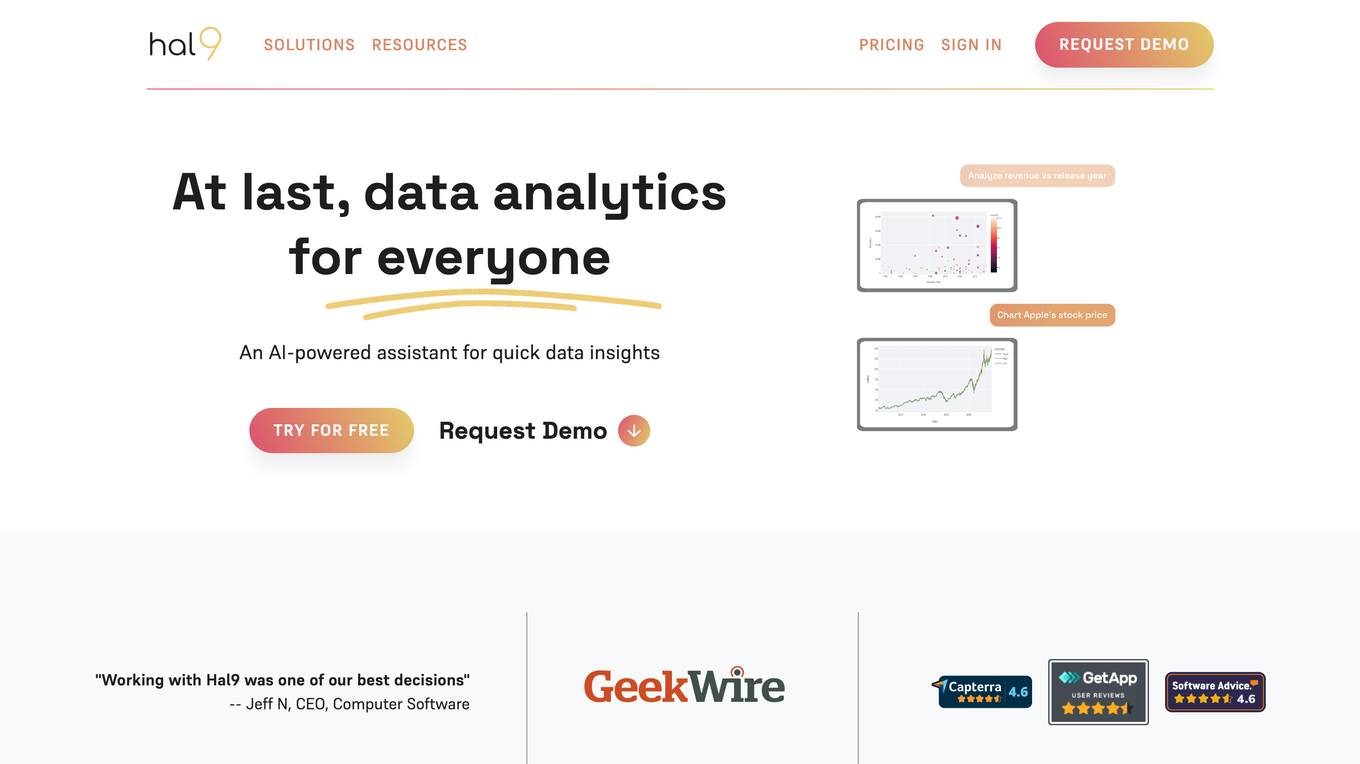
Hal9
Hal9 is an AI coworker creation platform that allows organizations, data teams, and developers to effortlessly build custom AI coworkers with any level of complexity. It provides a secure and customizable model-agnostic AI coworker solution that accelerates the development of AI applications by saving significant engineering time. Hal9 enables users to leverage the best generative AI models, connect their data securely, and start building enterprise-ready AI applications with the necessary engineering components. The platform aims to empower users to leverage AI technology effectively and efficiently in their projects.
ExcelDashboard Ai
ExcelDashboard Ai is an AI tool that allows users to instantly convert Excel data into interactive dashboards. The tool simplifies the process of creating visually appealing and insightful dashboards without the need for complex coding or design skills. Users can easily upload their Excel files, customize the dashboard layout, and visualize data in a user-friendly format. ExcelDashboard Ai streamlines the dashboard creation process, saving time and effort for individuals and businesses looking to present data in a more engaging way.
Vizly
Vizly is an AI-powered data analysis tool that empowers users to make the most of their data. It allows users to chat with their data, visualize insights, and perform complex analysis. Vizly supports various file formats like CSV, Excel, and JSON, making it versatile for different data sources. The tool is free to use for up to 10 messages per month and offers a student discount of 50%. Vizly is suitable for individuals, students, academics, and organizations looking to gain actionable insights from their data.
Breadcrumb.ai
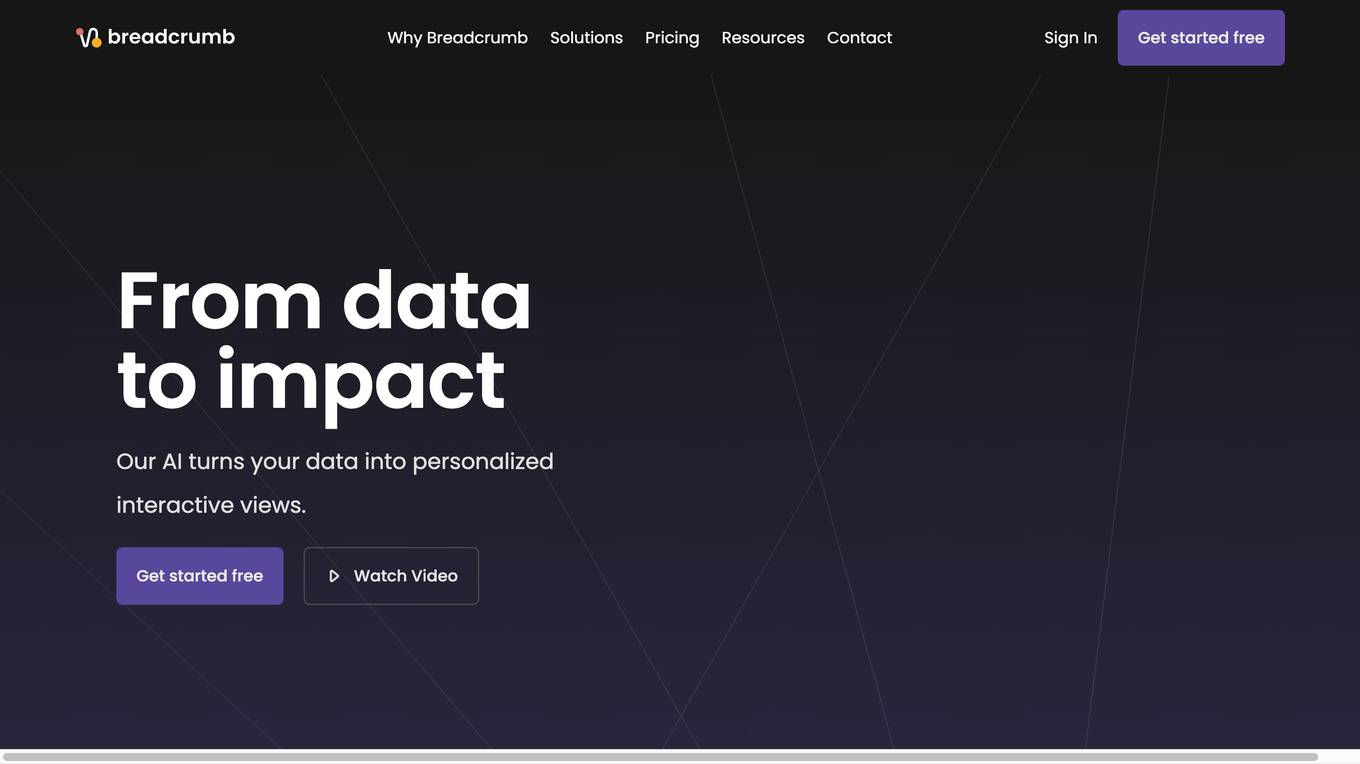
Breadcrumb.ai is an AI data analytics platform that enables users to combine, analyze, and chat with their files using AI data analytic agents. The platform is designed to be intuitive, eliminating the need for coding or data expertise. Breadcrumb's AI agents integrate and clean data, allowing users to ask questions in plain language and generate dashboards effortlessly. The tool provides a visual analytic canvas for exploring data, facilitating communication and collaboration across teams in real-time. With Breadcrumb, users can streamline operations, accelerate sales, and drive marketing decisions with evidence-based insights.
Supple.ai
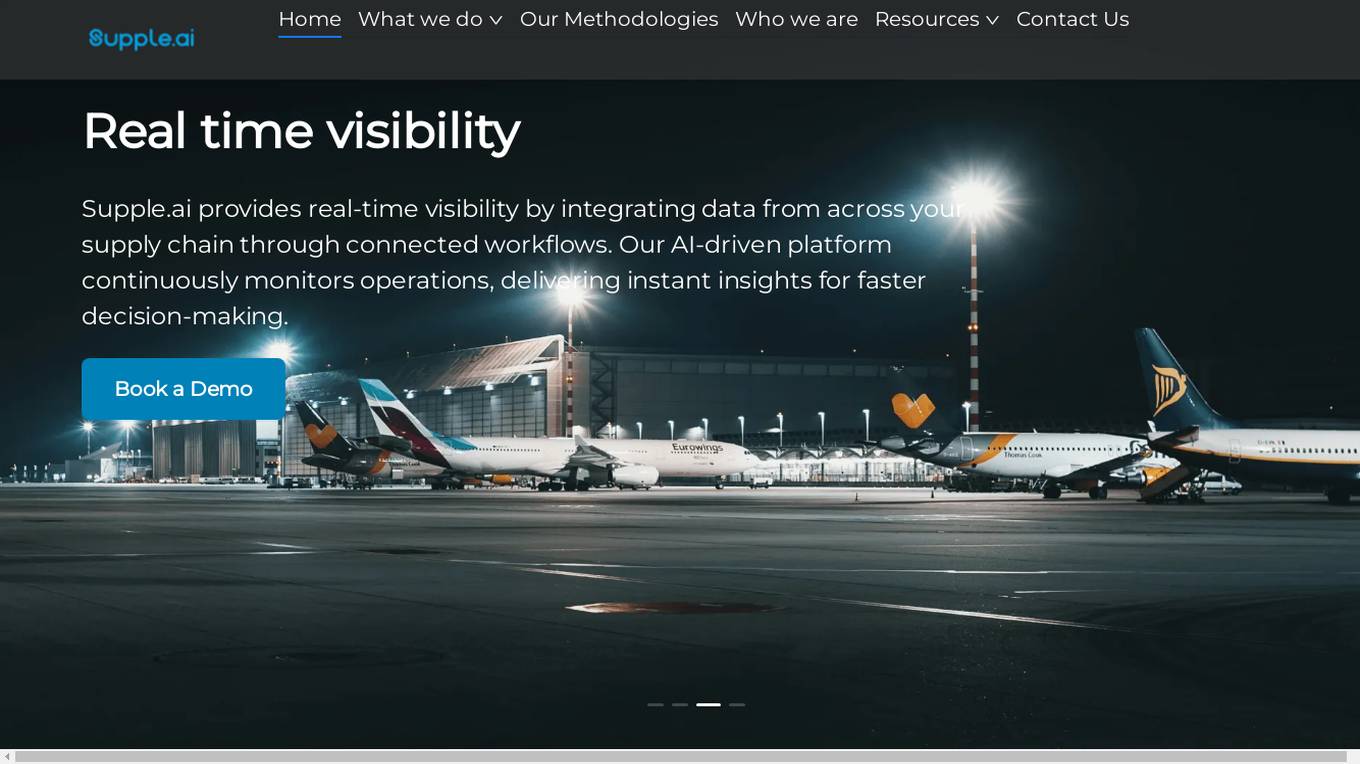
Supple.ai is an AI-powered content generation tool that helps users create high-quality written content quickly and efficiently. By leveraging advanced natural language processing algorithms, Supple.ai can generate articles, blog posts, product descriptions, and more in a matter of minutes. The tool is designed to assist content creators, marketers, and businesses in streamlining their content creation process and improving productivity.
Story-boards.ai
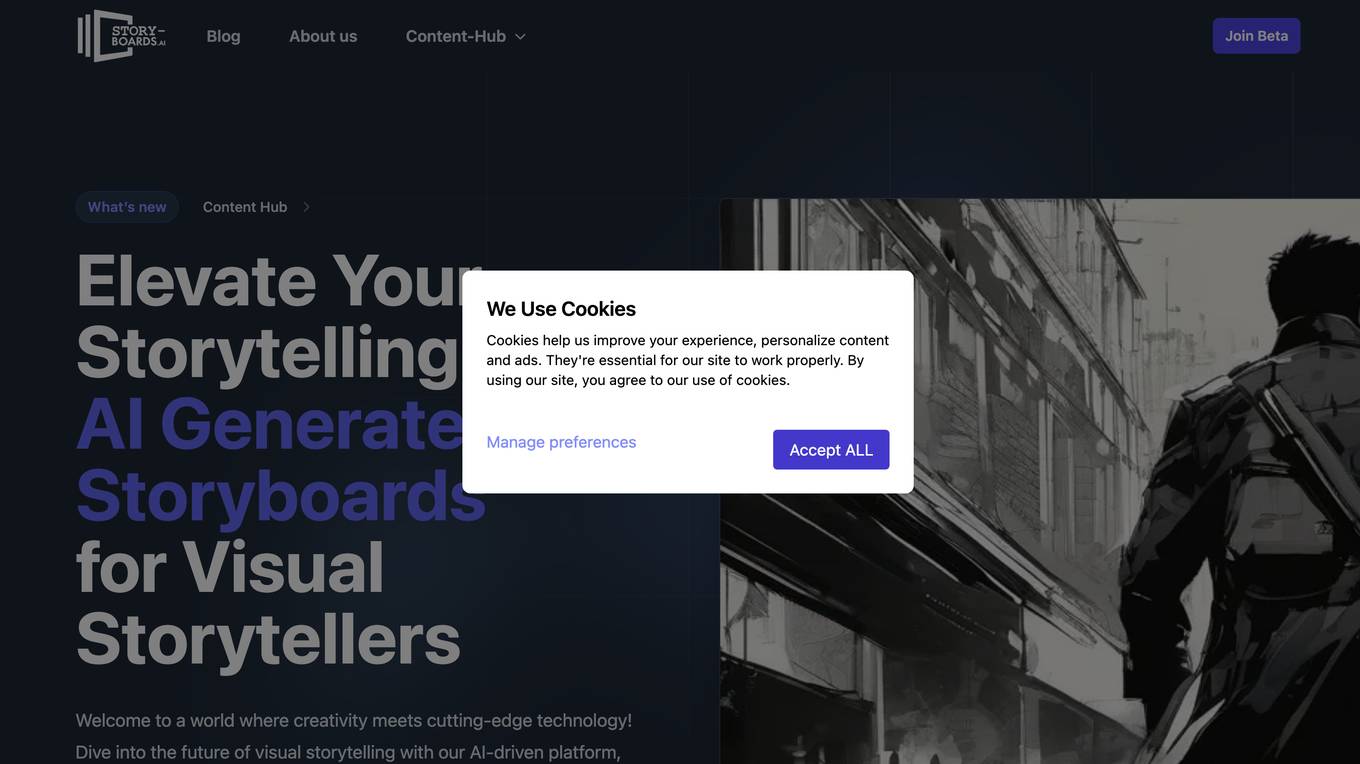
Story-boards.ai is an AI-driven platform that revolutionizes storyboarding for visual storytellers, including filmmakers, ad creators, and graphic novelists. It empowers users to transform written scripts into dynamic visual storyboards, maintain character consistency, and speed up the pre-production process with AI-enhanced storyboarding. The platform offers tailored storyboards, custom camera angles, character consistency, and a streamlined workflow to elevate narratives and unlock new realms of possibility in visual storytelling.
Odysight.ai
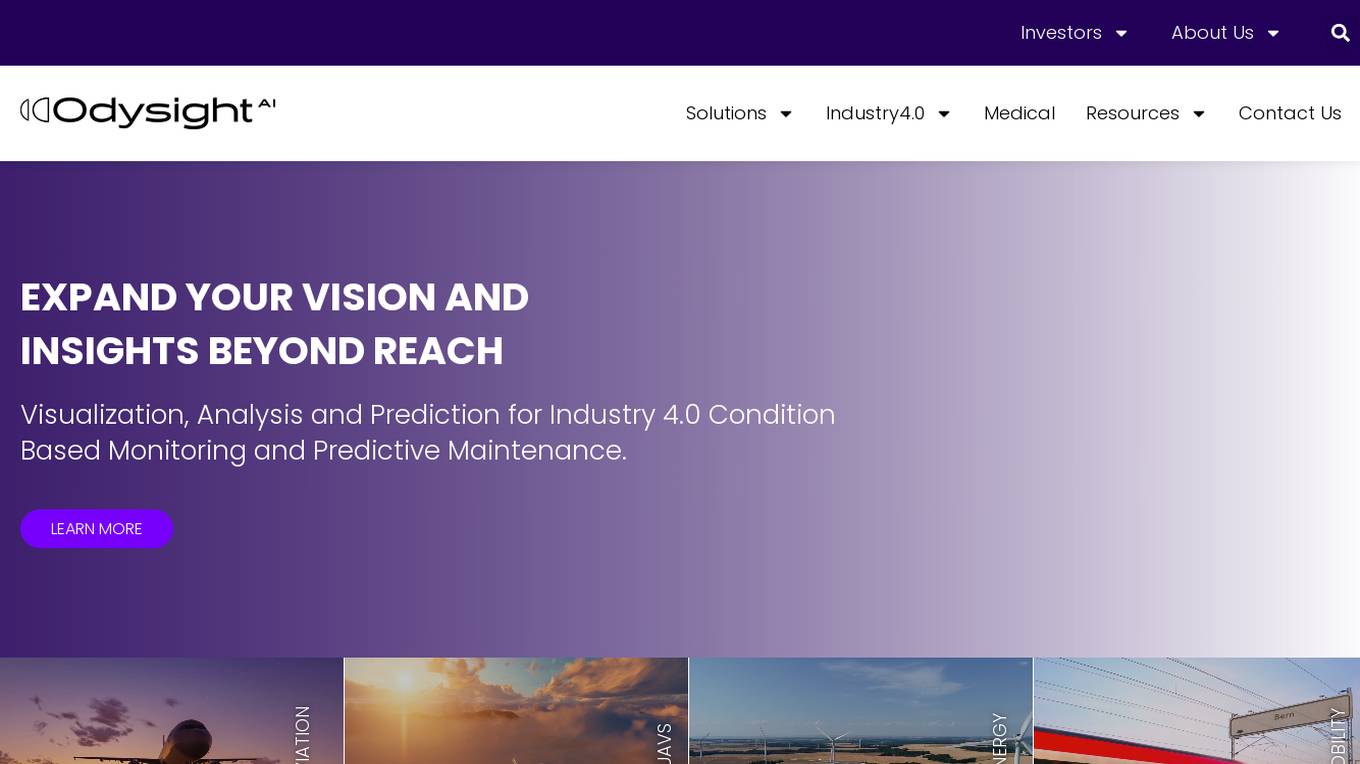
Odysight.ai is a pioneering AI platform specializing in Predictive Maintenance and Condition Based Monitoring for Industry 4.0 markets. The platform utilizes Camera-as-a-Sensor™ technology and AI models to provide real-time insights in hard-to-reach locations and harsh environments across industries such as aviation, energy, mobility, and transportation.
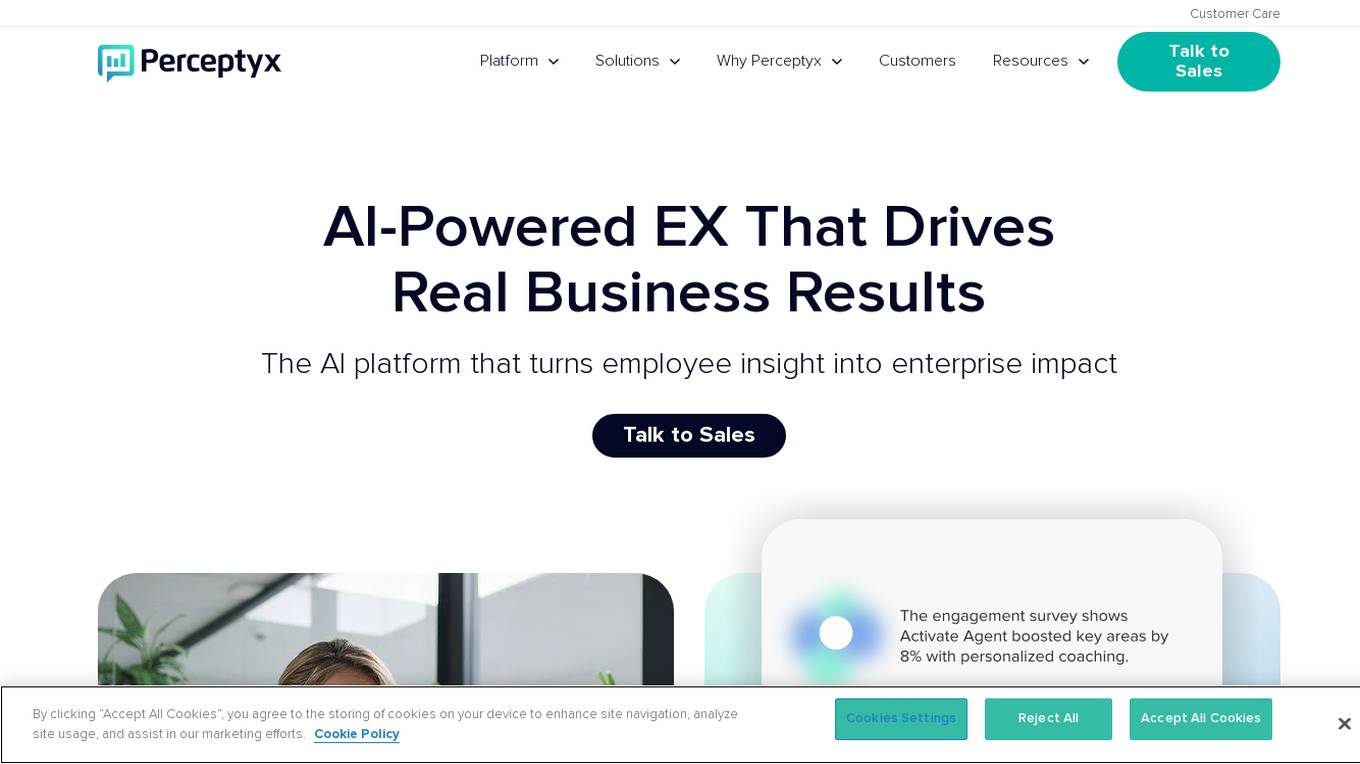
Perceptyx
Perceptyx is an AI-powered platform that specializes in employee surveys, consultation, and people analytics. It offers a comprehensive suite of tools to help organizations gather real-time insights, drive behavior change, and improve employee experience. With a focus on continuous listening and AI-driven solutions, Perceptyx aims to transform employee feedback into actionable strategies that lead to measurable impact and organizational success.
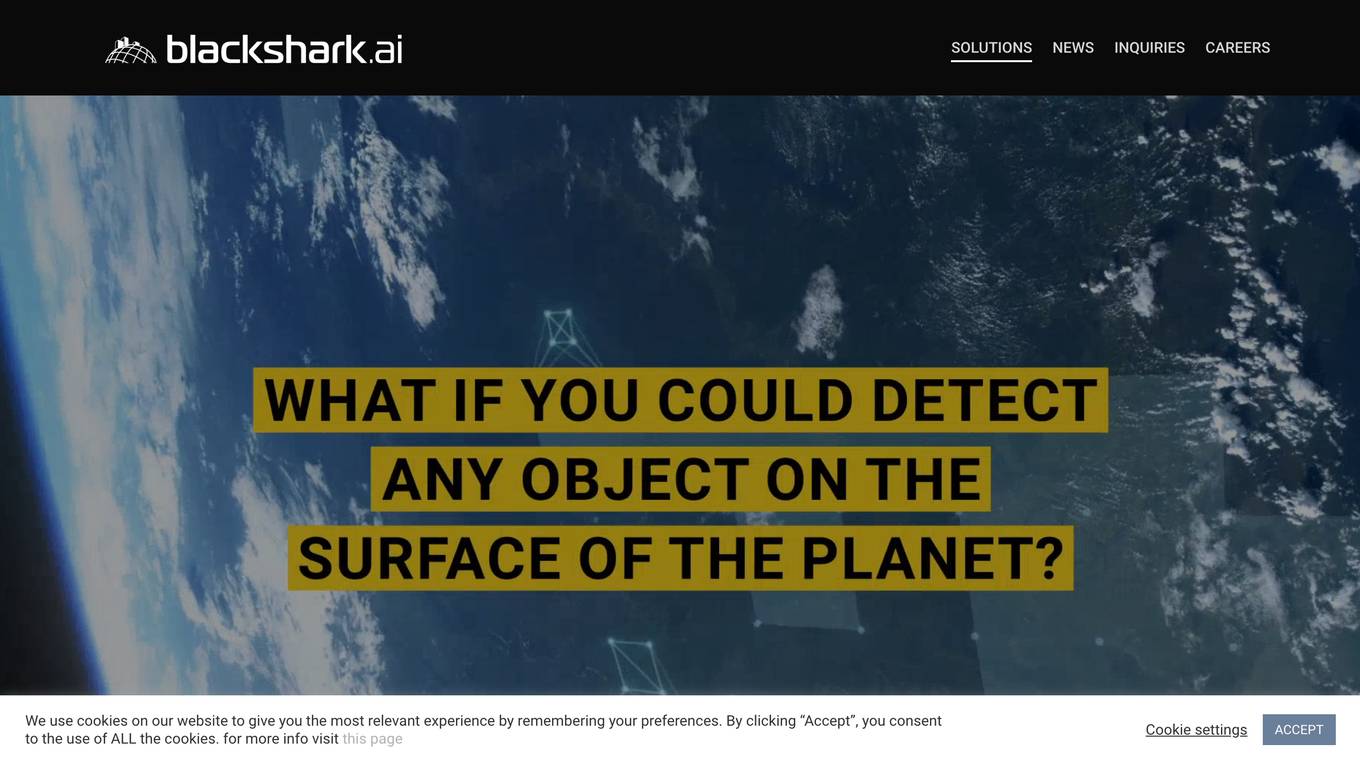
Blackshark.ai
Blackshark.ai is an AI-based platform that generates real-time accurate semantic photorealistic 3D digital twin of the entire planet. The platform extracts insights about the planet's infrastructure from satellite and aerial imagery via machine learning at a global scale. It enriches missing attributes using AI to provide a photorealistic, geo-typical, or asset-specific digital twin. The results can be used for visualization, simulation, mapping, mixed reality environments, and other enterprise solutions. The platform offers end-to-end geospatial solutions, including globe data input sources, no-code data labeling, geointelligence at scale, 3D semantic map, and synthetic environments.
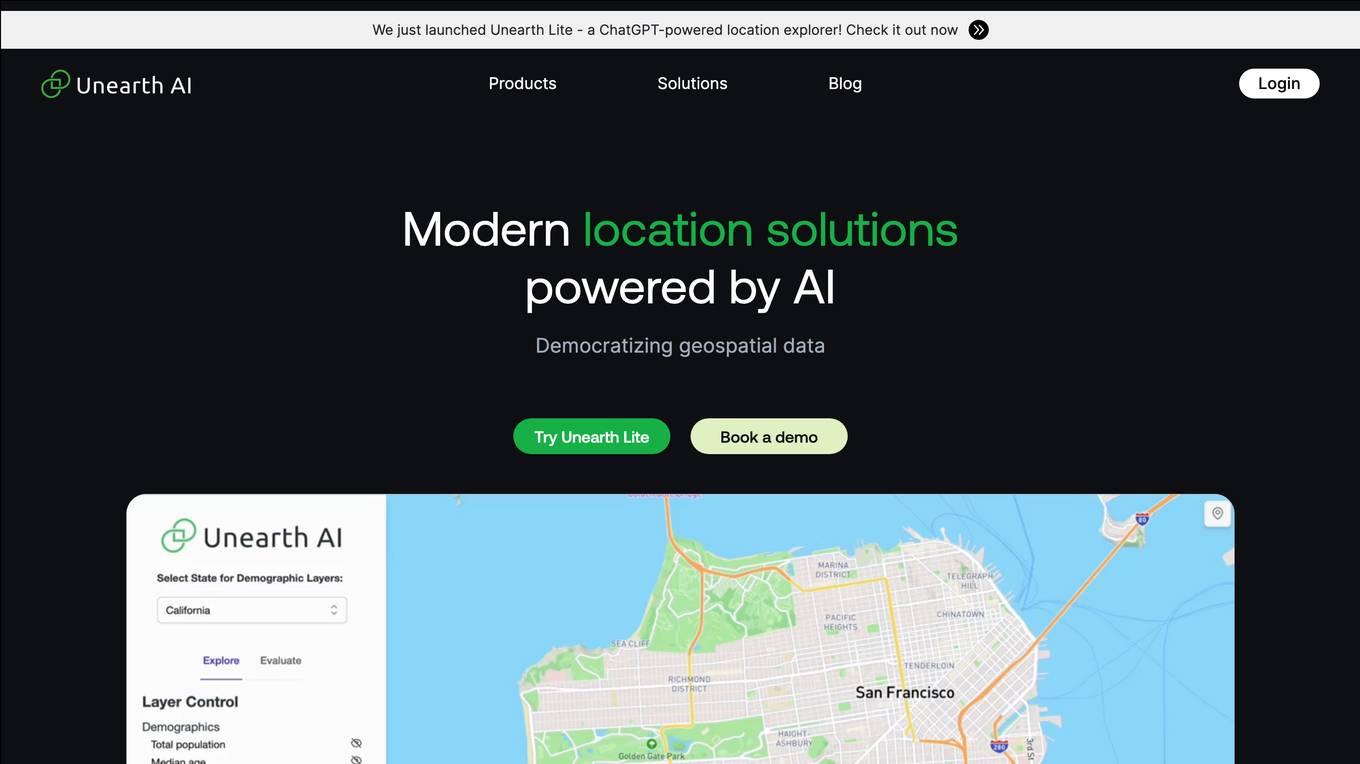
Unearth AI
Unearth AI is a platform offering geospatial data and location solutions. It provides various products like Unearth Lite, Unearth Insights, and Unearth Platform to cater to different needs. Unearth Lite is a ChatGPT-powered location explorer that offers a simple dashboard to explore locations worldwide. The platform aims to democratize geospatial data and is trusted by fast-growing businesses. With modern location solutions powered by AI, Unearth AI is revolutionizing the way businesses interact with and analyze location-based data.
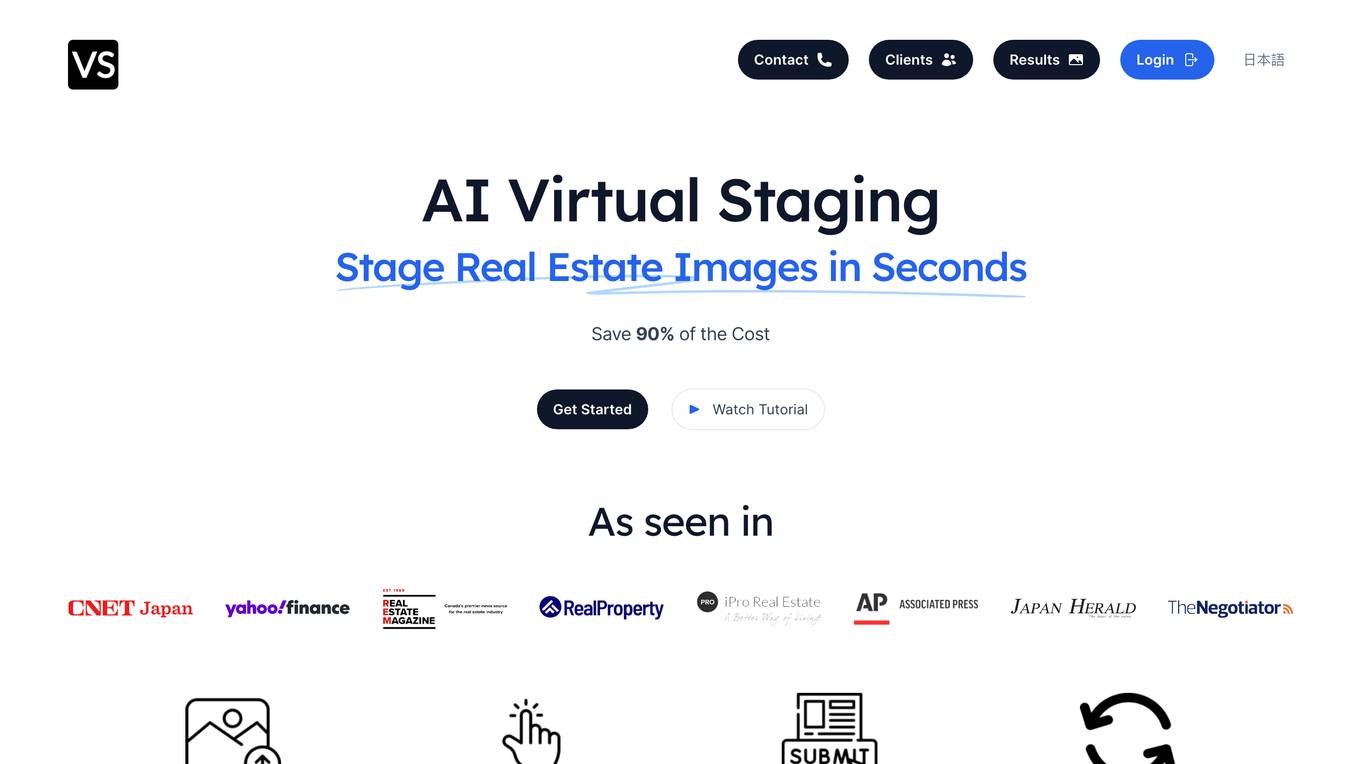
VirtualStaging.art
VirtualStaging.art is an AI-powered virtual staging tool that allows users to stage real estate images in seconds, saving up to 90% of the cost compared to traditional methods. The platform offers a fast, accurate, and cost-effective solution for real estate professionals, photographers, agents, and property managers to enhance their property listings with virtual staging. With features like free re-rendering, support for all room types and styles, 30-second turnaround time, and flexible pricing options, VirtualStaging.art revolutionizes the way properties are presented to potential buyers.
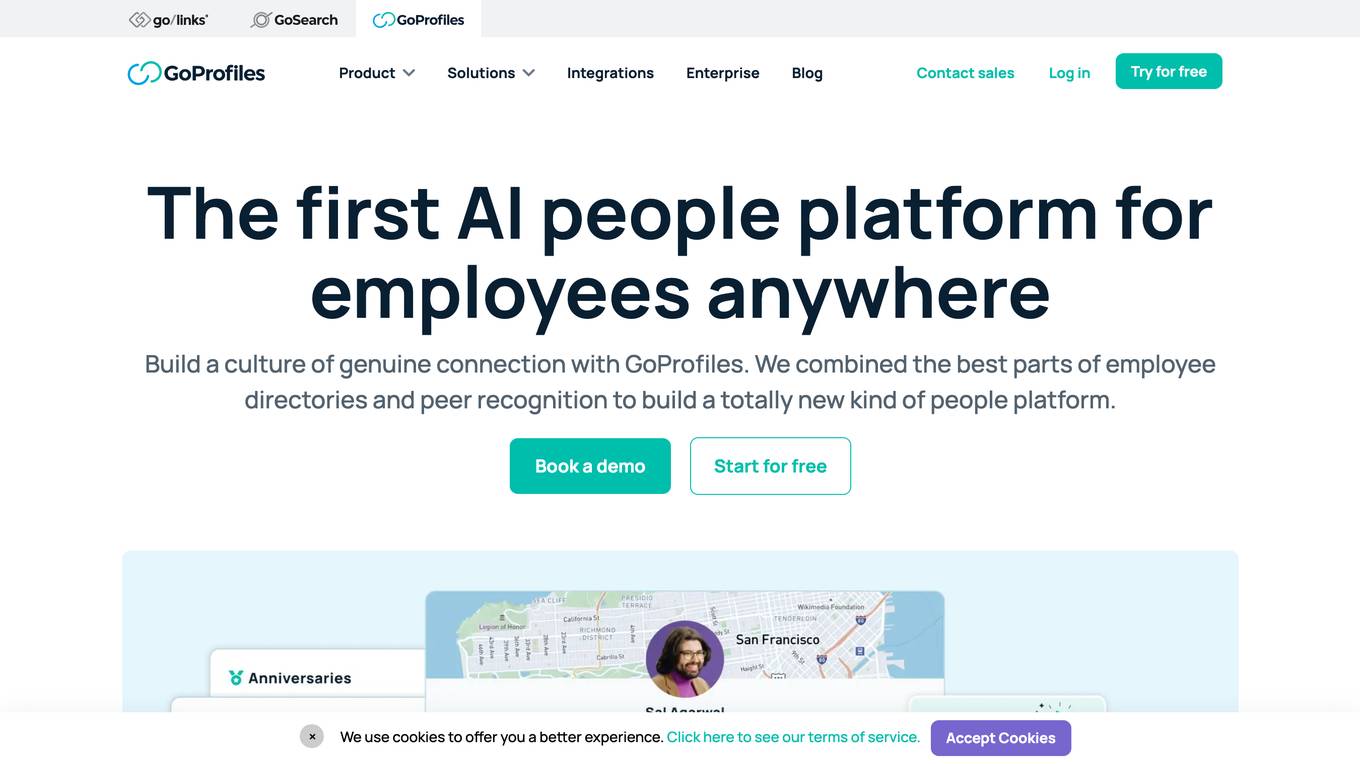
GoProfiles
GoProfiles is an AI People Platform designed for employee engagement and recognition. It offers features such as employee profiles, peer recognition, rewards, org chart visualization, dynamic people data search, and an AI assistant for company questions and connections. The platform aims to foster a connected and engaged culture within organizations by providing tools for meaningful coworker interactions and employee insights.
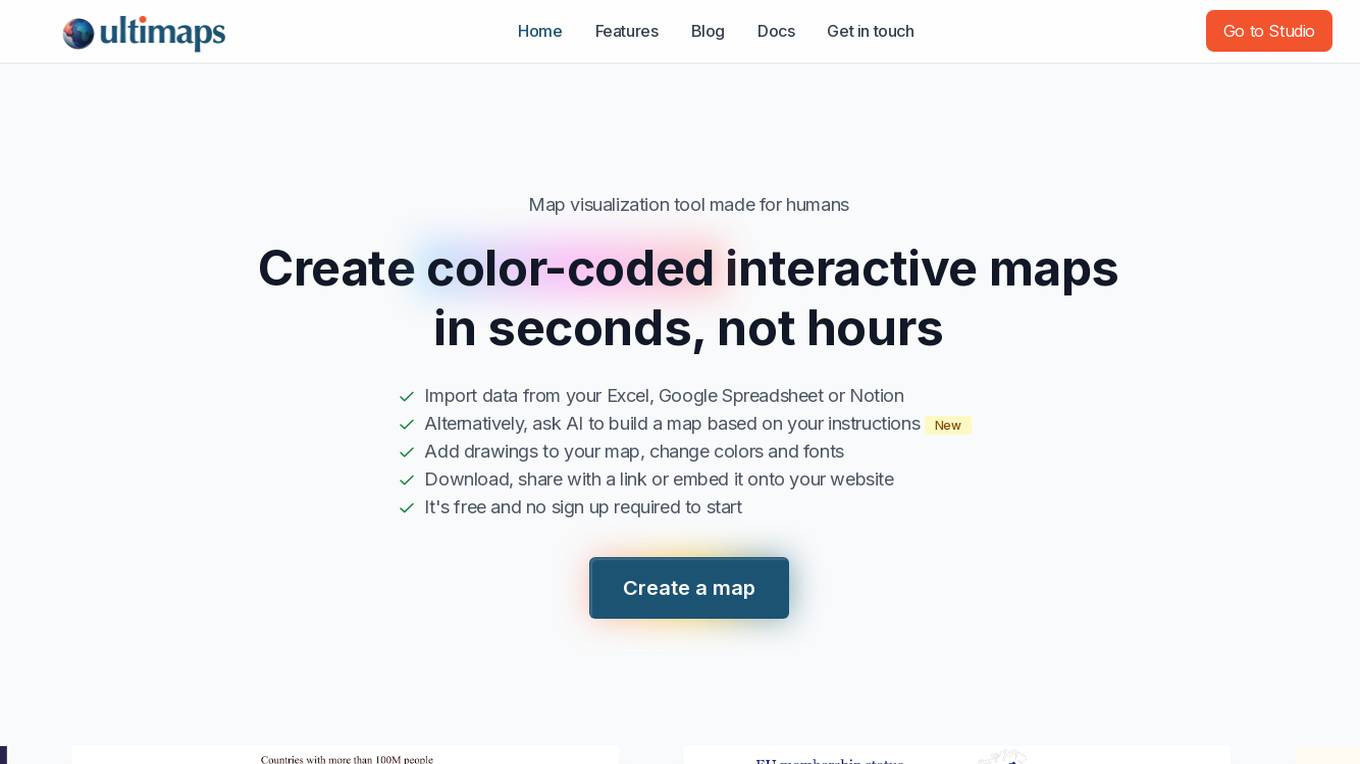
Ultimaps
Ultimaps is an AI-powered map visualization tool designed for humans to create color-coded interactive maps in seconds. Users can import data from Excel, Google Spreadsheet, or Notion, or instruct the AI to build a map based on their requirements. The tool allows users to add drawings, change colors and fonts, and easily download, share, or embed the maps. Ultimaps offers features like automatic color-coding based on imported data, customization options, auto-saving of visualizations, and the ability to create interactive maps without any coding. It is a user-friendly platform suitable for various mapping needs.
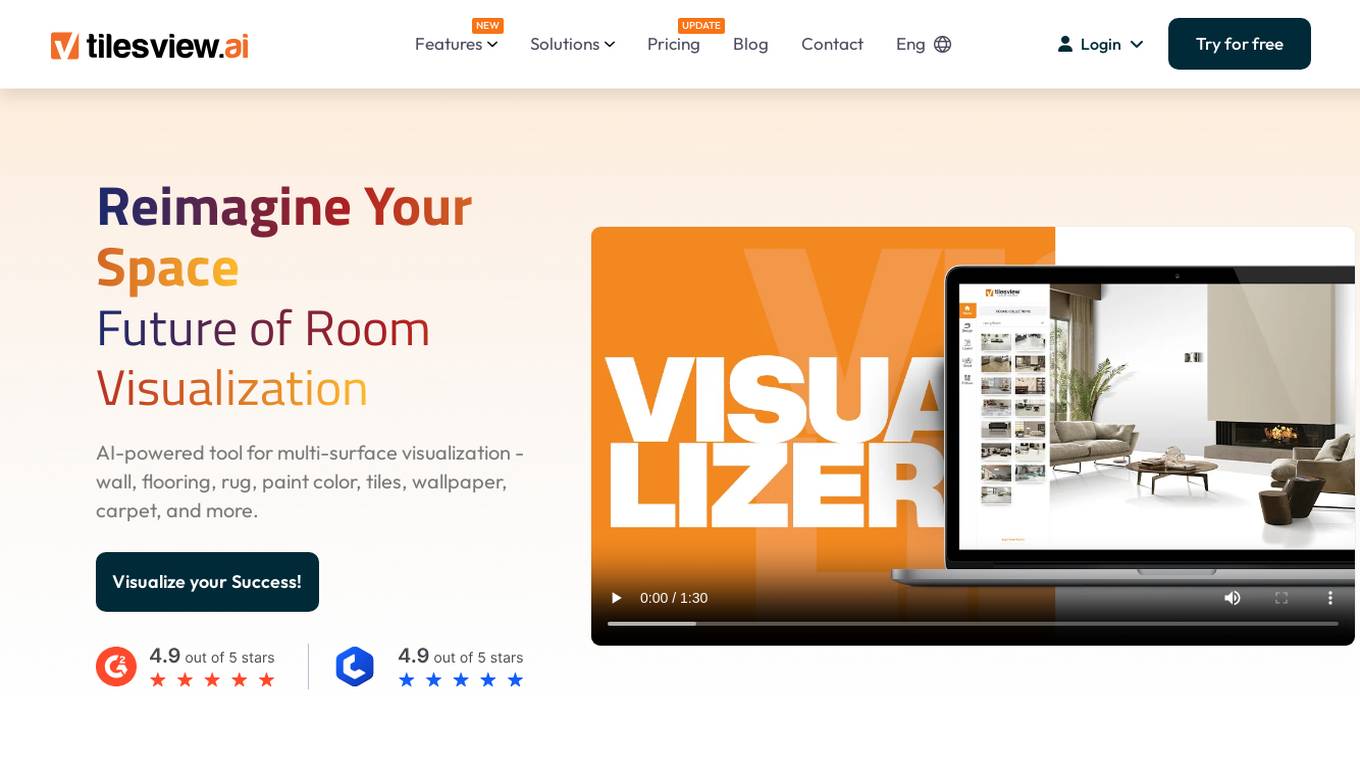
Tilesview
Tilesview is a cutting-edge 3D room visualizer and tile visualizer application powered by advanced AI technology. It allows users to visualize walls, floors, rugs, paint colors, tiles, wallpapers, and carpets in a virtual space with precision. The tool revolutionizes the way businesses in the flooring and wall covering industry operate, enabling faster decision-making, increased customer engagement, and higher conversion rates. With features like core products visualizer, 360 panorama view, generating catalogs, and website integration, Tilesview offers a comprehensive solution for manufacturers, distributors, retailers, and e-commerce platforms. The application caters to various roles such as importers/exporters, tiles designers, digital media marketers, and sales professionals, empowering them with tools to enhance visualization, marketing efforts, and sales conversions.
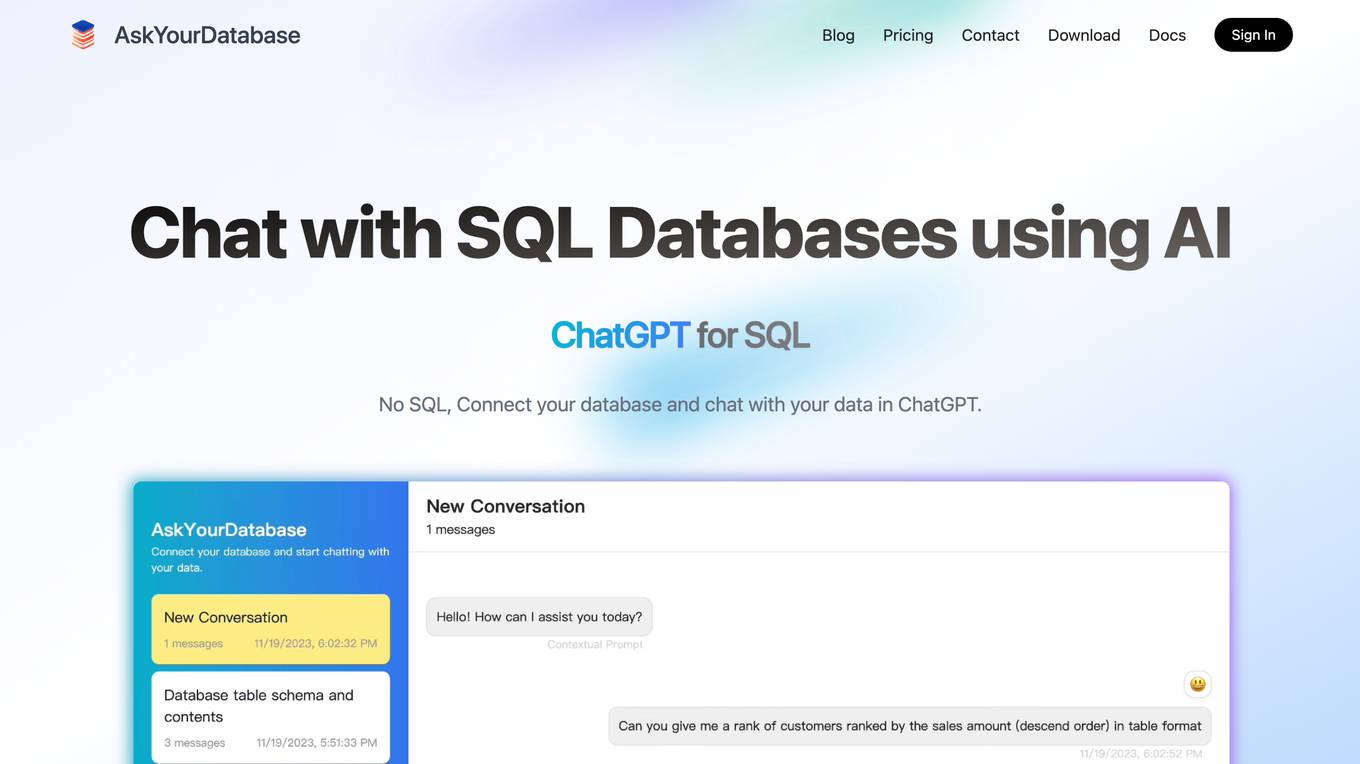
AskYourDatabase
AskYourDatabase is an AI-powered SQL chatbot and generator that allows users to interact with their databases using natural language queries. It offers features such as query generation, data visualization, business intelligence, and works with various databases like PostgreSQL, MySQL, and Oracle. The tool provides high accuracy, self-learning capabilities, fine-grained access control, embeddable widget options, and 24/7 customer support. It is trusted by over 100 companies worldwide and has received positive feedback for its efficiency and insights. AskYourDatabase is suitable for both technical and non-technical users who need to analyze data without complex coding.
2 - Open Source Tools
VMind
VMind is an open-source solution for intelligent visualization, providing an intelligent chart component based on LLM by VisActor. It allows users to create chart narrative works with natural language interaction, edit charts through dialogue, and export narratives as videos or GIFs. The tool is easy to use, scalable, supports various chart types, and offers one-click export functionality. Users can customize chart styles, specify themes, and aggregate data using LLM models. VMind aims to enhance efficiency in creating data visualization works through dialogue-based editing and natural language interaction.
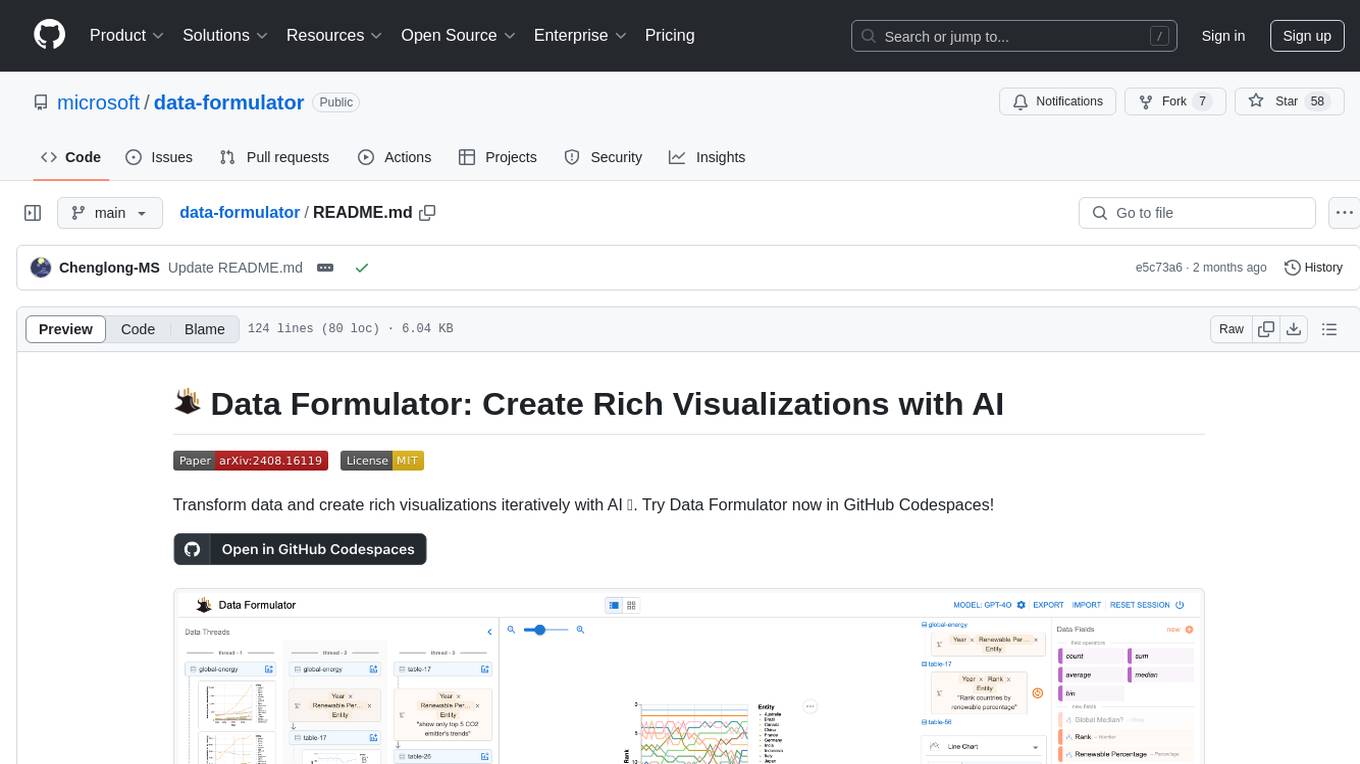
data-formulator
Data Formulator is an AI-powered tool developed by Microsoft Research to help data analysts create rich visualizations iteratively. It combines user interface interactions with natural language inputs to simplify the process of describing chart designs while delegating data transformation to AI. Users can utilize features like blended UI and NL inputs, data threads for history navigation, and code inspection to create impressive visualizations. The tool supports local installation for customization and Codespaces for quick setup. Developers can build new data analysis tools on top of Data Formulator, and research papers are available for further reading.
20 - OpenAI Gpts
PowerBI GPT
A PowerBI Expert assisting with debugging, dashboard ideas, and PowerBI service guidance.
Vicky Vega
Generates Vega-Lite JSON code for Power BI visuals from data and descriptions.
Addy™ for Power BI Data Analytics
Advisor for Power BI Analytics, aiding in solution planning, design, and construction. Ask Hi or type /help for how to get started.
ReDev You v00400
Specialist in belief transformation using advanced NLP and visualization, now more powerful with a two-component structure.

Chicken Chicken Chicken Research
Scintillating chicken-related conversation and visualization as an homage to the greatest chicken chicken chicken PDF of all time.
Semantic Content Explorer For SEO
Analyse & visualise semantic networks entities and attributes for content creation.
VisionCraft HTML Design
VisionCraft HTML Design specializes in transforming rough sketches into stunning, functional HTML designs, utilizing DALL-E visualizations to bring product managers' visions to life. Emphasizing user needs and design innovation, this process ensures perfect alignment from concept to code.
