Best AI tools for< Visualize Financial Data >
20 - AI tool Sites
ChartPixel
ChartPixel is an AI-assisted data analysis platform that empowers users to effortlessly generate charts, insights, and actionable statistics in just 30 seconds. The platform is designed to demystify data and analysis, making it accessible to users of all skill levels. ChartPixel combines the power of AI with domain expertise to provide secure and reliable output, ensuring trustworthy results without compromising data privacy. With user-friendly features and educational tools, ChartPixel helps users clean, wrangle, visualize, and present data with ease, catering to both beginners and professionals.
Avanzai
Avanzai is a workflow automation tool tailored for financial services, offering AI-driven solutions to streamline processes and enhance decision-making. The platform enables funds to leverage custom data for generating valuable insights, from market trend analysis to risk assessment. With a focus on simplifying complex financial workflows, Avanzai empowers users to explore, visualize, and analyze data efficiently, without the need for extensive setup. Through open-source demos and customizable data integrations, institutions can harness the power of AI to optimize macro analysis, instrument screening, risk analytics, and factor modeling.
JesseZhang.org
Jesse Zhang's personal website showcases his background in engineering, particularly in web development, AI/ML, and mathematics. He highlights his education at Harvard University and internships at renowned companies like Citadel, Google, and Intel. Zhang also mentions his entrepreneurial ventures, including founding Lowkey, which was acquired by Niantic, and his current work on a new company. The website features various projects he has worked on, such as real-time multiplayer implementations of Camel Up and Bananagrams, a financial data visualization tool, and a demo of Zero-Knowledge proofs in the game Mastermind. Additionally, Zhang shares his interest in writing math contest problems and his involvement in angel investing through Sequoia Scouts and Neo.
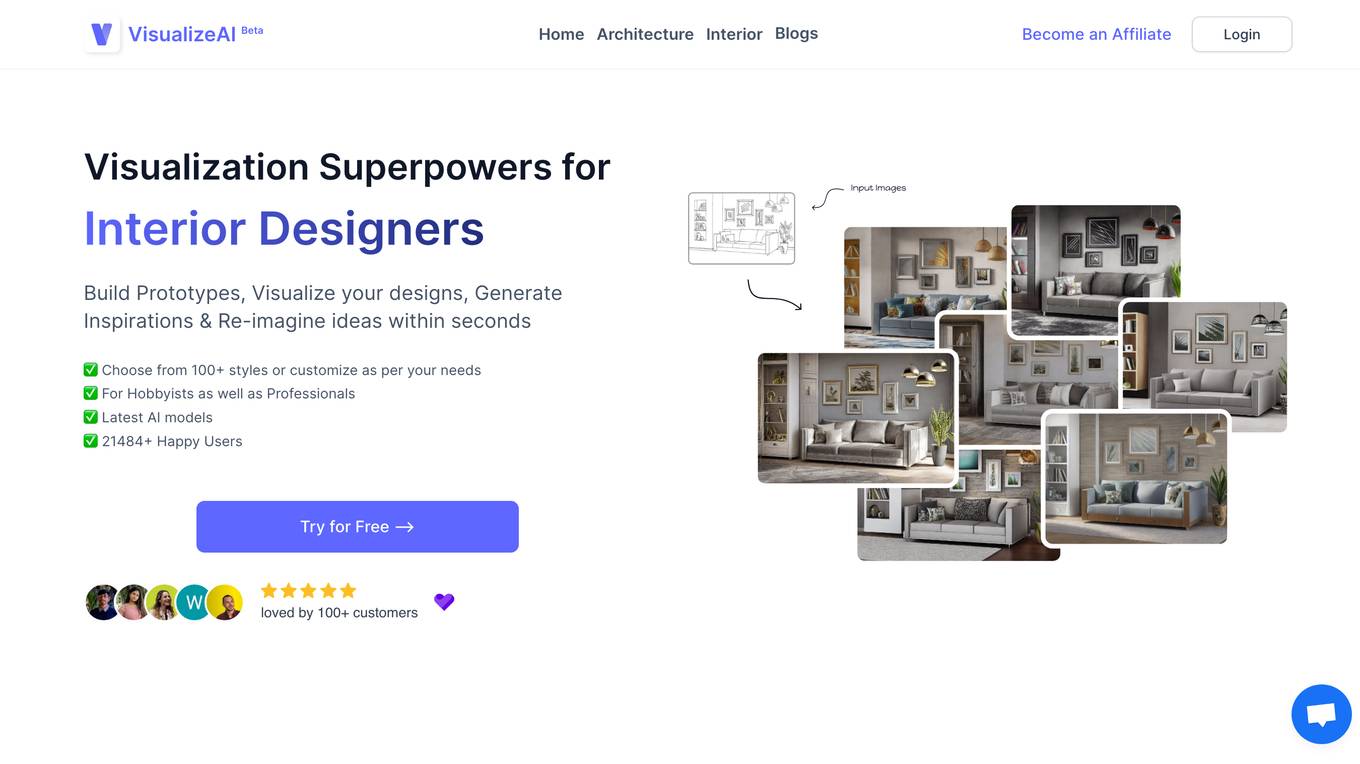
VisualizeAI
VisualizeAI is a powerful AI-powered platform that helps businesses visualize and analyze their data. With VisualizeAI, you can easily create stunning data visualizations, dashboards, and reports that will help you make better decisions. VisualizeAI is perfect for businesses of all sizes, from startups to large enterprises. It is easy to use and affordable, and it can help you save time and money while improving your decision-making.
Rerun
Rerun is an SDK, time-series database, and visualizer for temporal and multimodal data. It is used in fields like robotics, spatial computing, 2D/3D simulation, and finance to verify, debug, and explain data. Rerun allows users to log data like tensors, point clouds, and text to create streams, visualize and interact with live and recorded streams, build layouts, customize visualizations, and extend data and UI functionalities. The application provides a composable data model, dynamic schemas, and custom views for enhanced data visualization and analysis.
Vizly
Vizly is an AI-powered data analysis tool that empowers users to make the most of their data. It allows users to chat with their data, visualize insights, and perform complex analysis. Vizly supports various file formats like CSV, Excel, and JSON, making it versatile for different data sources. The tool is free to use for up to 10 messages per month and offers a student discount of 50%. Vizly is suitable for individuals, students, academics, and organizations looking to gain actionable insights from their data.
Monitr
Monitr is a data visualization and analytics platform that allows users to query, visualize, and share data in one place. It helps in tracking key metrics, making data-driven decisions, and breaking down data silos to provide a unified view of data from various sources. Users can create charts and dashboards, connect to different data sources like Postgresql and MySQL, and collaborate with teammates on SQL queries. Monitr's AI features are powered by Meta AI's Llama 3 LLM, enabling the development of powerful and flexible analytics tools for maximizing data utilization.

Julius AI
Julius AI is an advanced AI data analyst tool that allows users to analyze data with computational AI, chat with files to get expert-level insights, create sleek data visualizations, perform modeling and predictive forecasting, solve math, physics, and chemistry problems, generate polished analyses and summaries, save time by automating data work, and unlock statistical modeling without complexity. It offers features like generating visualizations, asking data questions, effortless cleaning, instant data export, creating animations, and supercharging data analysis. Julius AI is loved by over 1,200,000 users worldwide and is designed to help knowledge workers make the most out of their data.
dataset.macgence
dataset.macgence is an AI-powered data analysis tool that helps users extract valuable insights from their datasets. It offers a user-friendly interface for uploading, cleaning, and analyzing data, making it suitable for both beginners and experienced data analysts. With advanced algorithms and visualization capabilities, dataset.macgence enables users to uncover patterns, trends, and correlations in their data, leading to informed decision-making. Whether you're a business professional, researcher, or student, dataset.macgence can streamline your data analysis process and enhance your data-driven strategies.
Tabula
Tabula is a visual data analytics tool that uses AI to help businesses get insights from their data. It is easy to use and can be used by anyone, regardless of their technical expertise. Tabula can be used to access and unify data from a variety of sources, standardize and blend datasets, add custom metrics, build stunning reports, and automate repetitive tasks. Tabula is integrated with a variety of data sources and platforms, making it easy to get started.
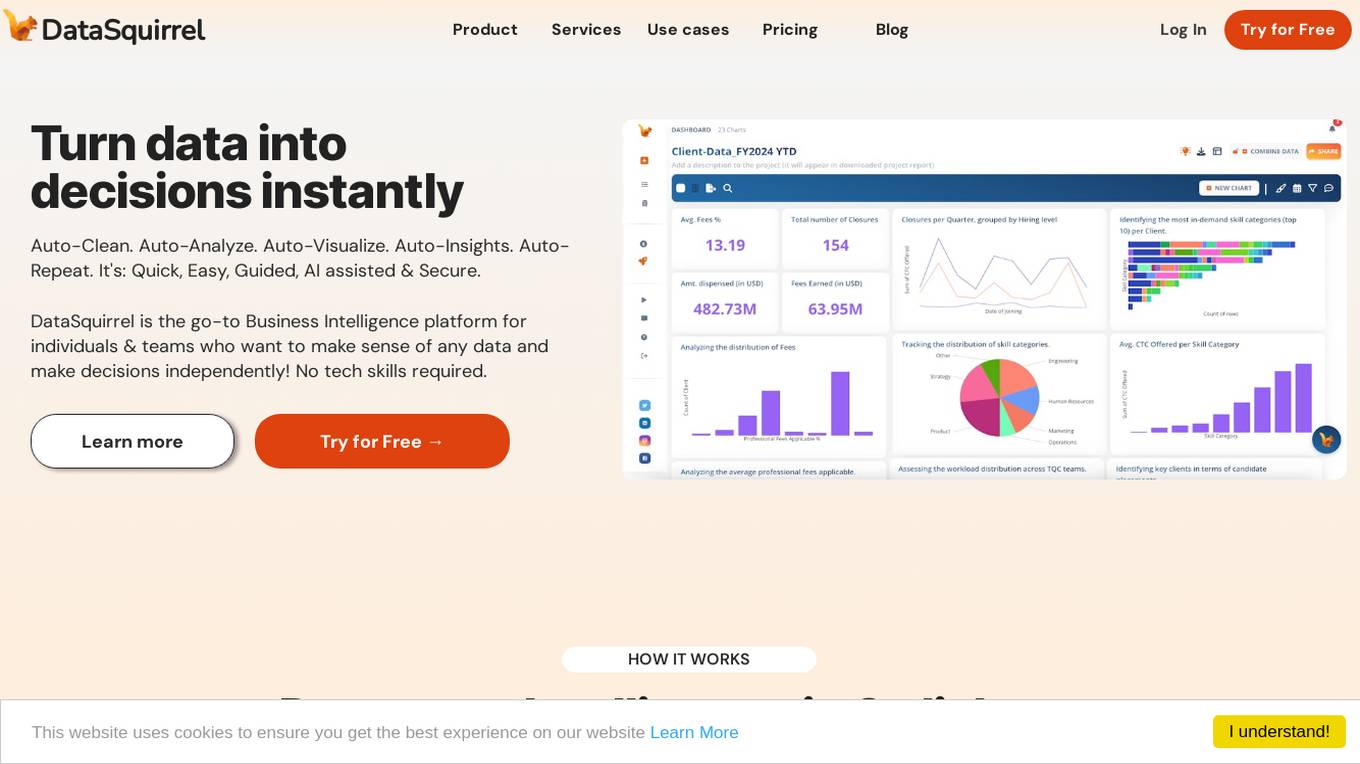
DataSquirrel.ai
DataSquirrel.ai is an AI tool designed to provide data intelligence solutions for non-technical business managers. It offers both guided and fully automatic features to help users make data-driven decisions and optimize business performance. The tool simplifies complex data analysis processes and empowers users to extract valuable insights from their data without requiring advanced technical skills.
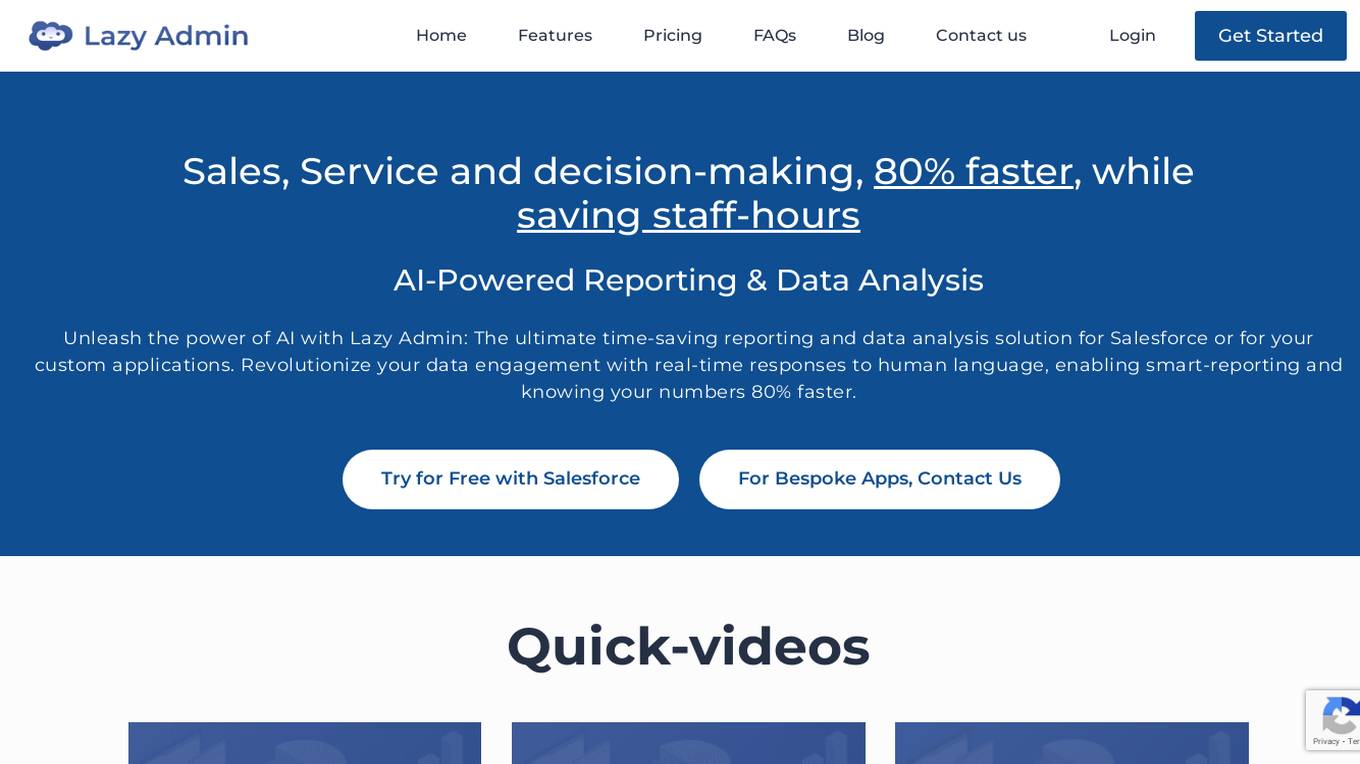
Lazy Admin
Lazy Admin is an AI-powered quick reporting and data analysis tool designed to revolutionize data engagement by providing real-time responses to human language queries. It enables smart reporting and faster decision-making by leveraging the power of AI. With features like data protection, AI-powered data analysis, export and share capabilities, and customizable options, Lazy Admin aims to streamline productivity and enhance data insights for businesses. The tool ensures data privacy and security while offering efficient search management and visualization of data through charts. Lazy Admin is suitable for Salesforce users and custom applications, offering a range of pricing plans to cater to different business needs.
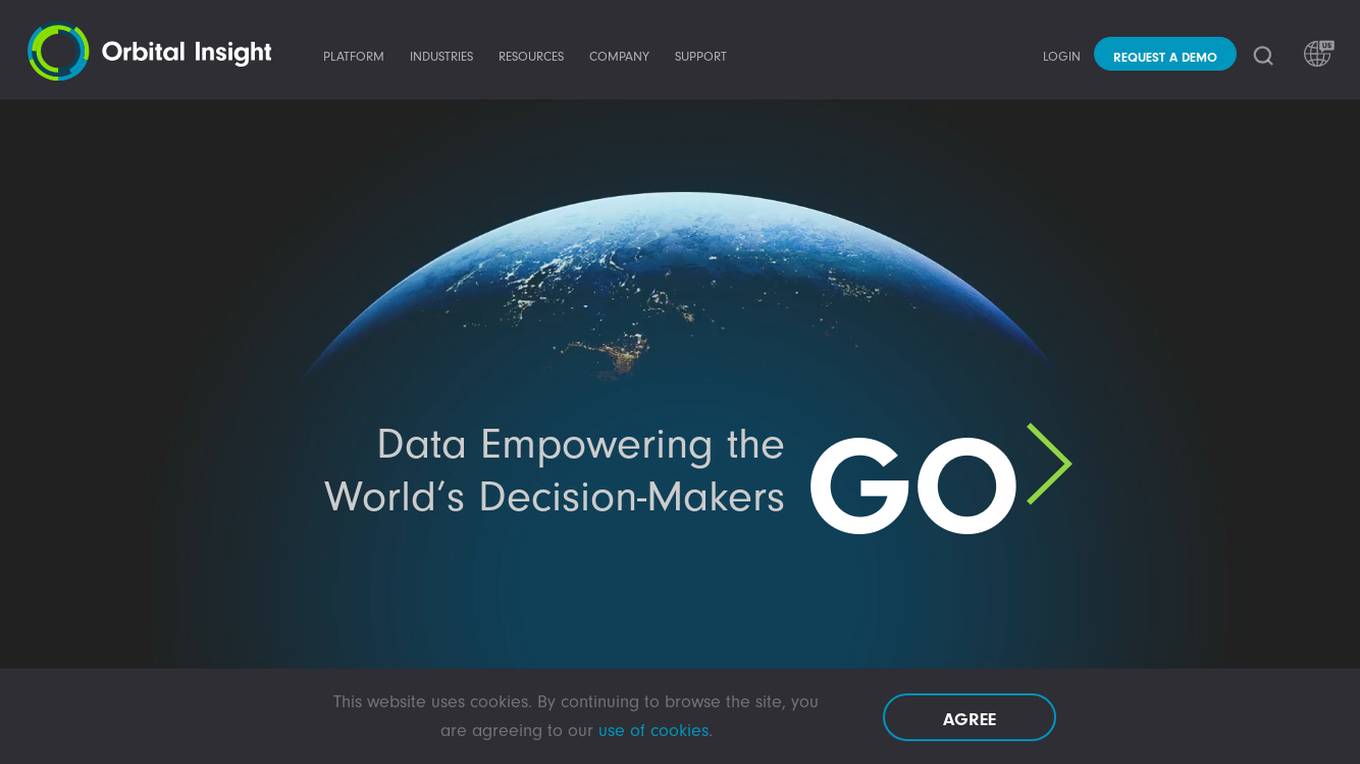
Orbital Insight GO Platform
Orbital Insight is a leading geospatial data analytics platform that provides users with the ability to query the world with three basic parameters: WHAT type of activity? WHERE on earth? WHEN? The platform automates the most difficult steps of deriving insights, allowing you to answer many challenging geospatial questions. Orbital Insight's GO platform is designed for enterprise collaboration and transforms multiple geospatial data sources to accelerate and streamline team member's research, reporting, due diligence, and more.
Lime
Lime is an AI-powered data research assistant designed to help users with data research tasks. It offers advanced capabilities to streamline the process of gathering and analyzing data, making it easier for users to derive insights and make informed decisions. Lime is equipped with cutting-edge AI technology that enables it to handle complex data sets efficiently and provide valuable recommendations. Whether you are a business professional, researcher, or student, Lime can assist you in various data-related tasks, saving you time and effort.
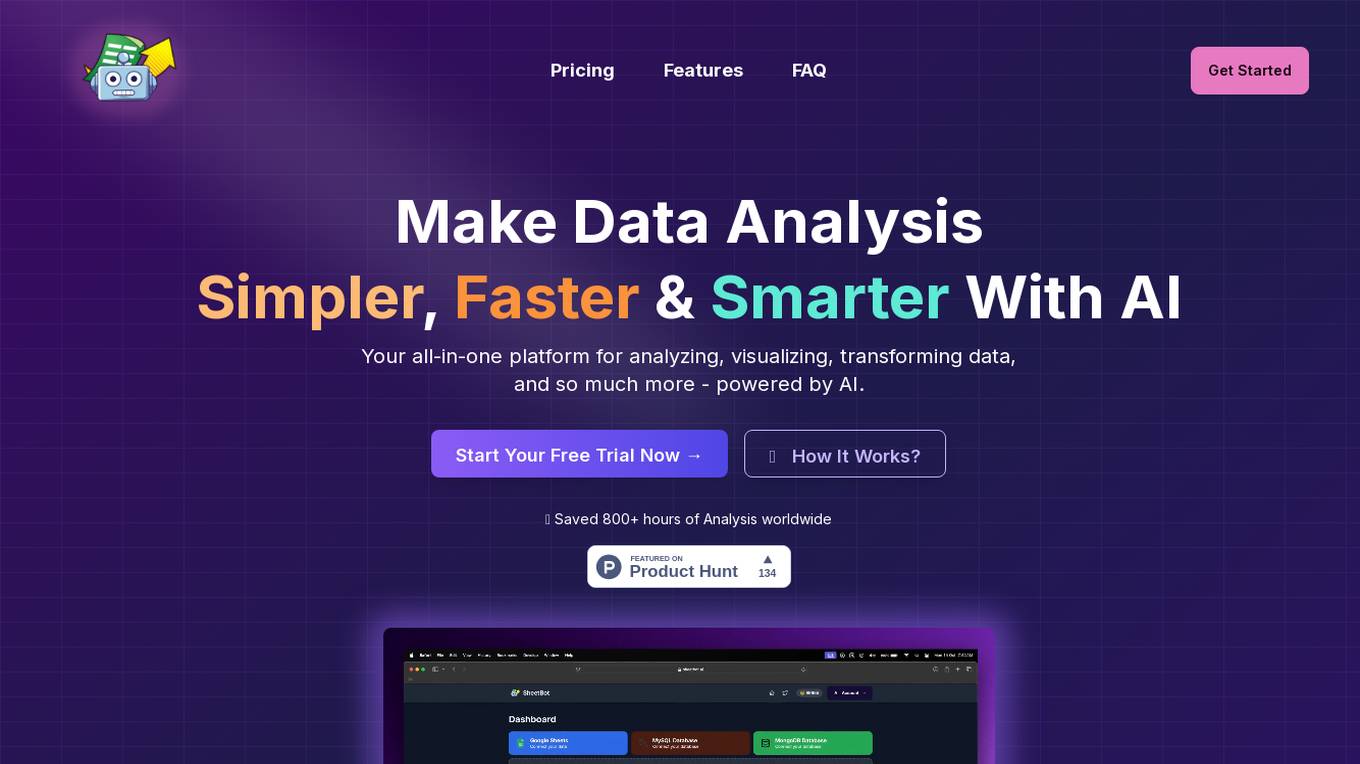
SheetBot AI
SheetBot AI is an AI data analyst tool that enables users to analyze data quickly without the need for coding. It automates repetitive and time-consuming data tasks, making data visualization and analysis more efficient. With SheetBot AI, users can generate accurate and visually appealing graphs in seconds, streamlining the data analysis process.
Easify AI
Easify AI is an intelligent data analytics tool that serves as an extension of your team. It allows you to connect your databases, query data using natural language, visualize results, and make informed decisions based on real-time insights. The tool is designed to ensure data protection, security, and compliance with GDPR regulations, offering customized AI solutions to meet your business objectives.
ChatCSV
ChatCSV is a personal data analyst tool that allows users to upload CSV files and ask questions in natural language. It generates common questions about the data, visualizes answers with charts, and maintains chat history. It is useful for industries like retail, finance, banking, marketing, and advertising to understand trends, customer behavior, and more.
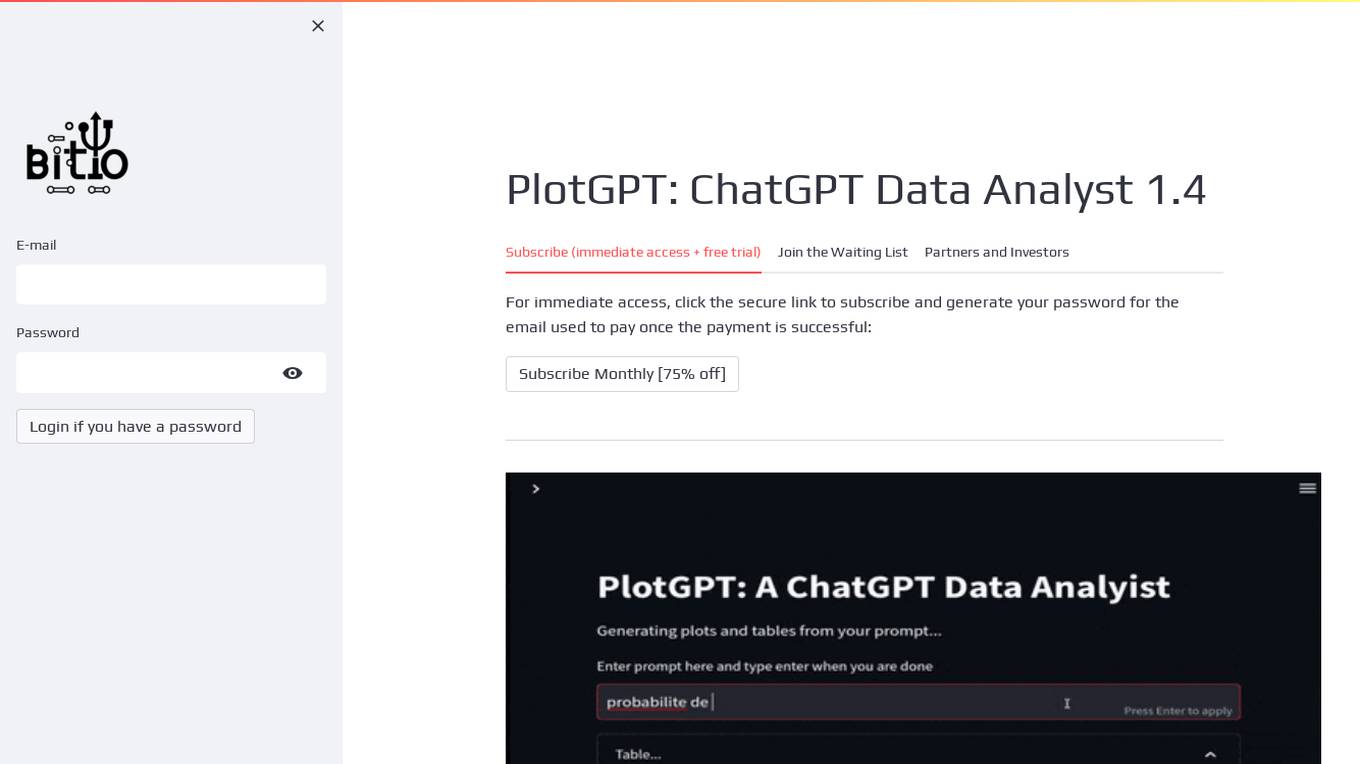
PlotGPT
PlotGPT is a data analyst that is available 24/7. It can help you with a variety of tasks, including data analysis, data visualization, and report generation. PlotGPT is easy to use and can be accessed from any device with an internet connection.
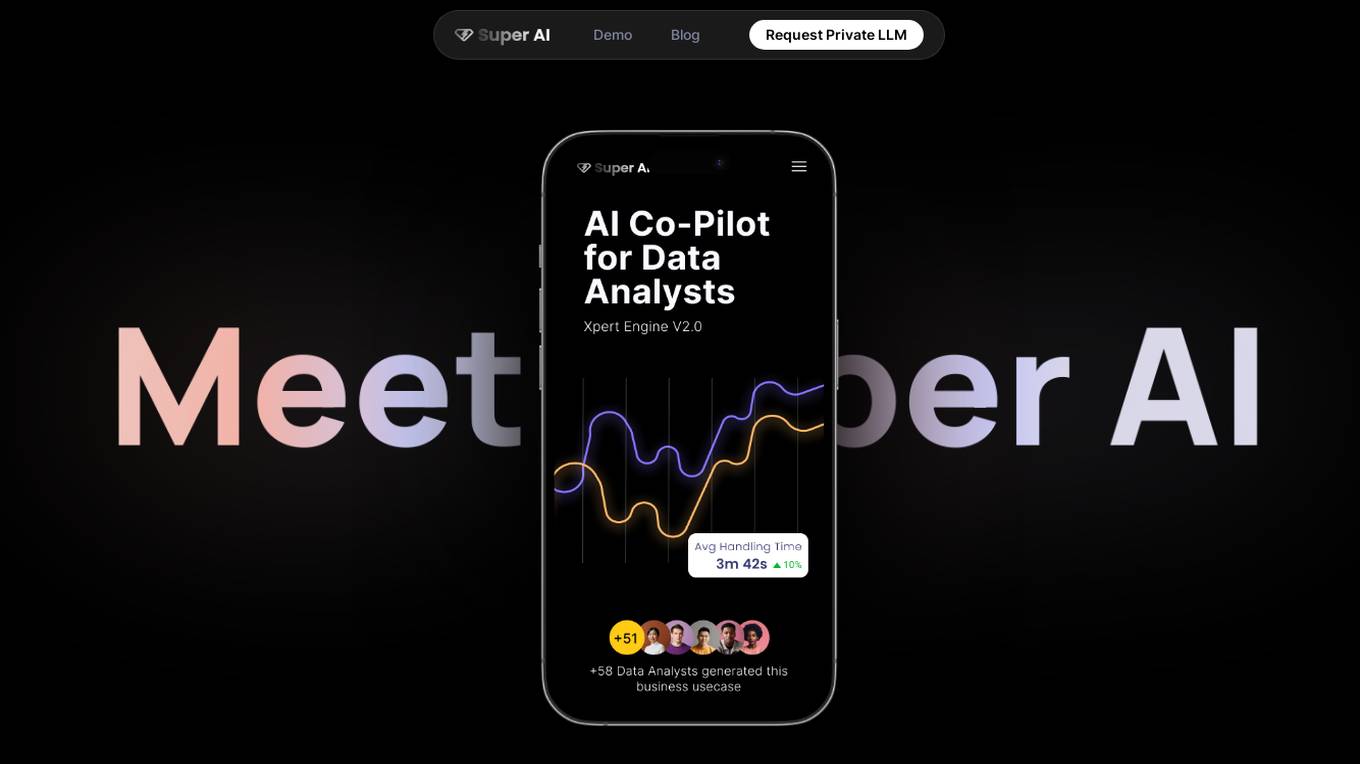
Super AI
Super AI is a generative AI tool designed as a copilot for data analysts. It is trained by top-tier product company experts and domain experts to provide unparalleled expertise in research, visualization, and data delivery. The tool goes beyond data processing by generating a comprehensive Business Decision Canvas tailored to specific challenges. Super AI offers guided insights, data modeling suggestions, and effortless integration with legacy BI systems. It is designed to convert business requirements into concrete objectives and is supported by a team of domain experts to mentor the AI. With applications in various industries, Super AI accelerates the process of finding business KPIs and generating data stories with expert intelligence.
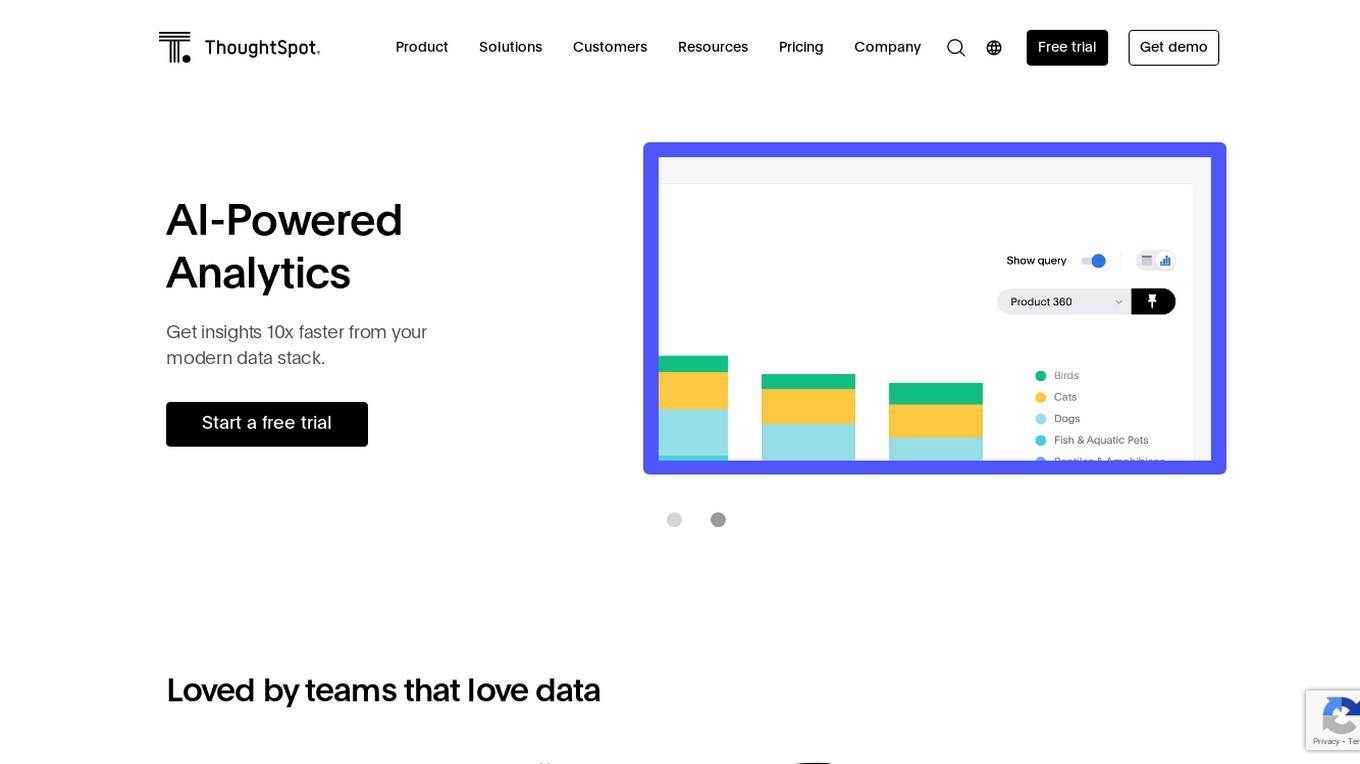
ThoughtSpot
ThoughtSpot is an AI-powered analytics platform that enables users to deliver insights 10x faster for their employees. It offers AI-powered search capabilities, natural language search, live-querying of data, building search data models, balancing self-service with enterprise-scale control, visualizing business data with Liveboards, surfacing actionable insights with augmented analytics, operationalizing cloud data sync, and more. ThoughtSpot aims to provide fast, actionable insights for all users, eliminating reporting backlogs and developer headaches.
1 - Open Source AI Tools
openops
OpenOps is a No-Code FinOps automation platform designed to help organizations reduce cloud costs and streamline financial operations. It offers customizable workflows for automating key FinOps processes, comes with its own Excel-like database and visualization system, and enables collaboration between different teams. OpenOps integrates seamlessly with major cloud providers, third-party FinOps tools, communication platforms, and project management tools, providing a comprehensive solution for efficient cost-saving measures implementation.
20 - OpenAI Gpts
Sheets Expert
Master the art of Google Sheets with an assistant who can do everything from answer questions about basic features, explain functions in an eloquent and succinct manner, simplify the most complex formulas into easy steps, and help you identify techniques to effectively visualize your data.
Illuminous - The Data Exploration AI
Expert in data analysis, visualizations, and predictions.
Emmi Data Analysis and Visualizer
Expert in data analysis and visualization, offering clear explanations and guidance.
Data Analysis Report Creator
Creates full DOCX data analysis reports with integrated visualizations
Intentions Visualizer
This GPT will help you set and visualize an intention for a spiritual ceremony
Creative Decorator
I'm an interior decorator using DALL-E 3 to visualize your space's potential.
Dungeon Campaign Visualizer
Visualize D&D adventures with stunning, lore-accurate art. Huzzah!
Character Gear
Helps character artists visualize items for characters with photo-realistic images.
Dream Visualizer(Представьте себе сон ночью)
Visualize your dreams at night.밤에 꾼 꿈을 시각화 해드립니다..จินตนาการความฝันของคุณในเวลากลางคืน.夜の夢を視覚化する.रात में अपने सपनों को दिखाएं.Hãy hình dung giấc mơ của bạn vào ban đêm.Bayangkan mimpimu di malam hari.在夜間可視化您的夢境