Best AI tools for< Visualize Charts >
20 - AI tool Sites
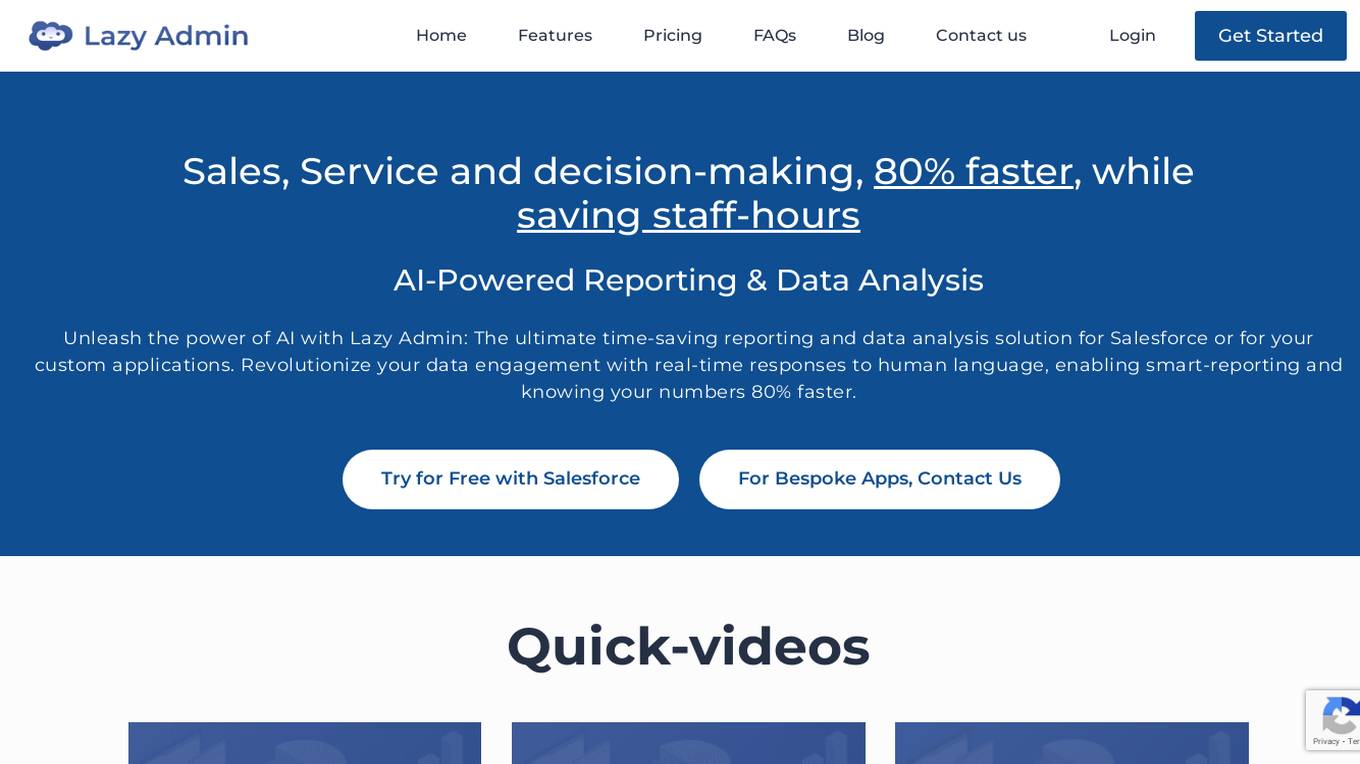
Lazy Admin
Lazy Admin is an AI-powered quick reporting and data analysis tool designed to revolutionize data engagement by providing real-time responses to human language queries. It enables smart reporting and faster decision-making by leveraging the power of AI. With features like data protection, AI-powered data analysis, export and share capabilities, and customizable options, Lazy Admin aims to streamline productivity and enhance data insights for businesses. The tool ensures data privacy and security while offering efficient search management and visualization of data through charts. Lazy Admin is suitable for Salesforce users and custom applications, offering a range of pricing plans to cater to different business needs.

Julius
Julius is a personal AI data analyst tool developed by the team behind HoopsGPT. It simplifies sports insights, providing users with comprehensive information about the game. The tool offers features such as stats lookup, shot chart visualization, parlay analysis, and comparison of player props and game lines from various bookmakers. Julius aims to make complex sports data accessible through plain English queries, enabling users to make informed decisions based on data-driven insights.
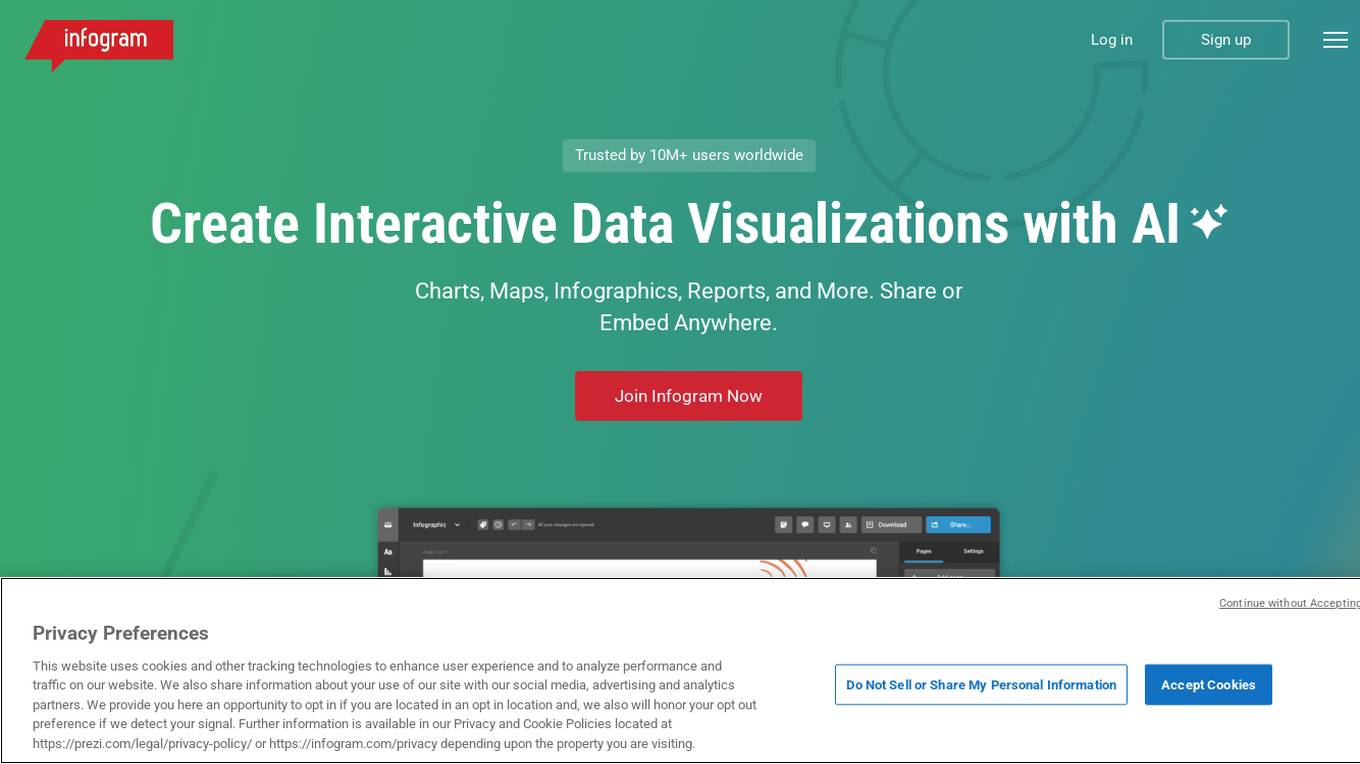
Infogram
Infogram is an AI-powered platform that enables users to create interactive data visualizations, infographics, reports, maps, charts, tables, slides, and dashboards effortlessly. With a wide range of features such as AI chart recommendations, interactive content, embeds, custom maps, data import, and advanced editing tools, Infogram empowers users to craft compelling visual stories. The platform also offers content engagement analytics, real-time collaboration, and a brand kit for consistent branding. Trusted by over 10 million users worldwide, Infogram is a go-to tool for individuals, teams, and organizations looking to transform data into engaging visuals.
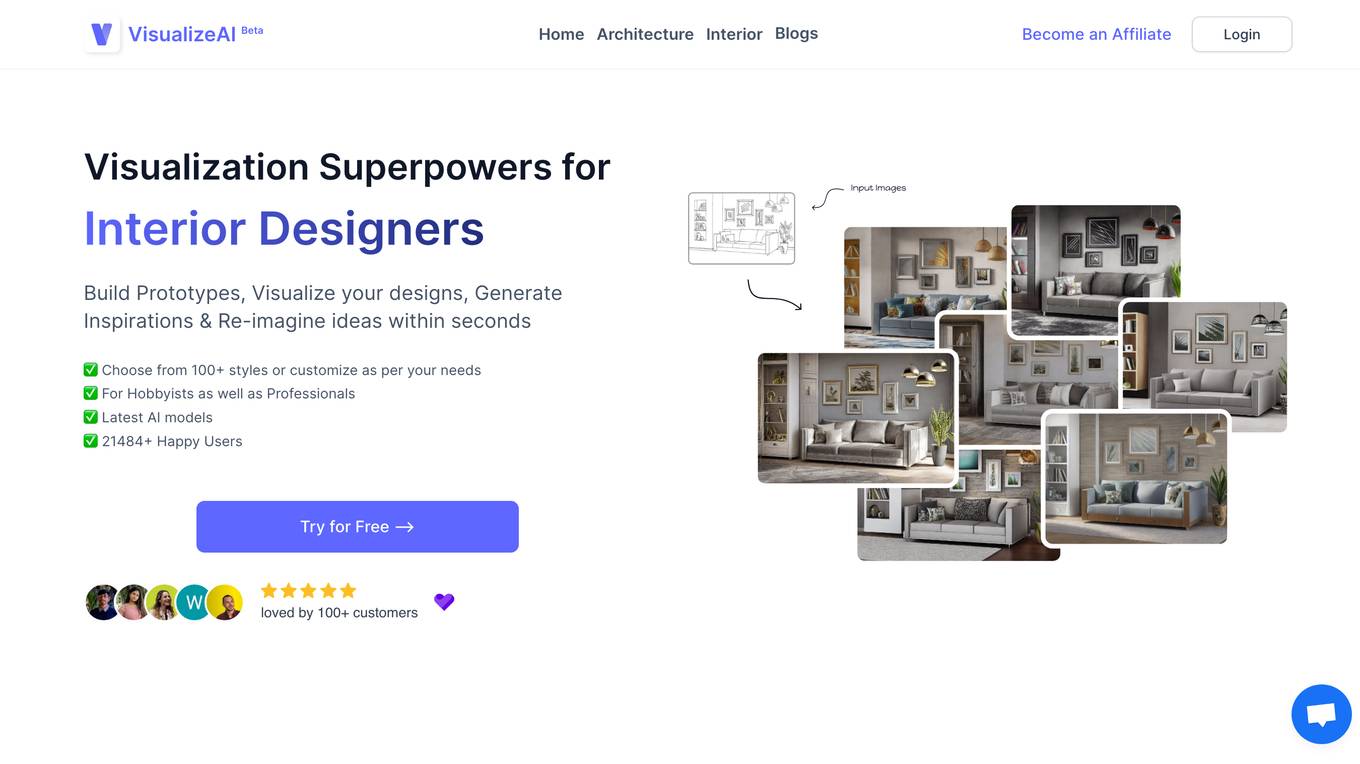
VisualizeAI
VisualizeAI is a powerful AI-powered platform that helps businesses visualize and analyze their data. With VisualizeAI, you can easily create stunning data visualizations, dashboards, and reports that will help you make better decisions. VisualizeAI is perfect for businesses of all sizes, from startups to large enterprises. It is easy to use and affordable, and it can help you save time and money while improving your decision-making.
Monitr
Monitr is a data visualization and analytics platform that allows users to query, visualize, and share data in one place. It helps in tracking key metrics, making data-driven decisions, and breaking down data silos to provide a unified view of data from various sources. Users can create charts and dashboards, connect to different data sources like Postgresql and MySQL, and collaborate with teammates on SQL queries. Monitr's AI features are powered by Meta AI's Llama 3 LLM, enabling the development of powerful and flexible analytics tools for maximizing data utilization.
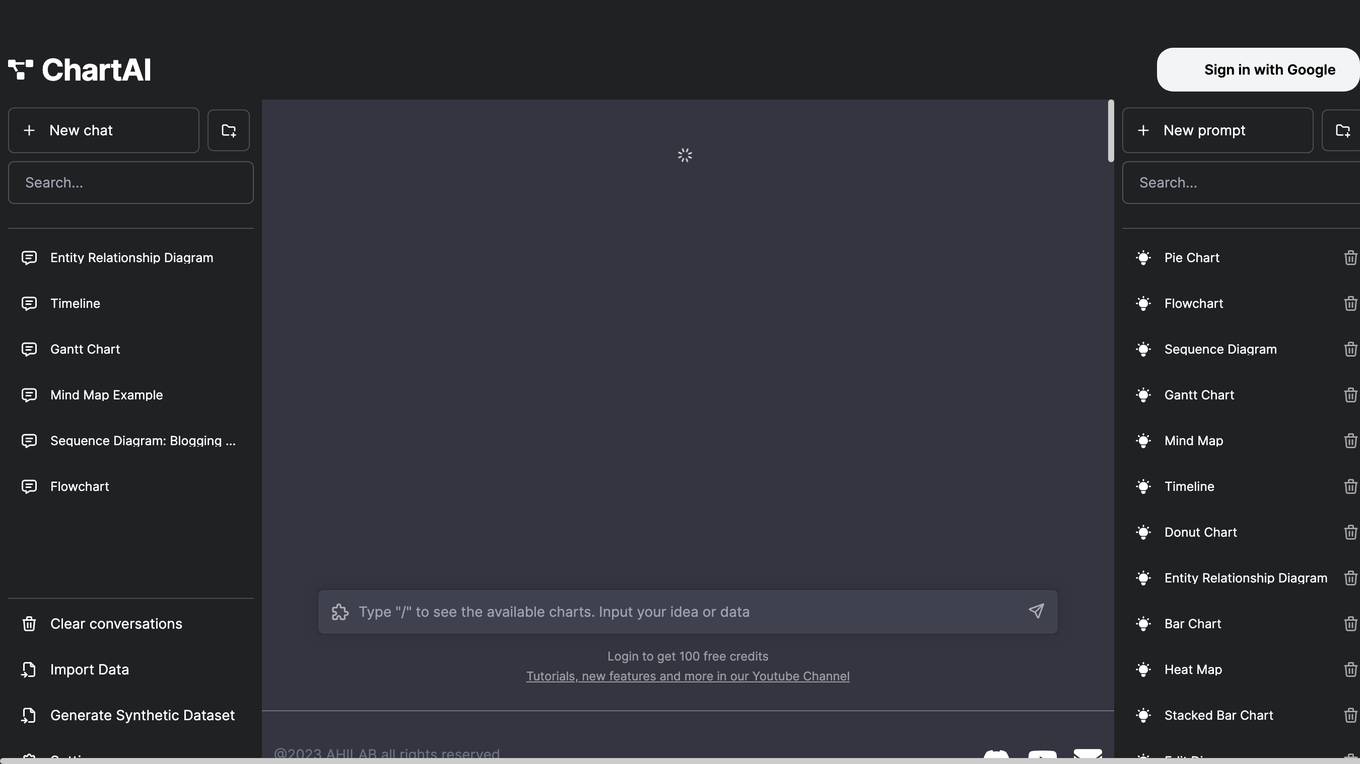
ChartAI
ChartAI is an AI-powered tool that helps you create beautiful charts and graphs from your data in seconds. With ChartAI, you can easily create bar charts, line charts, pie charts, and more. You can also customize your charts with different colors, fonts, and styles. ChartAI is the perfect tool for anyone who wants to create professional-looking charts and graphs quickly and easily.
Chat2CSV
The website offers an AI-powered tool for easy data visualization through natural language commands. Users can transform CSV data into various charts without the need for complex coding. The platform provides a wide range of chart types, smart AI support, and prioritizes data security and privacy. It simplifies data visualization tasks, making it intuitive and versatile for users to create visual insights effortlessly.
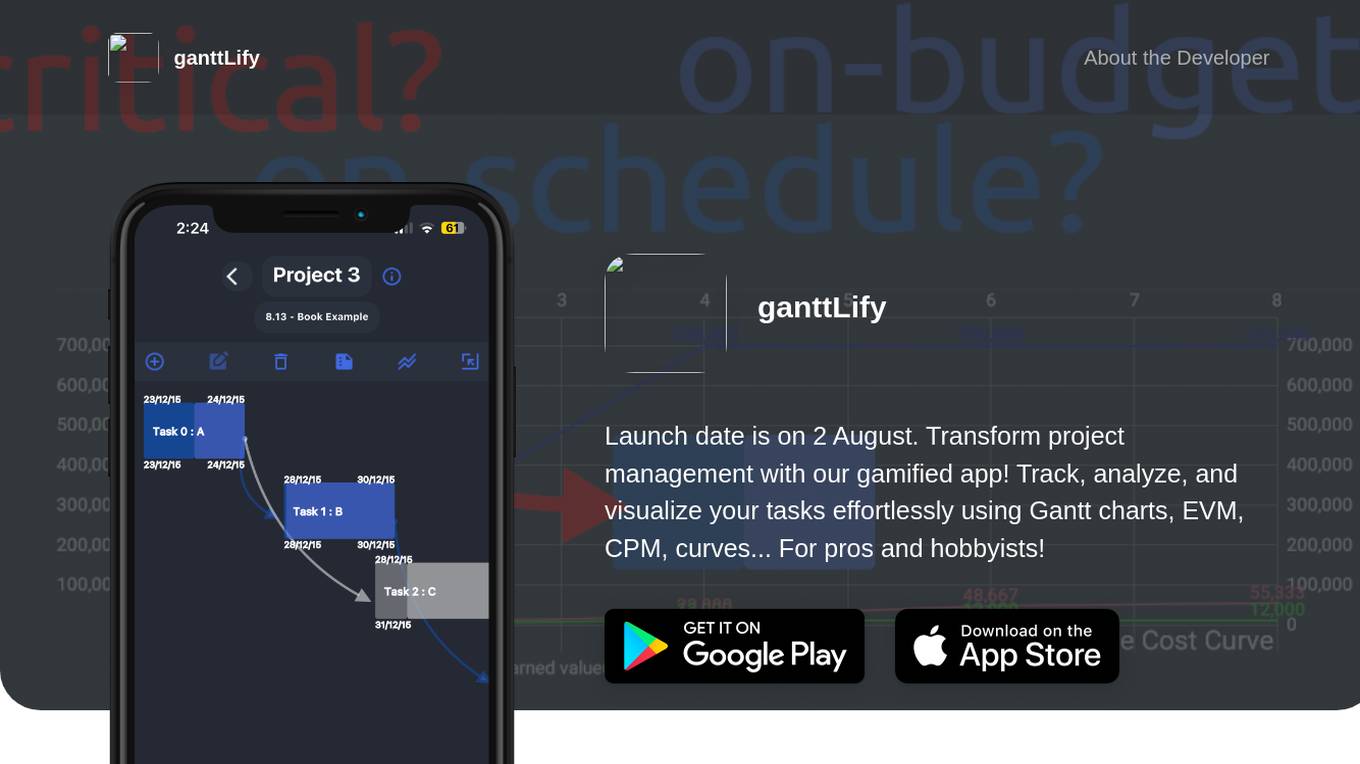
ganttLify
ganttLify is a project management application that offers a gamified approach to tracking, analyzing, and visualizing tasks using tools like Gantt charts, EVM, CPM, and curves. It helps both professionals and hobbyists manage projects efficiently by providing features such as Critical Path Method (CPM), Earned Value Management (EVM), Gantt Chart visualization, Cumulative Cost Curve monitoring, text notes & to-dos organization, sketch & draw capabilities, and upcoming AI, AR/VR, voice note, and team collaboration support.
ChartPixel
ChartPixel is an AI-assisted data analysis platform that empowers users to effortlessly generate charts, insights, and actionable statistics in just 30 seconds. The platform is designed to demystify data and analysis, making it accessible to users of all skill levels. ChartPixel combines the power of AI with domain expertise to provide secure and reliable output, ensuring trustworthy results without compromising data privacy. With user-friendly features and educational tools, ChartPixel helps users clean, wrangle, visualize, and present data with ease, catering to both beginners and professionals.
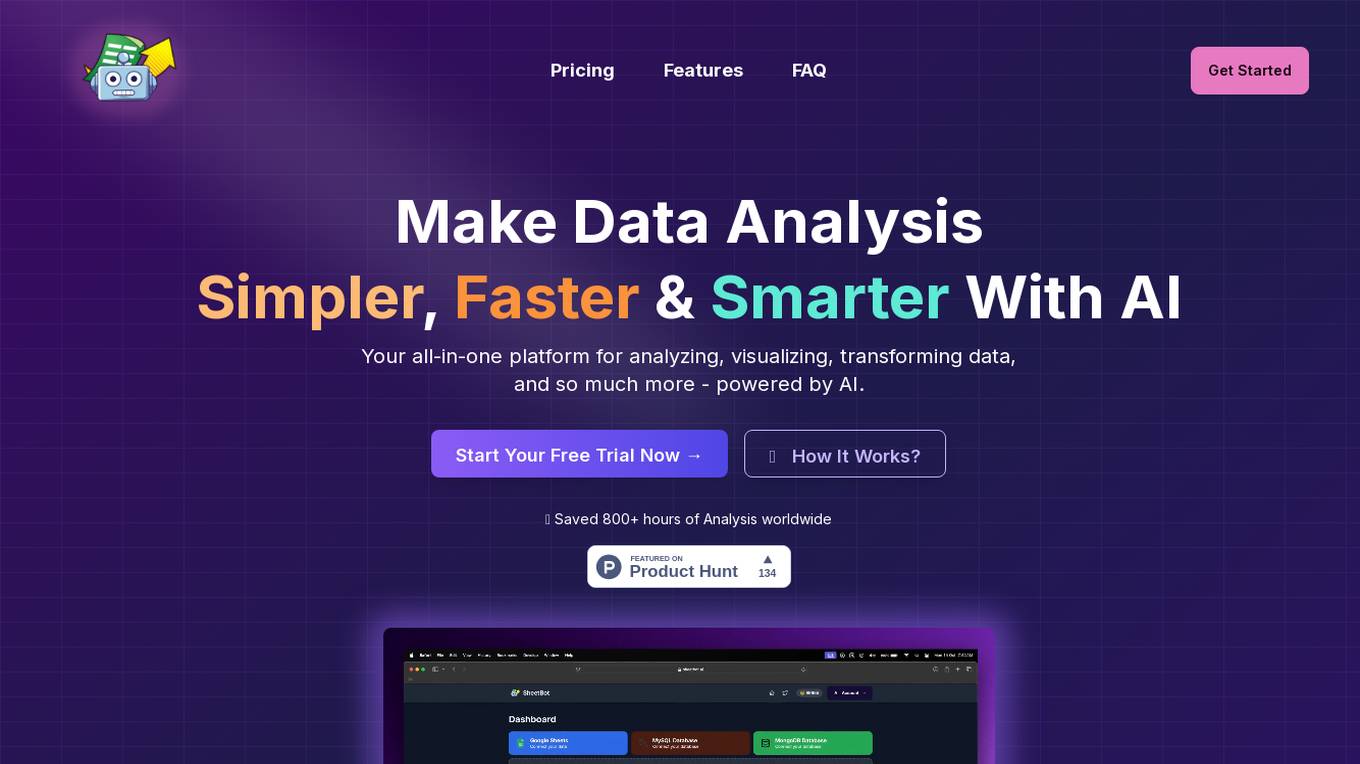
SheetBot AI
SheetBot AI is an AI data analyst tool that enables users to analyze data quickly without the need for coding. It automates repetitive and time-consuming data tasks, making data visualization and analysis more efficient. With SheetBot AI, users can generate accurate and visually appealing graphs in seconds, streamlining the data analysis process.
Basedash
Basedash is an AI-powered data visualization and management tool that enables teams to collaborate and share insights from their databases. It offers features such as a user-friendly interface, customizable dashboards, and powerful SQL editing capabilities. Basedash is designed to streamline data exploration, analysis, and decision-making, making it suitable for various use cases, including customer relationship management, product development, and data-driven decision-making.
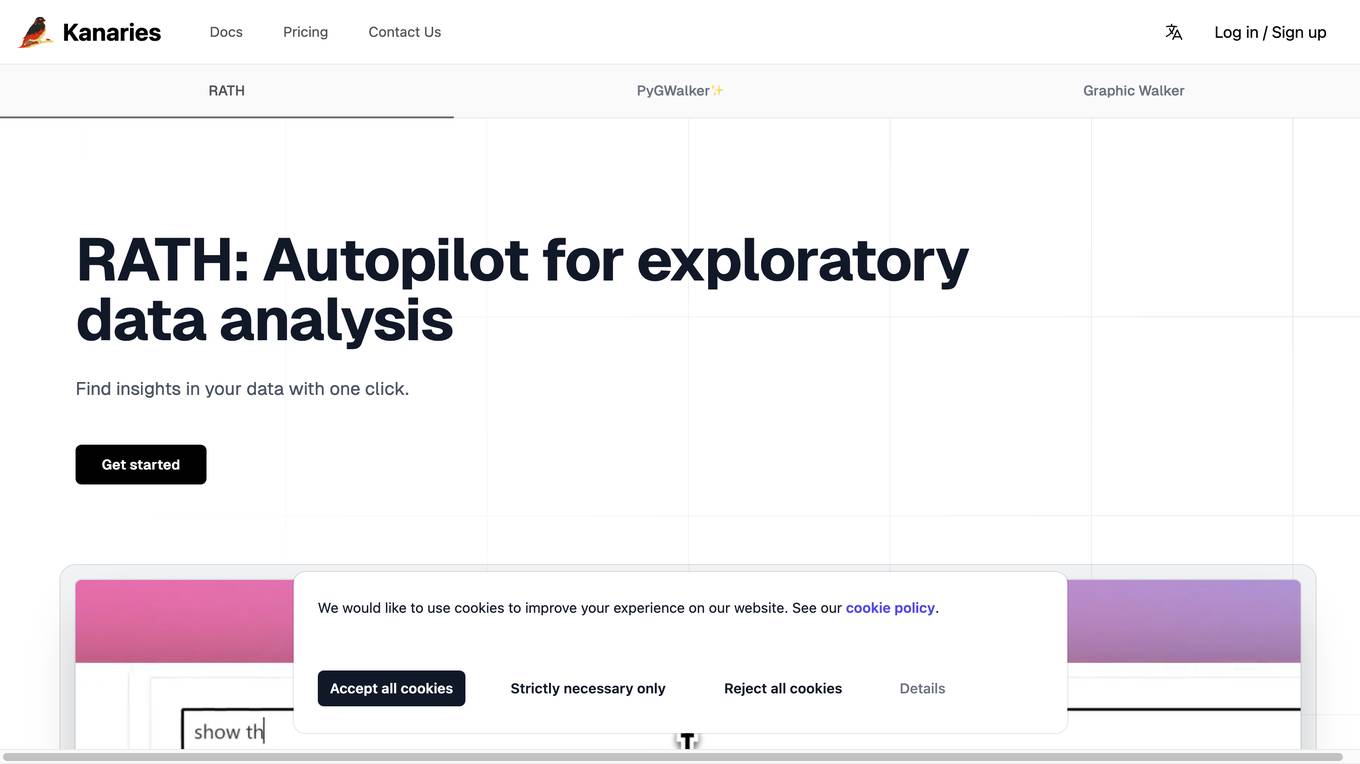
Kanaries
Kanaries is an augmented analytics platform that uses AI to automate the process of data exploration and visualization. It offers a variety of features to help users quickly and easily find insights in their data, including: * **RATH:** An AI-powered engine that can automatically generate insights and recommendations based on your data. * **Graphic Walker:** A visual analytics tool that allows you to explore your data in a variety of ways, including charts, graphs, and maps. * **Data Painter:** A data cleaning and transformation tool that makes it easy to prepare your data for analysis. * **Causal Analysis:** A tool that helps you identify and understand the causal relationships between variables in your data. Kanaries is designed to be easy to use, even for users with no prior experience with data analysis. It is also highly scalable, so it can be used to analyze large datasets. Kanaries is a valuable tool for anyone who wants to quickly and easily find insights in their data. It can be used by businesses of all sizes, and it is particularly well-suited for organizations that are looking to improve their data-driven decision-making.
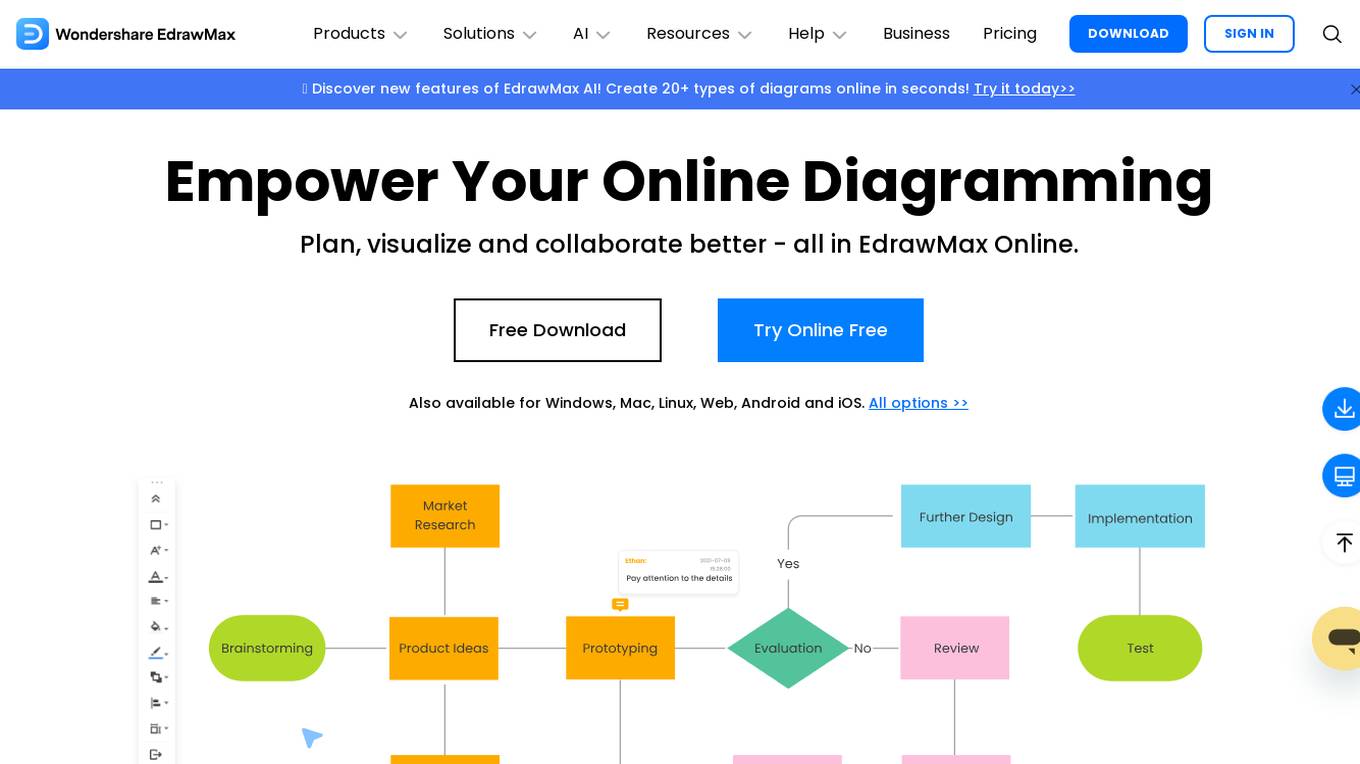
EdrawMax Online
EdrawMax Online is an all-in-one diagram maker and software product that offers a wide range of tools for creating various types of diagrams, such as flowcharts, mind maps, org charts, Gantt charts, and more. The application harnesses the power of AI to provide features like AI diagramming, AI chat, AI drawing, AI analysis, AI copywriting, and AI OCR. It enables users to plan, visualize, and collaborate effectively, offering over 210 diagram types, cloud-based teamwork collaboration, a vast template library, and seamless sharing options. EdrawMax Online is a versatile and powerful drawing tool suitable for individuals and organizations, providing professional solutions for various industries.
Tablepad
Tablepad is an AI-powered data analytics tool that allows users to upload, view, and query data effortlessly. With Tablepad, users can generate insights and create charts without the need for coding skills. The tool supports various file formats and offers automated visual insights by generating graphs and charts based on plain English questions. Tablepad simplifies data exploration and visualization, making it easy for users to uncover valuable insights from their data.
GitMind
GitMind is an AI-powered free collaborative mind mapping software designed for brainstorming and idea co-creation. It stimulates the flow of ideas, allowing users to create mind maps, flowcharts, organizational charts, UML diagrams, and swimlanes. The platform focuses on enhancing creativity, promoting the evolution of individual and organizational consciousness, and making ideas more valuable. GitMind aims to empower users to create their own metaverse of ideas by connecting, flowing, and co-creating valuable ideas.
EdrawMind
EdrawMind is a mind mapping software that helps users to organize their ideas, collaborate with others, and create presentations. It offers a variety of features, including the ability to create mind maps, timelines, tree charts, and bubble maps. EdrawMind also includes a number of AI-powered features, such as AI One-Click Mind Map Creation, AI SWOT Analysis, and AI Brainstorming. These features can help users to quickly and easily create mind maps, generate creative ideas, and improve their productivity.
ChatViz
ChatViz is an AI-powered data visualization tool that leverages ChatGPT to enhance data visualization capabilities. It offers features such as SQL translator and chart suggestion to streamline the visualization process. By utilizing ChatViz, users can optimize development time, simplify data visualization, and say goodbye to dashboard complexity. The tool provides a new way to visualize data, reducing development time and improving user experience.
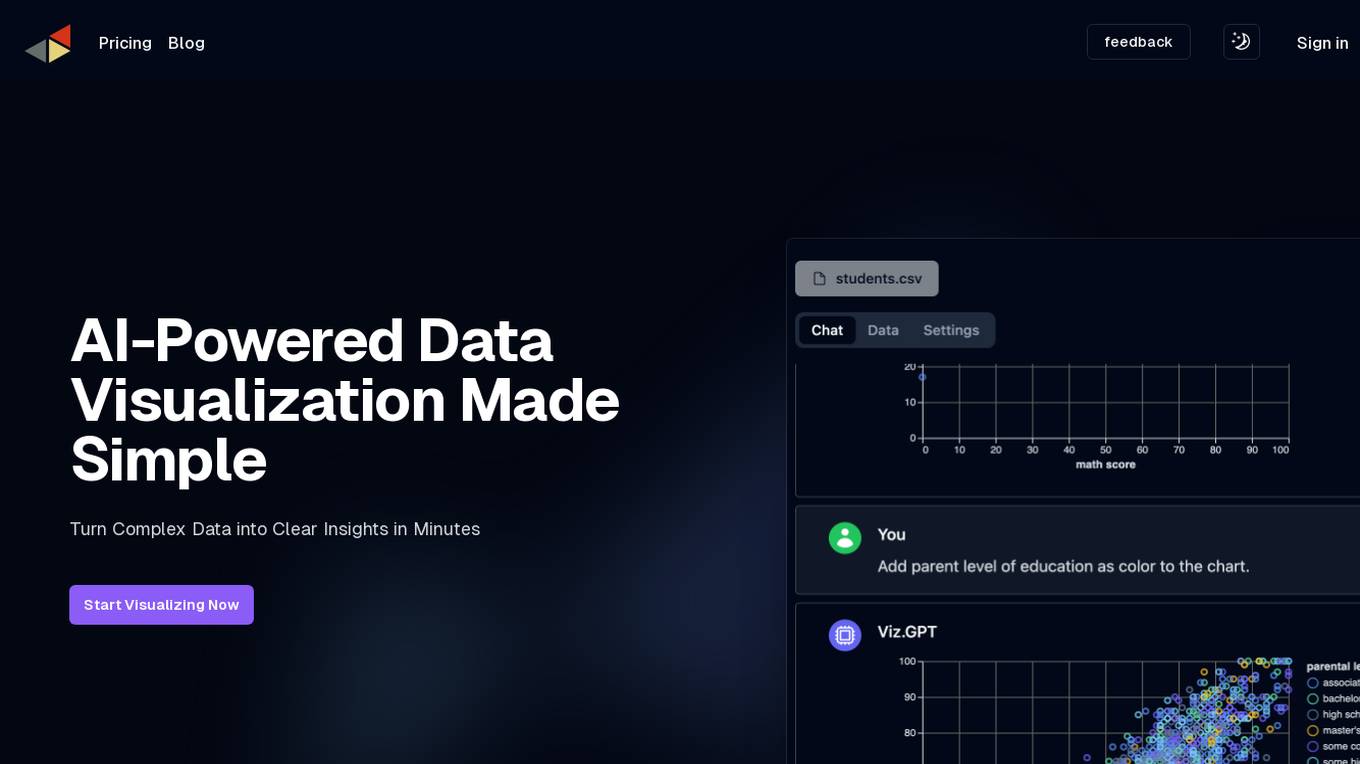
vizGPT
vizGPT is an AI-powered data visualization tool that simplifies the process of turning complex data into clear insights. The software offers contextual understanding, intelligent conversation, and natural language processing capabilities to help users quickly generate and understand complex visualizations. With real-time responses and contextual memory features, vizGPT provides a seamless data storytelling experience. Users can create visualizations using a no-code GUI with drag-and-drop functionality and leverage powerful data transformation and profiling tools. vizGPT aims to revolutionize data visualization by offering an intuitive and efficient solution for data analysis.
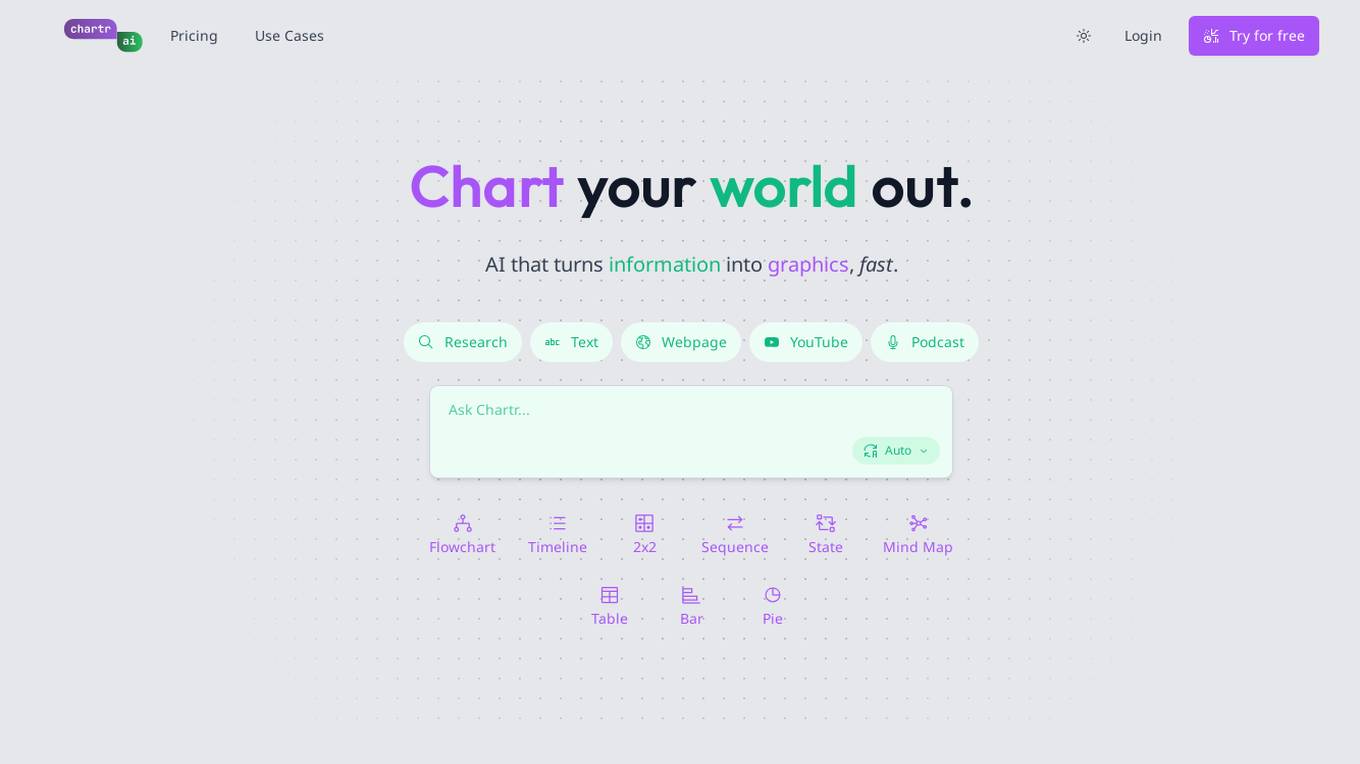
Chartr
Chartr is an AI tool that quickly transforms information into graphics. It offers a user-friendly platform where users can easily create various types of visual representations such as flowcharts, timelines, mind maps, tables, and more. Chartr aims to simplify the process of visualizing data and making it more engaging and understandable for users across different industries.
ChatCSV
ChatCSV is your personal data analyst that allows you to interact with your spreadsheets in a conversational manner. Simply upload a CSV file and start asking questions to get insights through visualizations. It is designed to assist users across various industries such as retail, finance, banking, marketing, and more, making data analysis more accessible and intuitive.
1 - Open Source AI Tools
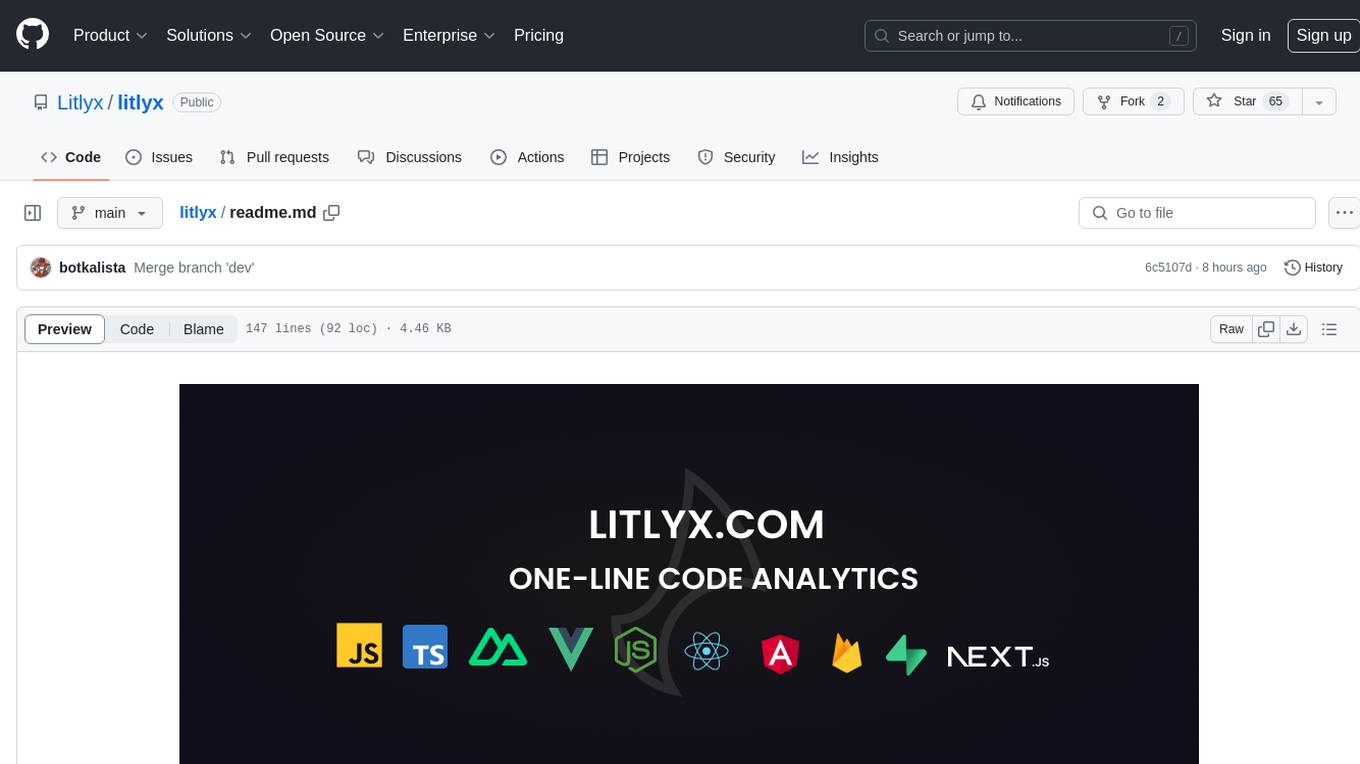
litlyx
Litlyx is a single-line code analytics solution that integrates with every JavaScript/TypeScript framework. It allows you to track 10+ KPIs and custom events for your website or web app. The tool comes with an AI Data Analyst Assistant that can analyze your data, compare data, query metadata, visualize charts, and more. Litlyx is open-source, allowing users to self-host it and create their own version of the dashboard. The tool is user-friendly and supports various JavaScript/TypeScript frameworks, making it versatile for different projects.
20 - OpenAI Gpts
Diagrams: Show Me | charts, presentations, code
Diagram creation: flowcharts, mindmaps, UML, chart, PlotUML, workflow, sequence, ERD, database & architecture visualization for code, presentations and documentation. [New] Add a logo or any image to graph diagrams. Easy Download & Edit
Sheets Expert
Master the art of Google Sheets with an assistant who can do everything from answer questions about basic features, explain functions in an eloquent and succinct manner, simplify the most complex formulas into easy steps, and help you identify techniques to effectively visualize your data.
Plotter
Provide a hand-drawing or screenshot of your desired plot along with the data and I'll make the plot.
Intentions Visualizer
This GPT will help you set and visualize an intention for a spiritual ceremony
Creative Decorator
I'm an interior decorator using DALL-E 3 to visualize your space's potential.
Dungeon Campaign Visualizer
Visualize D&D adventures with stunning, lore-accurate art. Huzzah!
Character Gear
Helps character artists visualize items for characters with photo-realistic images.
Dream Visualizer(Представьте себе сон ночью)
Visualize your dreams at night.밤에 꾼 꿈을 시각화 해드립니다..จินตนาการความฝันของคุณในเวลากลางคืน.夜の夢を視覚化する.रात में अपने सपनों को दिखाएं.Hãy hình dung giấc mơ của bạn vào ban đêm.Bayangkan mimpimu di malam hari.在夜間可視化您的夢境
Law of Attraction Guide
A guide to visualize and manifest your desires through the Law of Attraction.
Time Zone GPT
International Time Zone Meeting Planner / Converter (independently verify info received). Meet your AI assistant for managing international time zones, specializing in coordinating meetings & events across different regions. Effortlessly plan & visualize physical & digital global engagements.