Best AI tools for< Build Visualizations >
20 - AI tool Sites
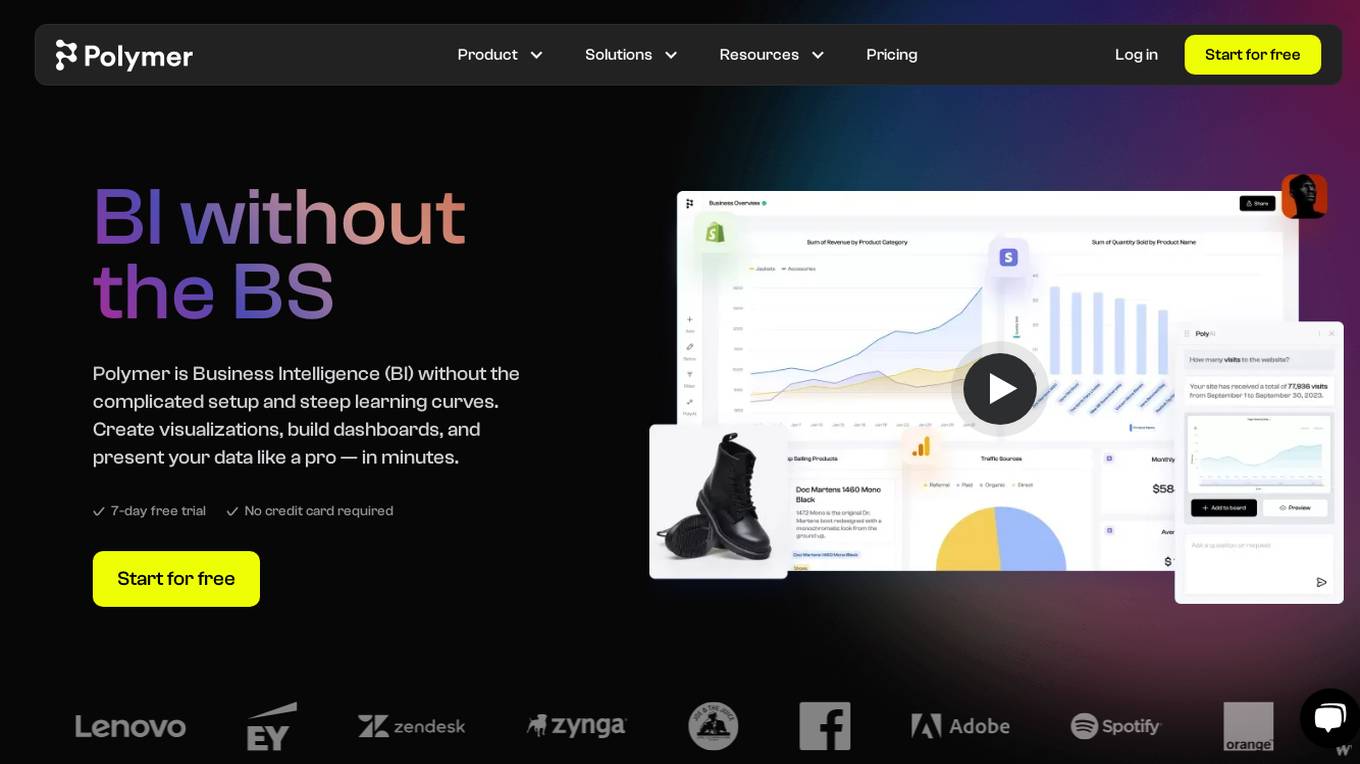
Polymer
Polymer is a business intelligence (BI) tool that makes it easy to connect to your data, build visualizations, and share insights. With Polymer, you don't need to be a data analyst to create beautiful dashboards and interactive reports. Polymer's AI-powered features make it easy to get started, even if you're new to BI. With Polymer, you can:
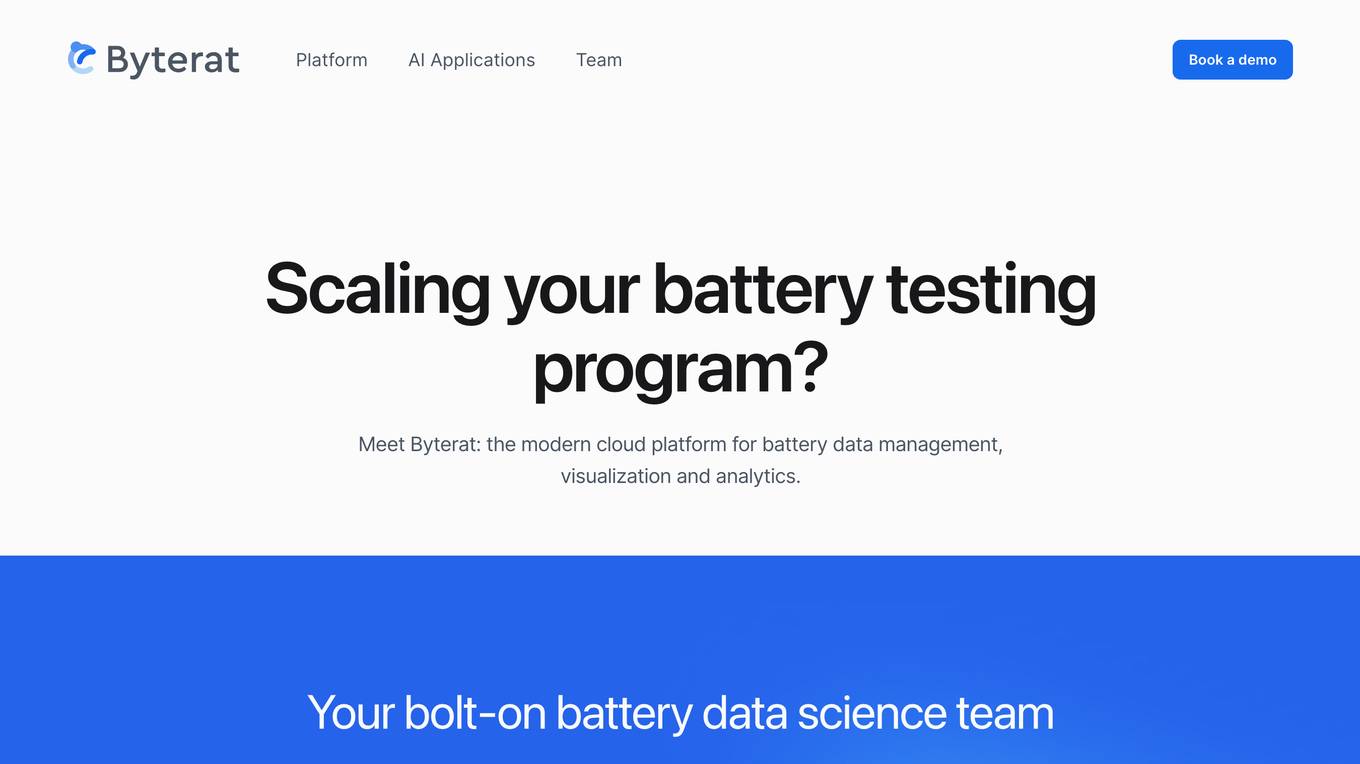
Byterat
Byterat is a cloud-based platform that provides battery data management, visualization, and analytics. It offers an end-to-end data pipeline that automatically synchronizes, processes, and visualizes materials, manufacturing, and test data from all labs. Byterat also provides 24/7 access to experiments from anywhere in the world and integrates seamlessly with current workflows. It is customizable to specific cell chemistries and allows users to build custom visualizations, dashboards, and analyses. Byterat's AI-powered battery research has been published in leading journals, and its team has pioneered a new class of models that extract tell-tale signals of battery health from electrical signals to forecast future performance.
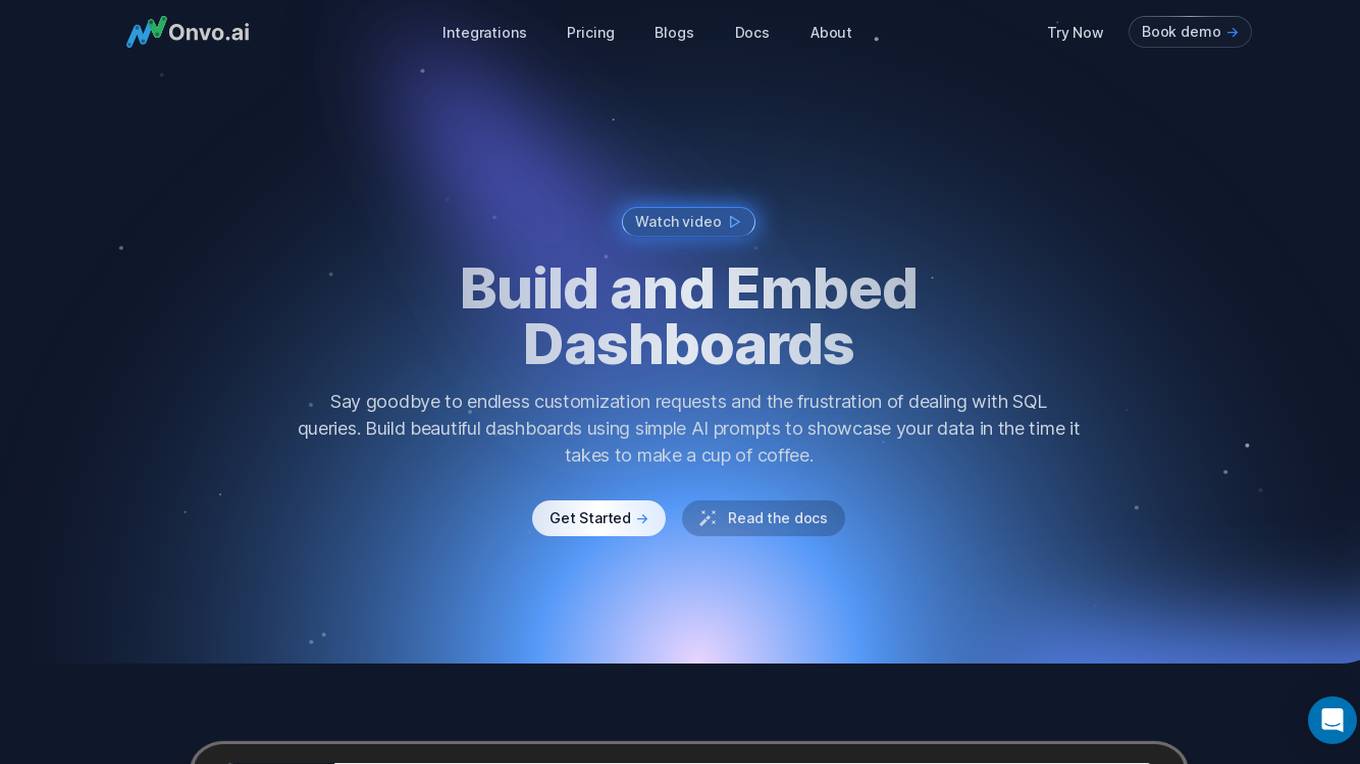
Onvo AI
Onvo AI is an embedded data visualization platform that allows users to create interactive dashboards and data visualizations using simple AI prompts. It connects to various data sources, enabling users to build insightful charts and visualizations without the need for complex queries or manual data manipulation. Onvo AI offers customization options, allowing users to match their brand's identity and provides secure sharing and embedding features. It also includes analytics capabilities, enabling users to track dashboard usage and user engagement.

Amazon Q in QuickSight
Amazon Q in QuickSight is a generative BI assistant that makes it easy to build and consume insights. With Amazon Q, BI users can build, discover, and share actionable insights and narratives in seconds using intuitive natural language experiences. Analysts can quickly build visuals and calculations and refine visuals using natural language. Business users can self-serve data and insights using natural language. Amazon Q is built with security and privacy in mind. It can understand and respect your existing governance identities, roles, and permissions and use this information to personalize its interactions. If a user doesn't have permission to access certain data without Amazon Q, they can't access it using Amazon Q either. Amazon Q in QuickSight is designed to meet the most stringent enterprise requirements from day one—none of your data or Amazon Q inputs and outputs are used to improve underlying models of Amazon Q for anyone but you.
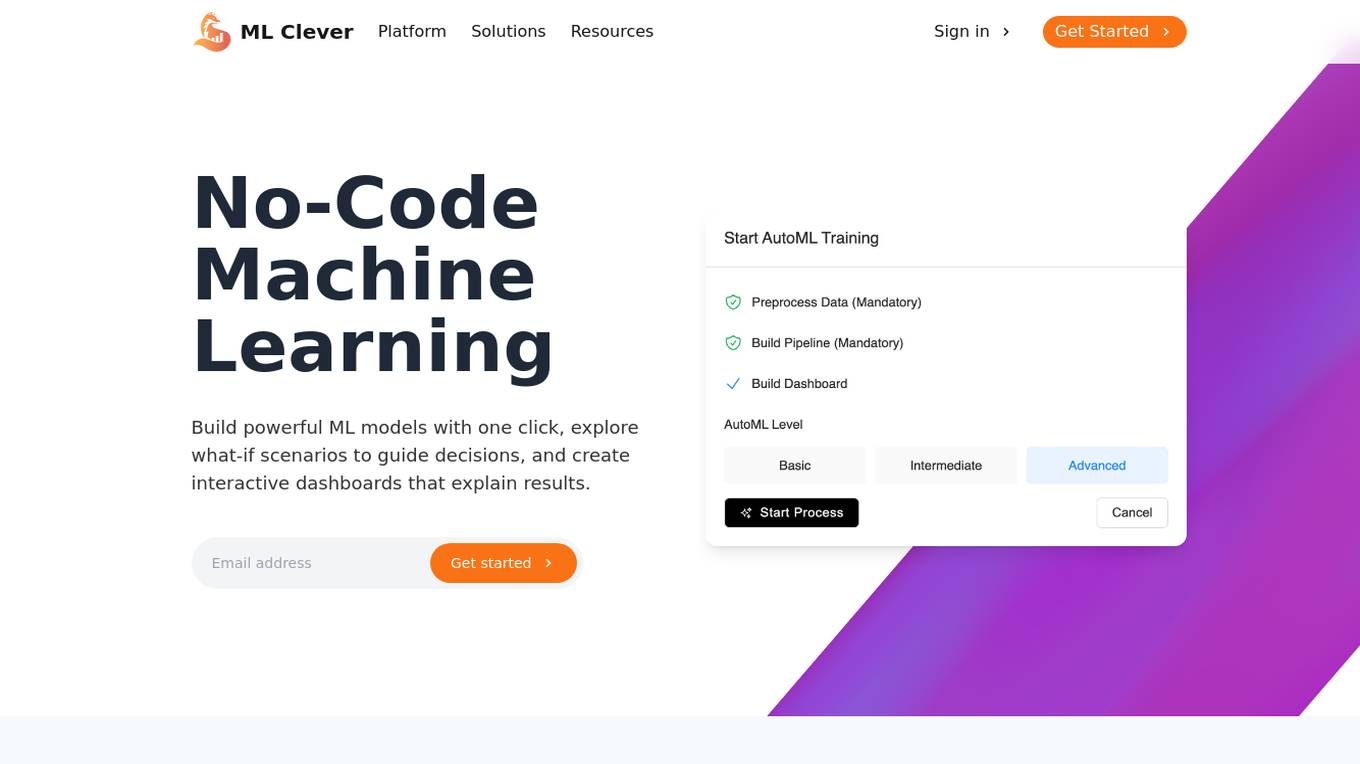
ML Clever
ML Clever is a no-code machine learning platform that empowers users to build powerful ML models with one click, explore what-if scenarios to guide decisions, and create interactive dashboards to explain results. It combines automated machine learning, interactive dashboards, and flexible prediction tools in one platform, allowing users to transform data into business insights without the need for data scientists or coding skills.

Julius AI
Julius AI is an advanced AI data analyst tool that allows users to analyze data with computational AI, chat with files to get expert-level insights, create sleek data visualizations, perform modeling and predictive forecasting, solve math, physics, and chemistry problems, generate polished analyses and summaries, save time by automating data work, and unlock statistical modeling without complexity. It offers features like generating visualizations, asking data questions, effortless cleaning, instant data export, creating animations, and supercharging data analysis. Julius AI is loved by over 1,200,000 users worldwide and is designed to help knowledge workers make the most out of their data.
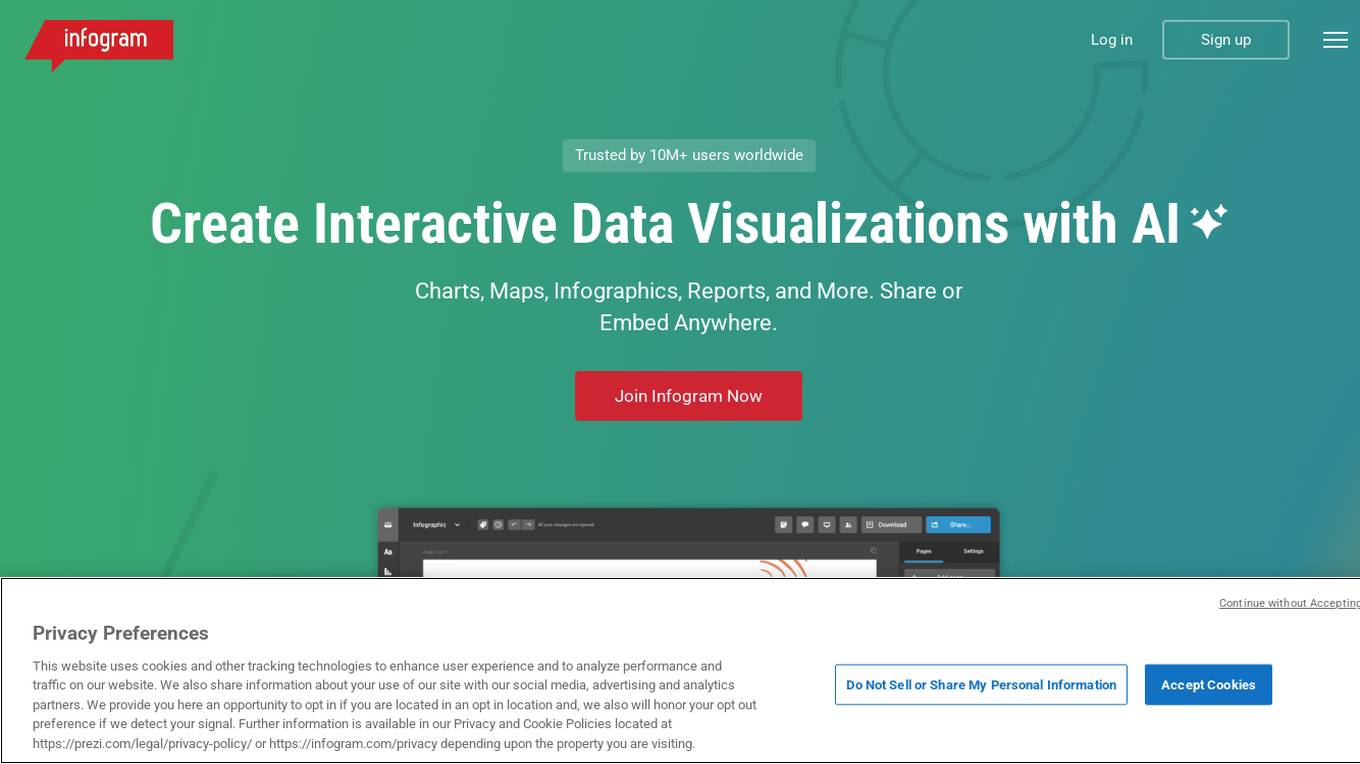
Infogram
Infogram is an AI-powered platform that enables users to create interactive data visualizations, infographics, reports, maps, charts, tables, slides, and dashboards effortlessly. With a wide range of features such as AI chart recommendations, interactive content, embeds, custom maps, data import, and advanced editing tools, Infogram empowers users to craft compelling visual stories. The platform also offers content engagement analytics, real-time collaboration, and a brand kit for consistent branding. Trusted by over 10 million users worldwide, Infogram is a go-to tool for individuals, teams, and organizations looking to transform data into engaging visuals.
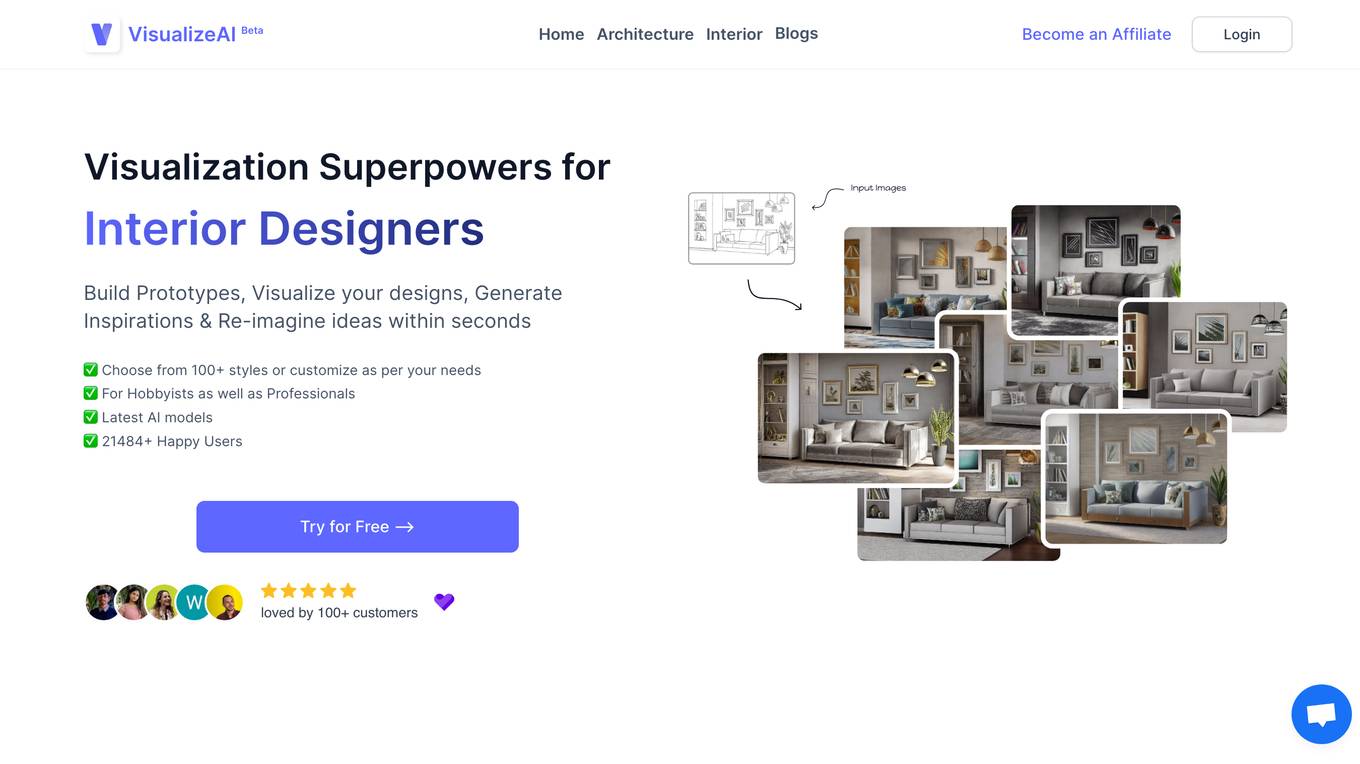
VisualizeAI
VisualizeAI is a powerful AI-powered platform that helps businesses visualize and analyze their data. With VisualizeAI, you can easily create stunning data visualizations, dashboards, and reports that will help you make better decisions. VisualizeAI is perfect for businesses of all sizes, from startups to large enterprises. It is easy to use and affordable, and it can help you save time and money while improving your decision-making.
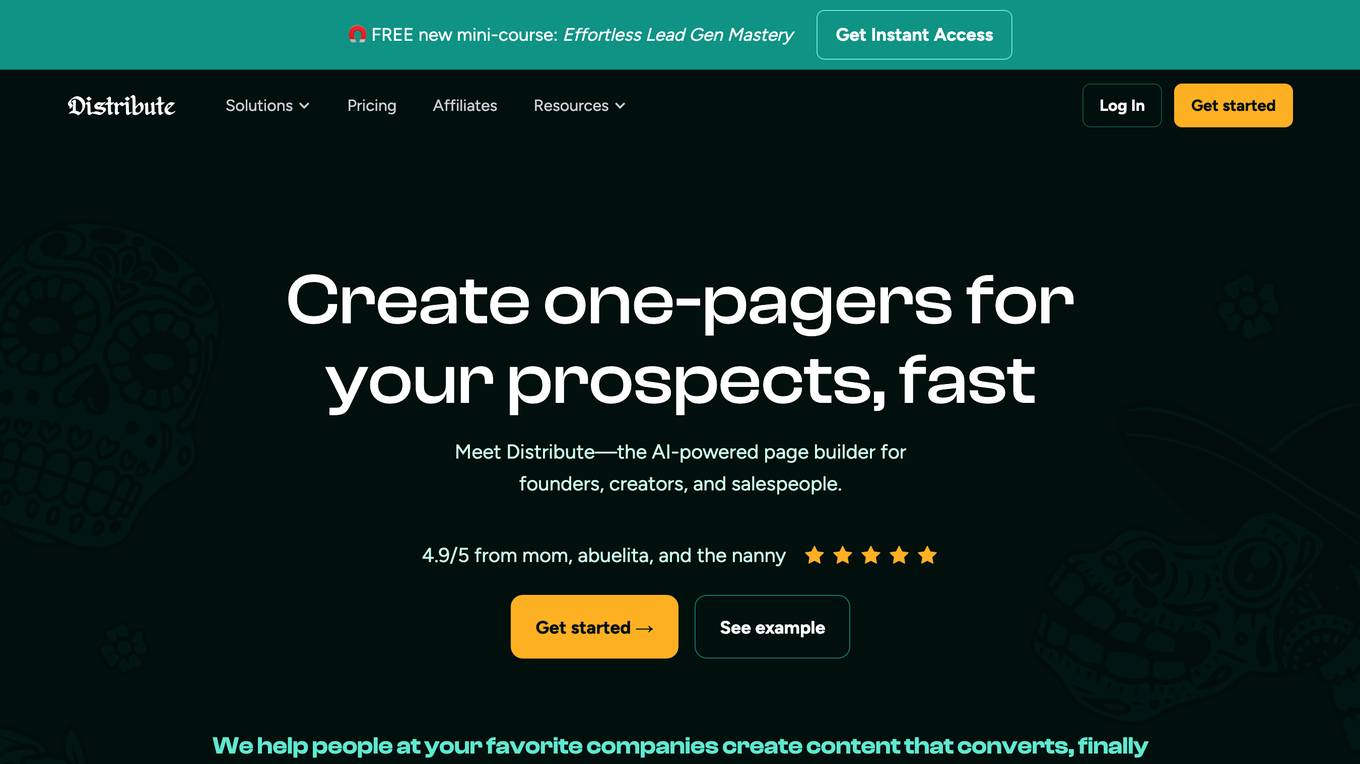
Distribute
Distribute is an AI-powered Deal Room application designed to help sales teams streamline their sales process and close deals faster. It automatically turns sales conversations into follow-ups, business cases, and action plans, enabling users to win more deals with less effort. The platform offers features such as AI meeting synthesis, personalized action points, engagement tracking, custom ROI visualizations, tailored value messaging, and immediate sharing capabilities. Distribute also provides advantages like saving time and money, increasing close rates, enabling real-time collaboration, building AI-powered deals, and offering branded templates for content creation. However, it has disadvantages such as limited customization options, potential security concerns, and dependency on internet connectivity.
Looker
Looker is a business intelligence platform that offers embedded analytics and AI-powered BI solutions. Leveraging Google's AI-led innovation, Looker delivers intelligent BI by combining foundational AI, cloud-first infrastructure, industry-leading APIs, and a flexible semantic layer. It allows users to build custom data experiences, transform data into integrated experiences, and create deeply integrated dashboards. Looker also provides a universal semantic modeling layer for unified, trusted data sources and offers self-service analytics capabilities through Looker and Looker Studio. Additionally, Looker features Gemini, an AI-powered analytics assistant that accelerates analytical workflows and offers a collaborative and conversational user experience.
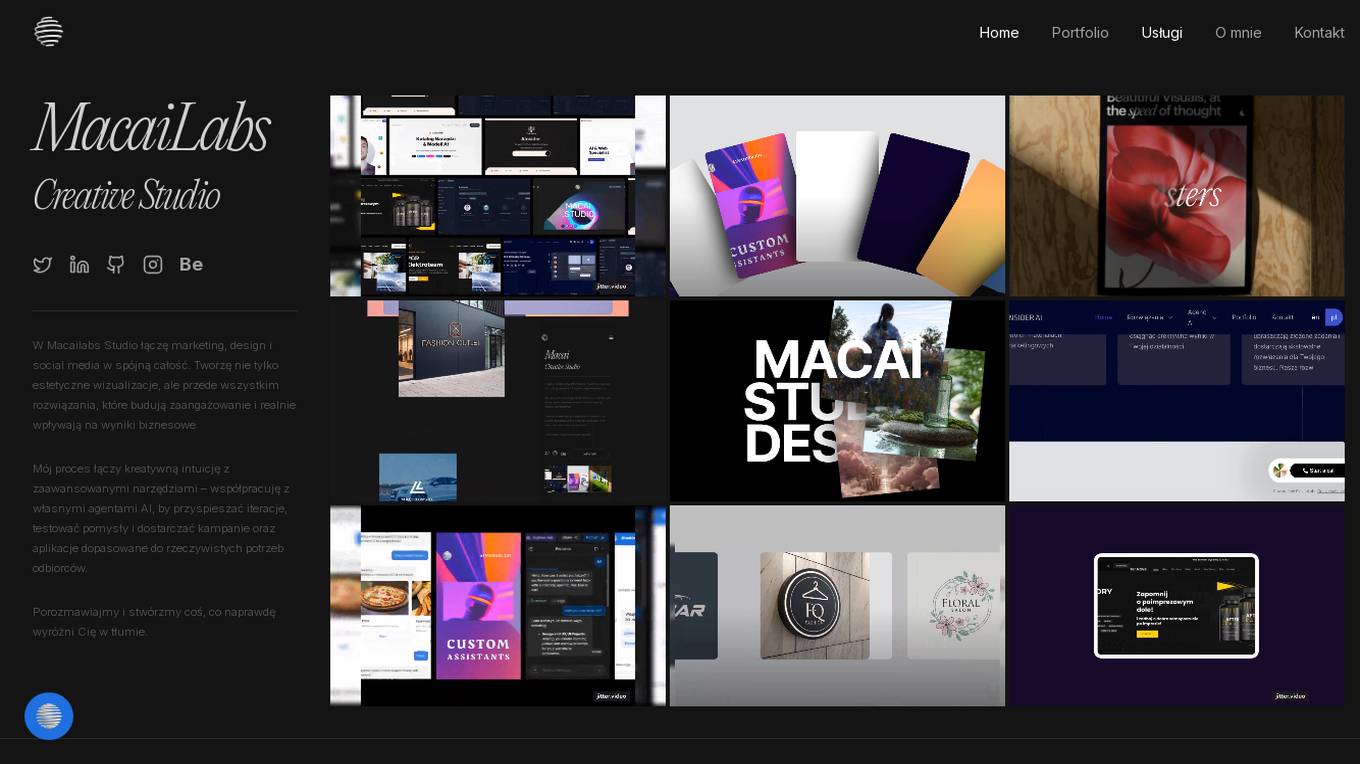
MacaiLabs Creative Studio
MacaiLabs Creative Studio is a fullstack creative studio that combines marketing, design, and social media into cohesive solutions. They focus on creating engaging visualizations that drive real business results by leveraging creative intuition and advanced AI tools. The studio collaborates with its own AI agents to accelerate iterations, test ideas, and deliver campaigns and applications tailored to the actual needs of the audience. MacaiLabs aims to create unique and standout solutions for their clients.
Rerun
Rerun is an SDK, time-series database, and visualizer for temporal and multimodal data. It is used in fields like robotics, spatial computing, 2D/3D simulation, and finance to verify, debug, and explain data. Rerun allows users to log data like tensors, point clouds, and text to create streams, visualize and interact with live and recorded streams, build layouts, customize visualizations, and extend data and UI functionalities. The application provides a composable data model, dynamic schemas, and custom views for enhanced data visualization and analysis.

Coursera
Coursera is an online learning platform that offers courses, specializations, and degrees from top universities and companies. It provides a wide range of subjects, including business, computer science, data science, and more. Coursera also offers a variety of learning formats, including self-paced courses, live online classes, and guided projects. With Coursera, you can learn at your own pace and on your own schedule.

Dr. Randal S. Olson
Dr. Randal S. Olson is an AI Researcher & Builder known for turning ambitious AI ideas into business wins by bridging the gap between technical promise and real-world impact. His work encompasses data science, AI engineering, and executive strategy. He has worked on various projects in AI, data science, and technology leadership, including the development of the Truesight Expert-grounded AI evaluation platform and the AutoML Tool TPOT. Dr. Olson's focus is on building privacy-first AI solutions that prioritize ethical AI development and user-centric design.

Streamlit
Streamlit is a web application framework that allows users to create interactive web applications effortlessly using Python. It enables data scientists and developers to build and deploy data-driven applications quickly and easily. With Streamlit, users can create interactive visualizations, dashboards, and machine learning models without the need for extensive web development knowledge. The platform provides a simple and intuitive way to turn data scripts into shareable web apps, making it ideal for prototyping, showcasing projects, and sharing insights with others.
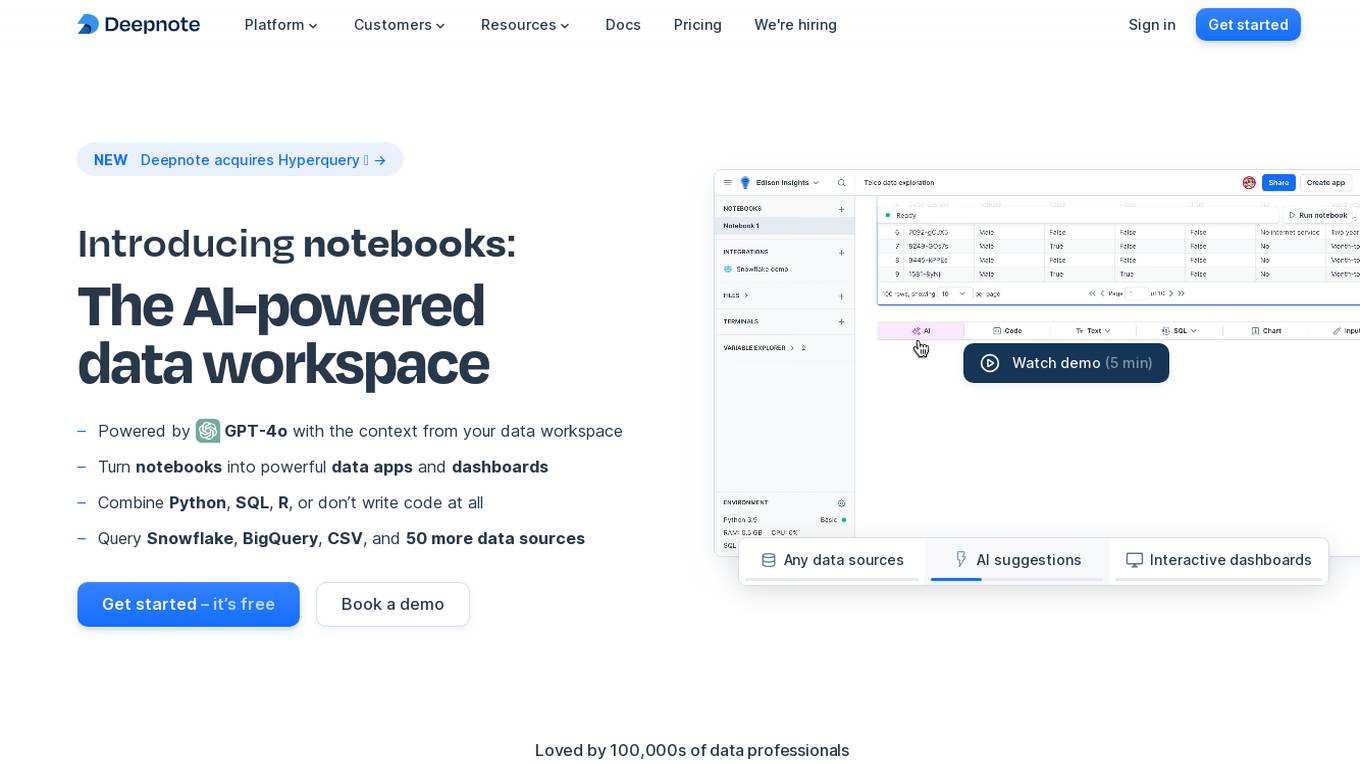
Deepnote
Deepnote is an AI-powered analytics and data science notebook platform designed for teams. It allows users to turn notebooks into powerful data apps and dashboards, combining Python, SQL, R, or even working without writing code at all. With Deepnote, users can query various data sources, generate code, explain code, and create interactive visualizations effortlessly. The platform offers features like collaborative workspaces, scheduling notebooks, deploying APIs, and integrating with popular data warehouses and databases. Deepnote prioritizes security and compliance, providing users with control over data access and encryption. It is loved by a community of data professionals and widely used in universities and by data analysts and scientists.
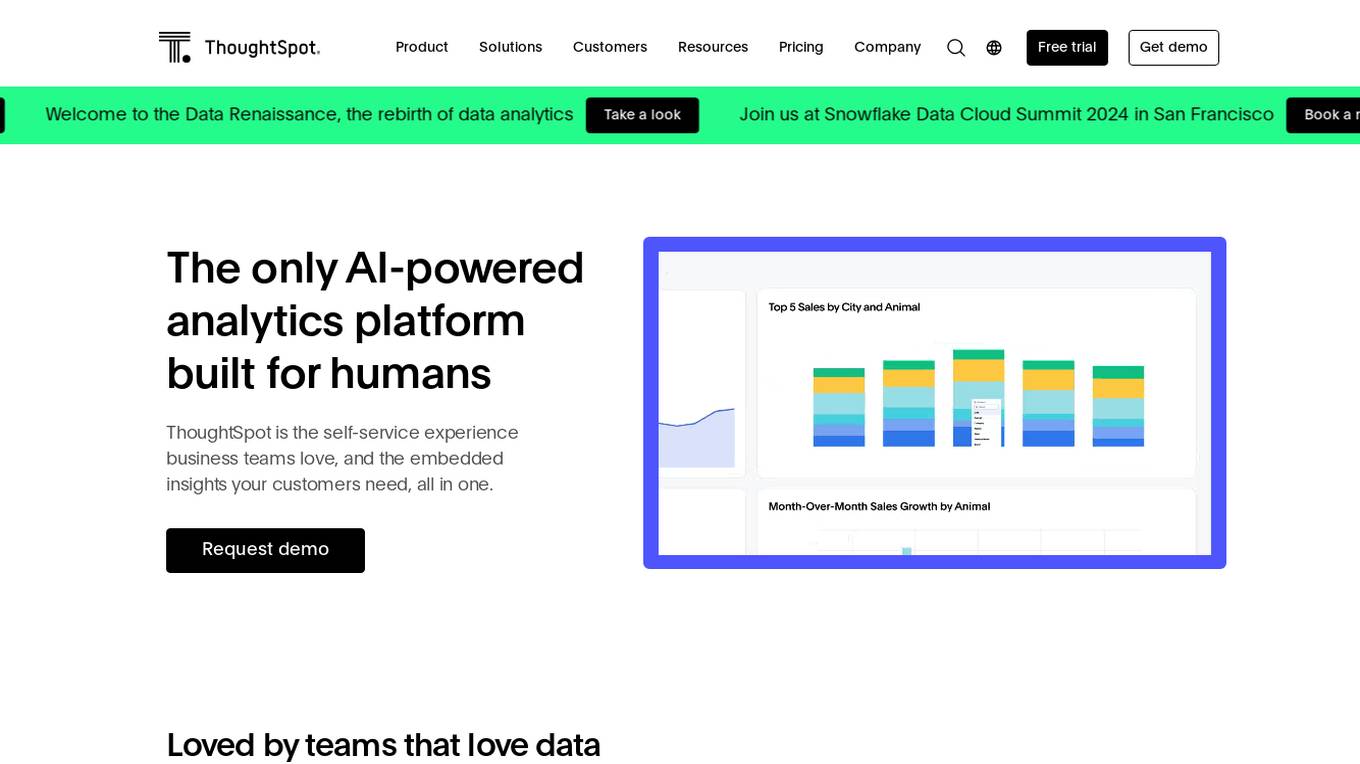
ThoughtSpot
ThoughtSpot is an AI-powered analytics platform that enables users to deliver insights 10x faster for their employees. It offers AI-powered search capabilities, natural language search, live querying of data, building search data models, balancing self-service with enterprise-scale control, visualizing business data, operationalizing data sync to business apps, and mobile access. The platform also provides features for creating visualizations from spreadsheets, staying up to date with product news, embedding analytics into apps, building ThoughtSpot apps and API services, and generating more revenue with embedded analytics. ThoughtSpot is designed to provide fast, actionable insights with a focus on user experience and self-service analytics.
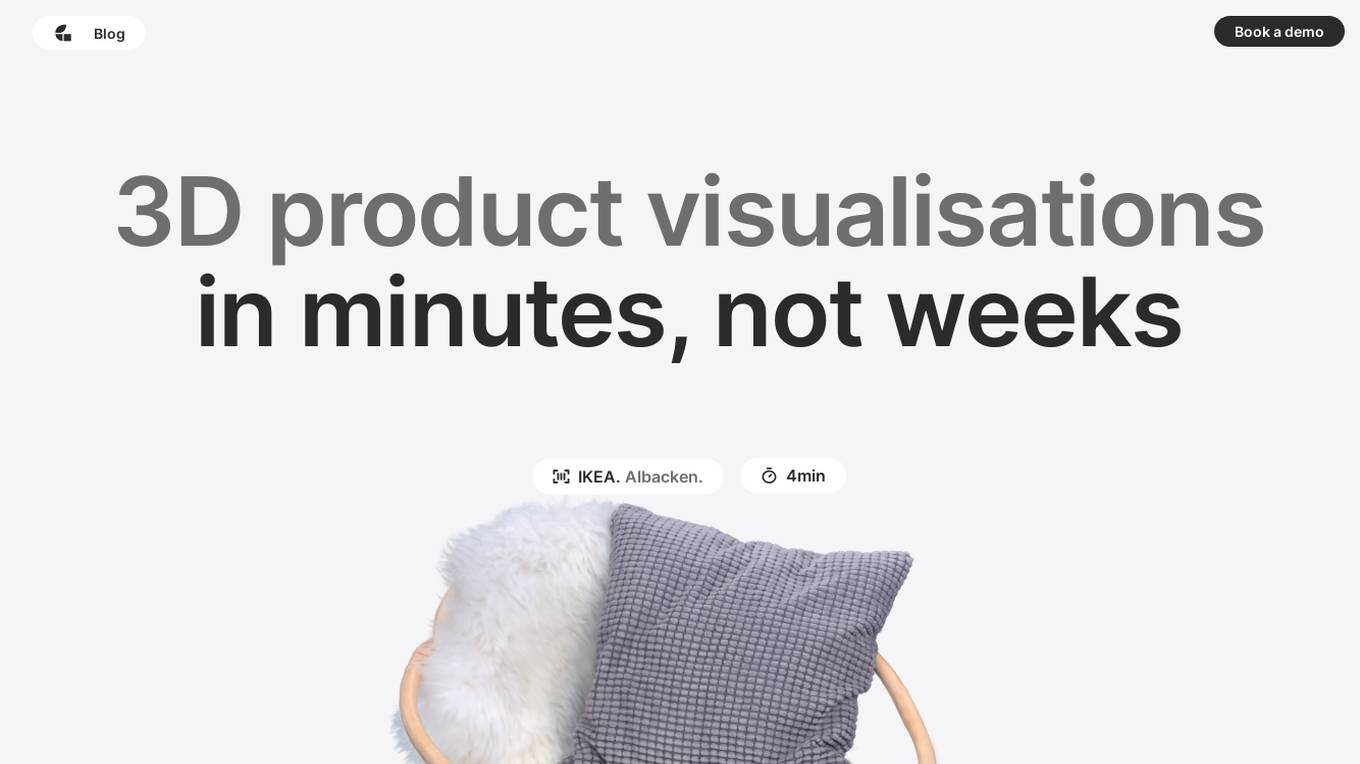
Graswald.ai
Graswald.ai is an AI-powered platform that enables users to create 3D product visualizations in minutes, without the need for 3D modeling expertise. The platform uses AI to convert a video of a product into a 3D model, which can then be used to create high-quality product images, videos, and AR experiences. Graswald.ai is designed to help businesses save time and money on product visualization, while also improving conversion rates and reducing return rates.

Streamlit
Streamlit is a web application framework that allows data scientists and machine learning engineers to create interactive web applications quickly and easily. It simplifies the process of building and sharing data-focused applications by providing a simple Python script that can be turned into a shareable web app with just a few lines of code. With Streamlit, users can create interactive visualizations, dashboards, and machine learning models without the need for web development expertise.
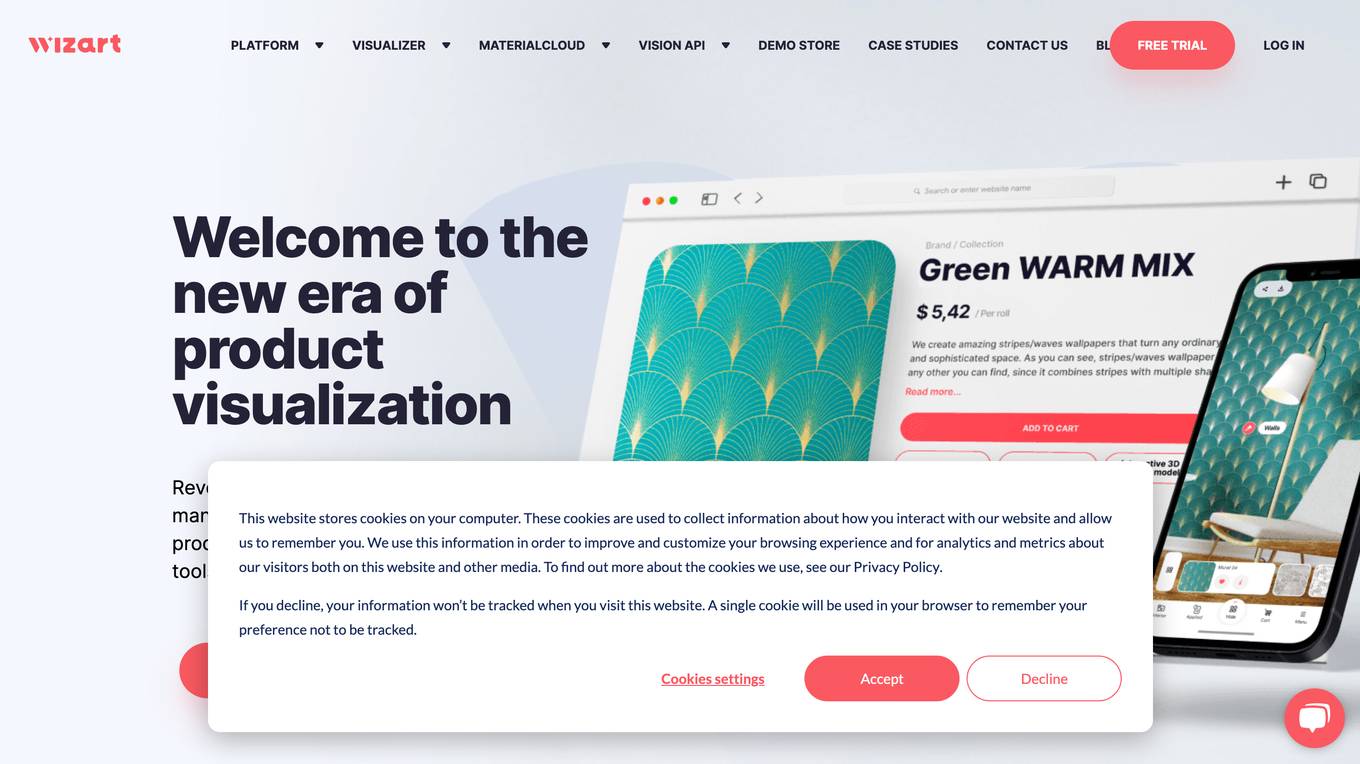
Wizart
Wizart is a comprehensive platform that provides AI-powered visualization solutions for businesses. It offers a range of tools and services to help companies create engaging and immersive product visualizations, including a visualizer, material cloud, and vision API. With Wizart, businesses can eliminate the imagination gap and increase customer engagement by providing high-quality product content, such as renders, videos, and interactive models.
0 - Open Source AI Tools
20 - OpenAI Gpts
Streamlit Assistant
This GPT can read all Streamlit Documantation and helps you about Streamlit.
Vicky Vega
Generates Vega-Lite JSON code for Power BI visuals from data and descriptions.
AnalystGPT
Expert in Alteryx, Power BI, Power Automate, Python, MySQL, Salesforce, & Tableau
Addy™ for Power BI Data Analytics
Advisor for Power BI Analytics, aiding in solution planning, design, and construction. Ask Hi or type /help for how to get started.